| Param | Original file | Final file |
|---|---|---|
| Filename | modeM0/AS1C07_001T12_9000005366_38129cztM0_level2.fits | modeM0/AS1C07_001T12_9000005366_38129cztM0_level2_quad_clean.evt |
| Size (bytes) | 335,635,200 | 96,304,320 |
| Size | 320.1 MB | 91.8 MB |
| Events in quadrant A | 3,792,300 | 650,493 |
| Events in quadrant B | 2,554,992 | 679,375 |
| Events in quadrant C | 2,596,748 | 647,479 |
| Events in quadrant D | 3,076,450 | 575,875 |
| Mode M0 | |||
|---|---|---|---|
| Quadrant | BADHDUFLAG | Total packets | Discarded packets |
| A | 0 | 14769 | 3 |
| B | 0 | 11000 | 2 |
| C | 0 | 10753 | 2 |
| D | 0 | 12645 | 2 |
| Mode M9 | |||
|---|---|---|---|
| Quadrant | BADHDUFLAG | Total packets | Discarded packets |
| A | 0 | 30 | 0 |
| B | 0 | 30 | 0 |
| C | 0 | 30 | 0 |
| D | 0 | 31 | 0 |
| Mode SS | |||
|---|---|---|---|
| Quadrant | BADHDUFLAG | Total packets | Discarded packets |
| A | 0 | 106 | 0 |
| B | 0 | 106 | 0 |
| C | 0 | 106 | 0 |
| D | 0 | 106 | 0 |
| Quadrant | Total seconds | Saturated seconds | Saturation percentage |
|---|---|---|---|
| A | 5183 | 53 | 1.022574% |
| B | 5183 | 31 | 0.598109% |
| C | 5183 | 13 | 0.250820% |
| D | 5183 | 161 | 3.106309% |
Noise dominated data is calculated using 1-second bins in cleaned event files. If a bin has >2000 counts, and if more than 50% of those come from <1% of pixels, then it is considered to be noise-dominated and hence unusable.
| Quadrant | # 1 sec bins | Bins with >0 counts | Bins with >2000 counts | High rate bins dominated by noise | Noise dominated (total time) | Noise dominated (detector-on time) | Marked lightcurve |
|---|---|---|---|---|---|---|---|
| A | 7306 | 5184 | 36 | 36 | 0.49% | 0.69% | 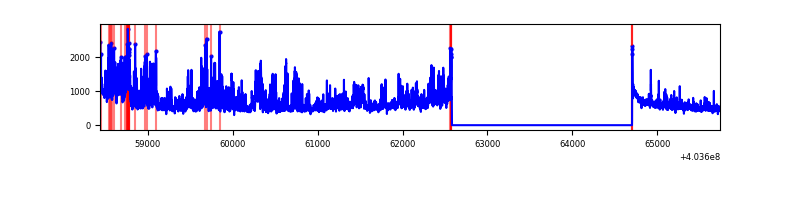 |
| B | 7306 | 5184 | 14 | 14 | 0.19% | 0.27% | 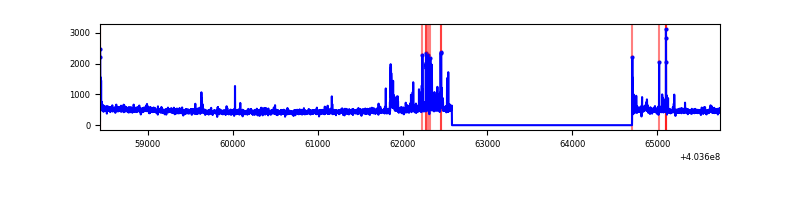 |
| C | 7306 | 5184 | 8 | 8 | 0.11% | 0.15% | 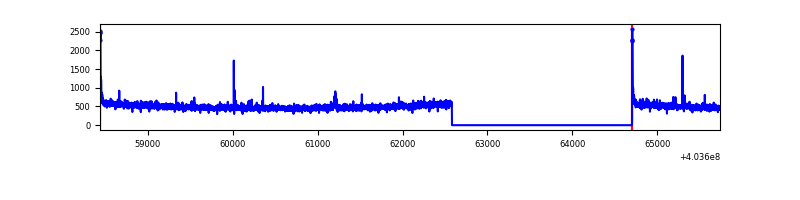 |
| D | 7306 | 5184 | 135 | 135 | 1.85% | 2.60% | 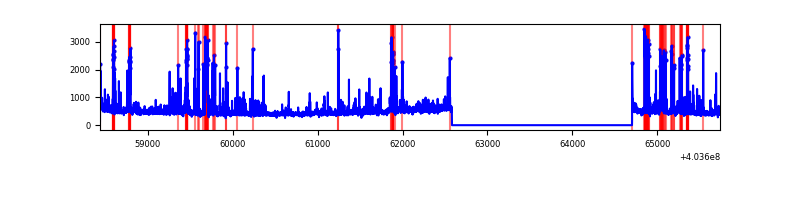 |
Top three noisy pixels from each quadrant. If the there are fewer than three noisy pixels in the level2.evt file, extra rows are filled as -1
| Pixel properties | Quadrant properties | ||||||
|---|---|---|---|---|---|---|---|
| Quadrant | DetID | PixID | Counts | Sigma | Mean | Median | Sigma |
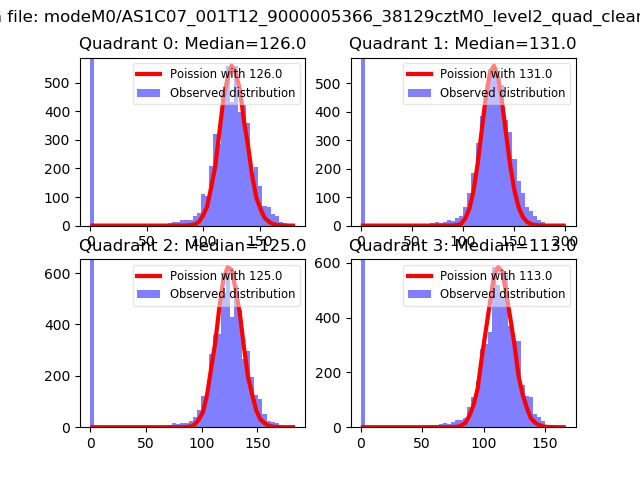
| A | 12 | 16 | 957685 | 8066.26 | 593 | 585 | 118.7 |
| A | 10 | 83 | 352433 | 2965.31 | 593 | 585 | 118.7 |
| A | 12 | 194 | 139963 | 1174.65 | 593 | 585 | 118.7 |
| B | 0 | 229 | 62987 | 555.49 | 599 | 584 | 112.3 |
| B | 4 | 171 | 56737 | 499.86 | 599 | 584 | 112.3 |
| B | 5 | 172 | 52090 | 458.49 | 599 | 584 | 112.3 |
| C | 15 | 214 | 218098 | 1608.63 | 585 | 588 | 135.2 |
| C | 0 | 10 | 31203 | 226.42 | 585 | 588 | 135.2 |
| C | 3 | 233 | 29196 | 211.58 | 585 | 588 | 135.2 |
| D | 13 | 249 | 415620 | 3036.15 | 569 | 555 | 136.7 |
| D | 4 | 239 | 147701 | 1076.36 | 569 | 555 | 136.7 |
| D | 7 | 55 | 100098 | 728.15 | 569 | 555 | 136.7 |
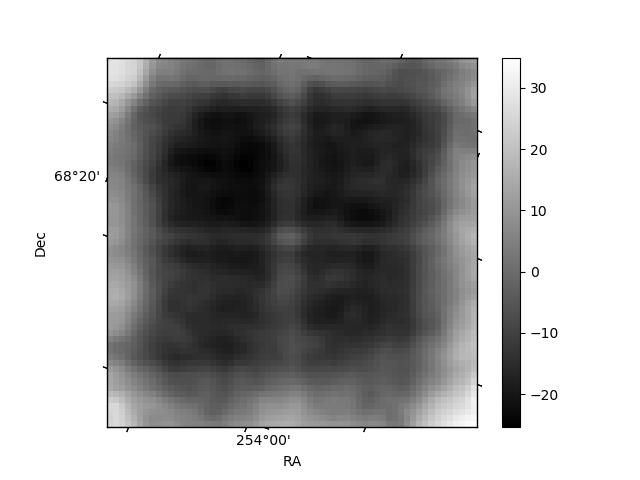
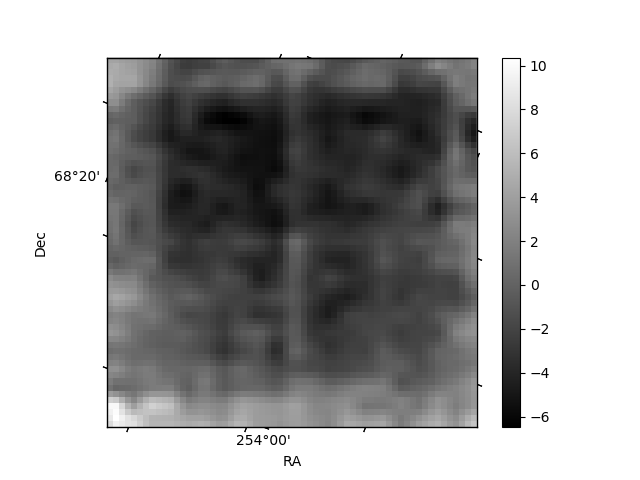
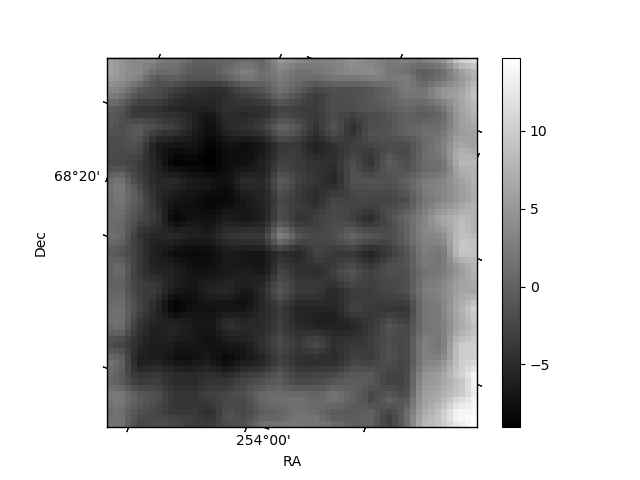
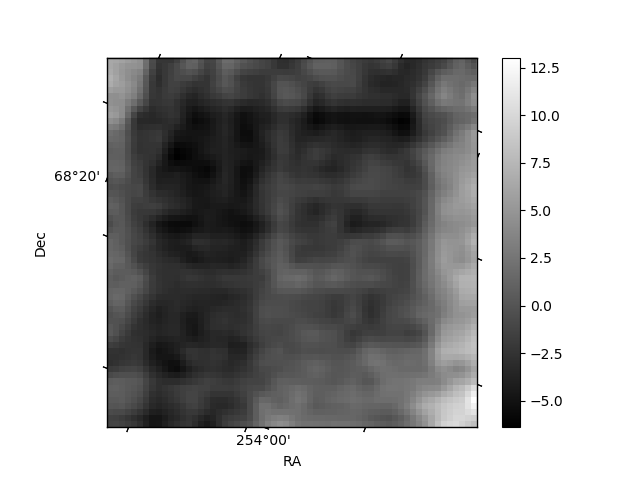
Histogram calculated using DETX and DETY for each event in the final _common_clean file
| Quadrant A | 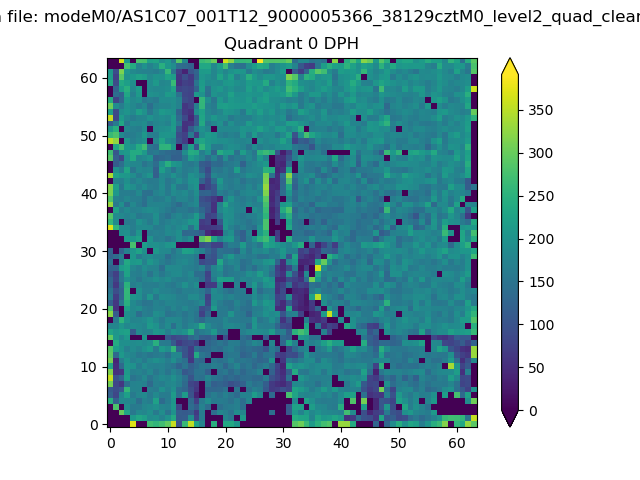 |
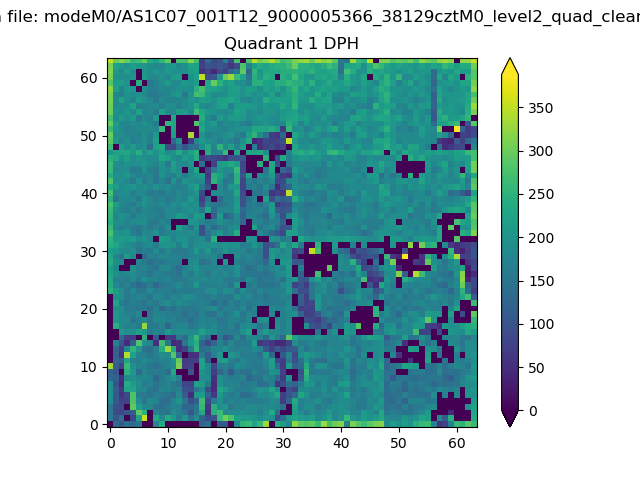 |
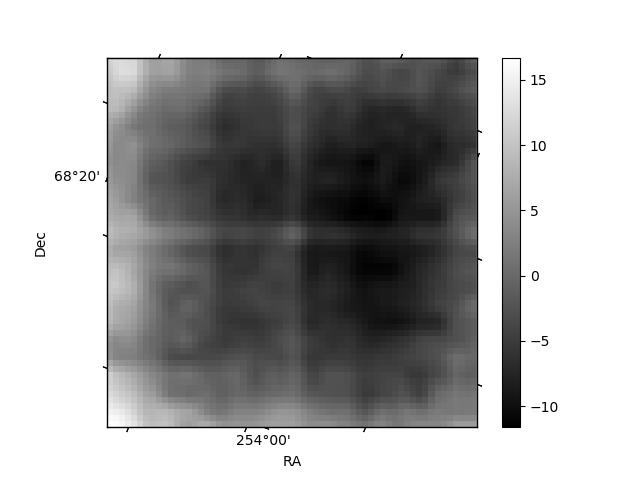
Quadrant B |
|---|---|---|---|
| Quadrant D | 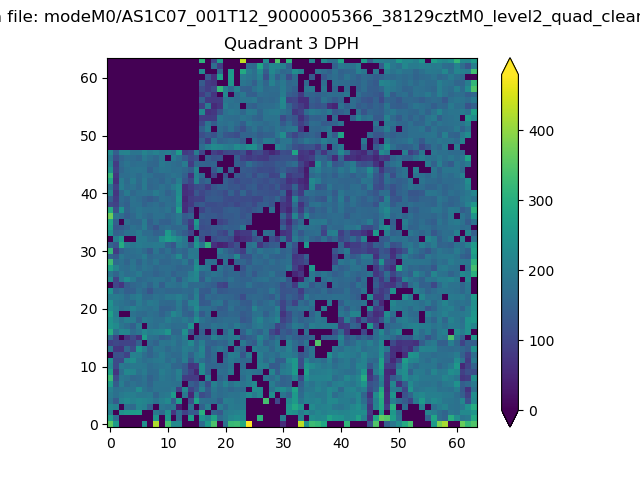 |
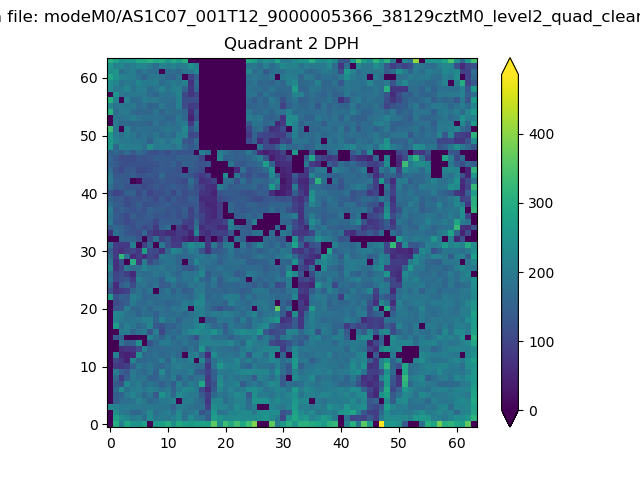 |
Quadrant C |
| Plot type | Count rate plots | Images |
|---|---|---|
| Comparison with Poisson distribution Blue bars denote a histogram of data divided into 1 sec bins. Red curve is a Poisson curve with rate = median count rate of data. |
 |
 |
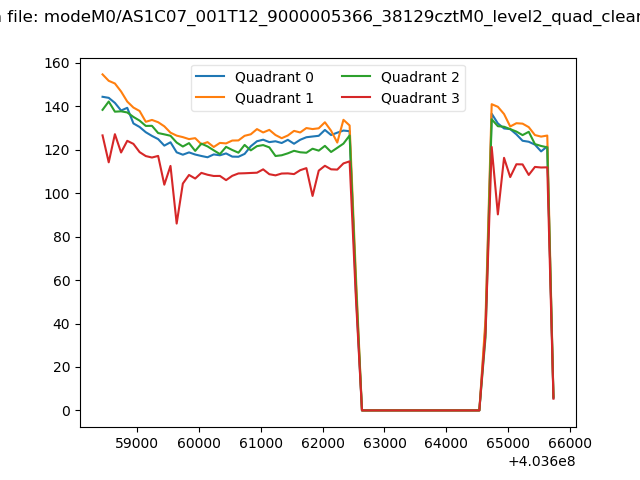
| Quadrant-wise count rates Data is divided into 100 sec bins |
 |
|
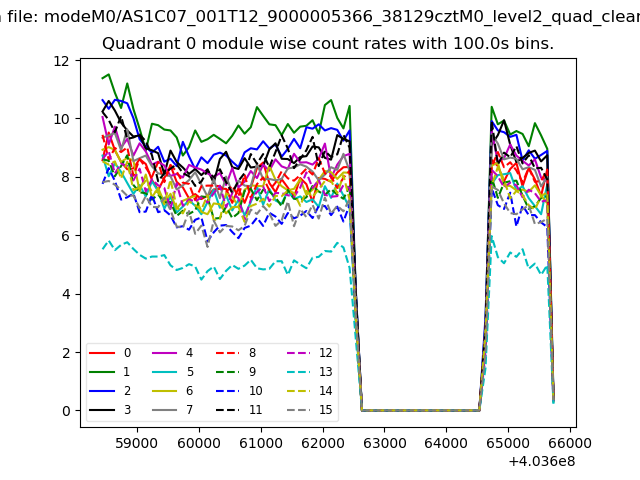
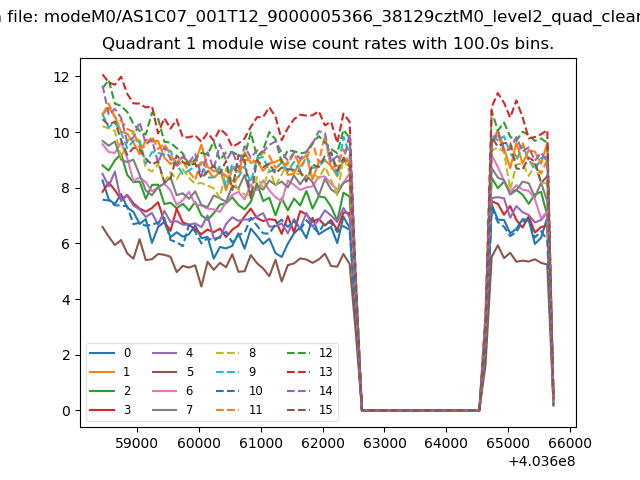
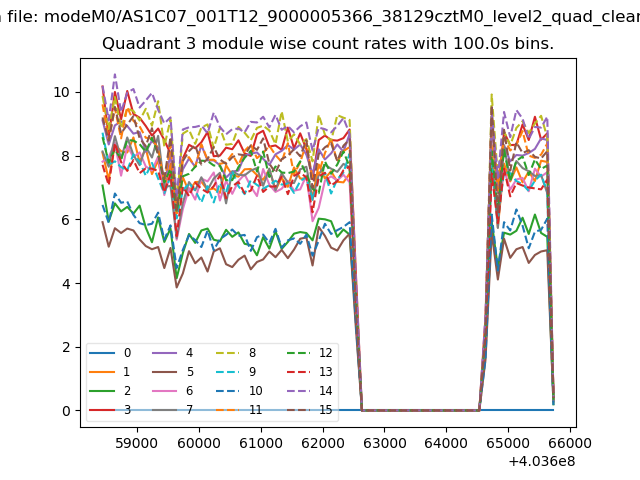
| Module-wise count rates for Quadrant A Data is divided into 100 sec bins |
 |
 |
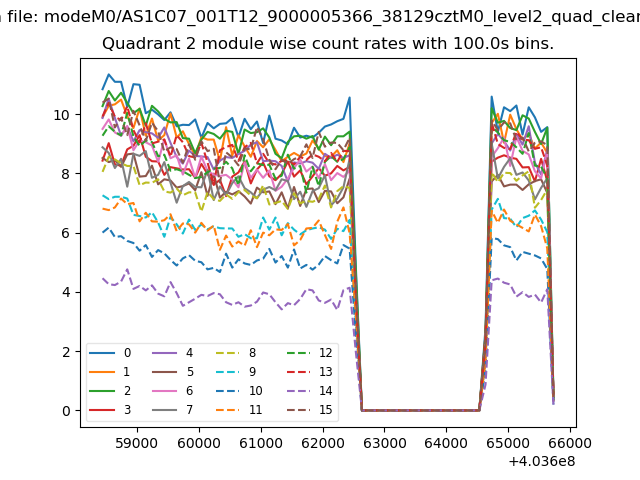
| Module-wise count rates for Quadrant B Data is divided into 100 sec bins |
 |
 |
| Module-wise count rates for Quadrant C Data is divided into 100 sec bins |
 |
 |
| Module-wise count rates for Quadrant D Data is divided into 100 sec bins |
 |
 |
| Parameter | Plot |
|---|---|
| CZT HV Monitor | 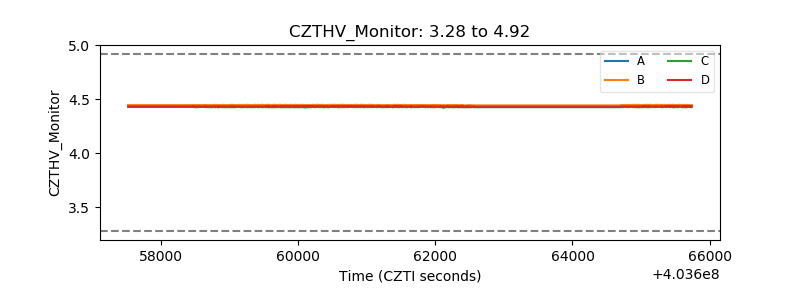 |
| D_VDD | 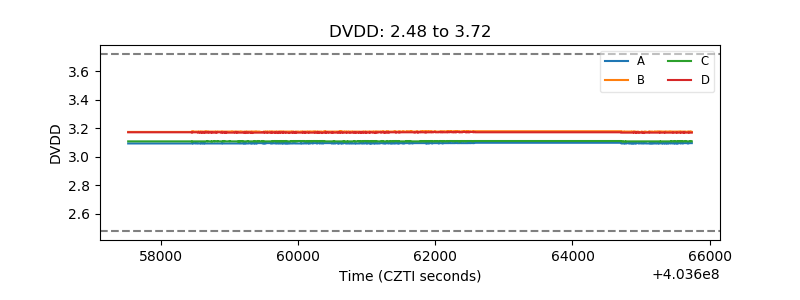 |
| Temperature 1 | 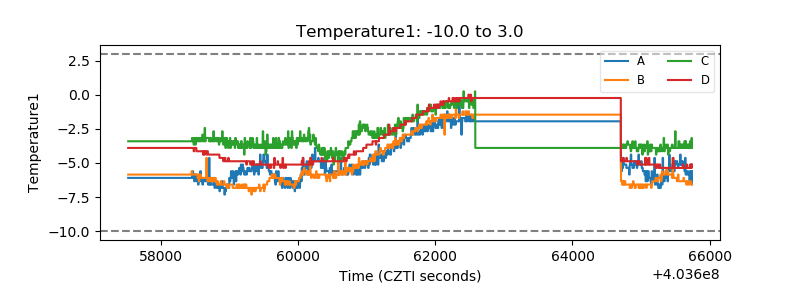 |
| Veto HV Monitor | 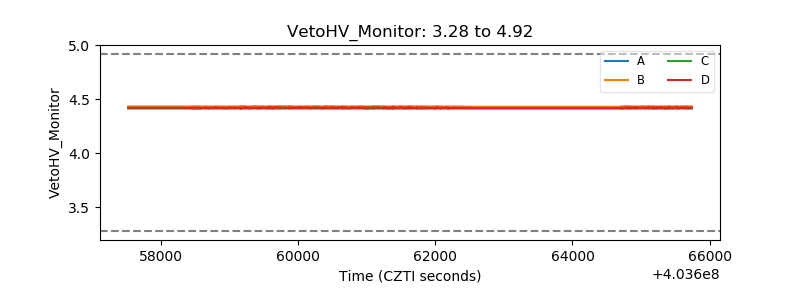 |
| Veto LLD | 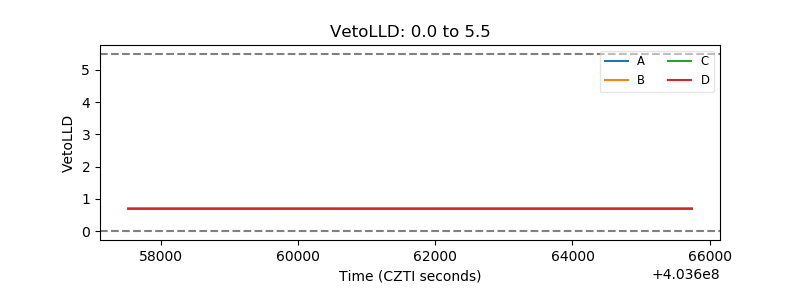 |
| Alpha Counter | 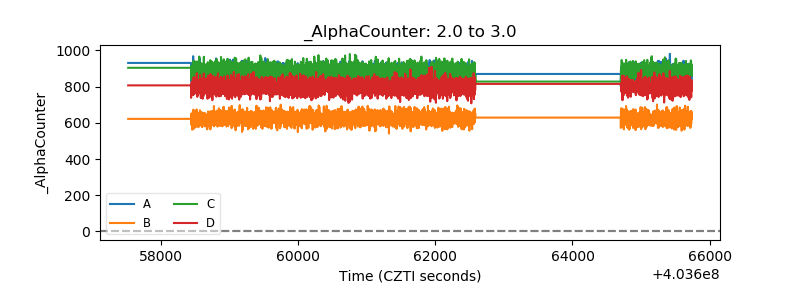 |
| _CPM_Rate | 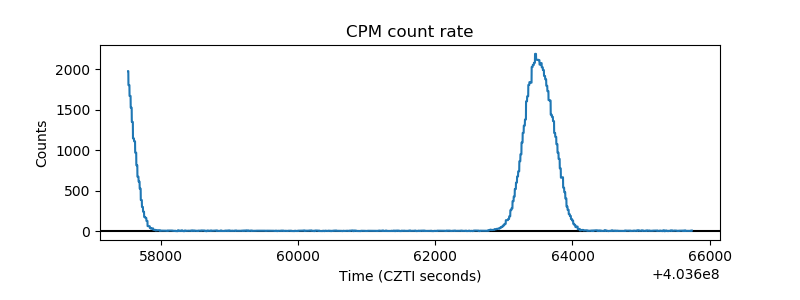 |
| CZT Counter | 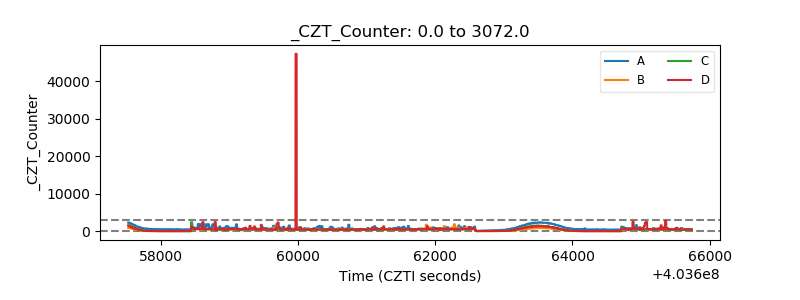 |
| +2.5 Volts monitor | 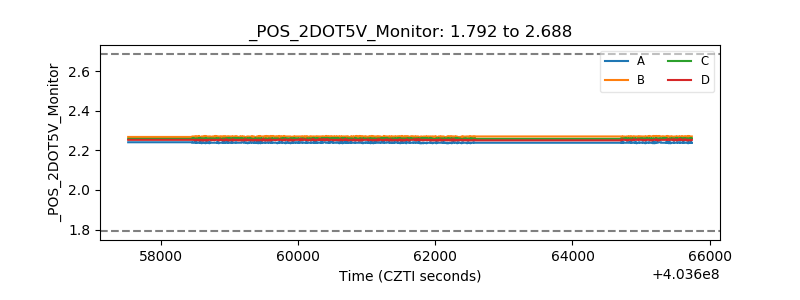 |
| +5 Volts monitor | 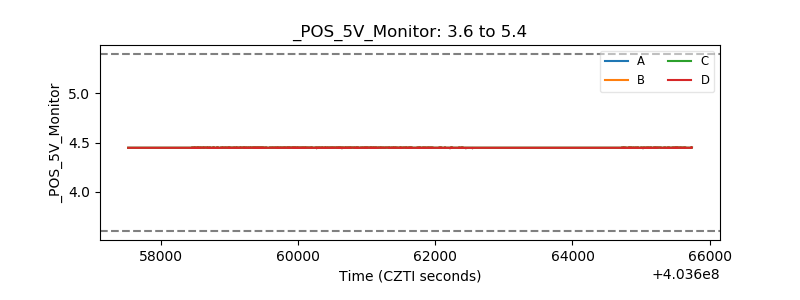 |
| _ROLL_ROT | 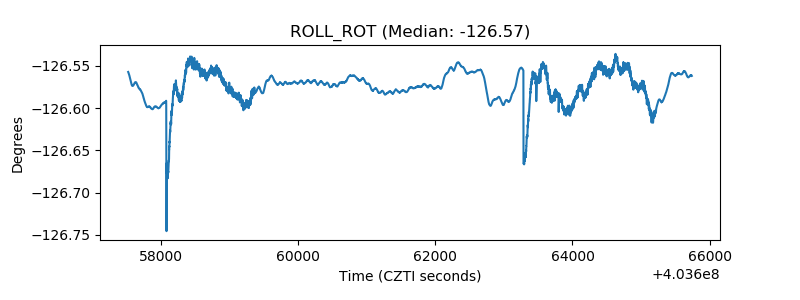 |
| _Roll_DEC | 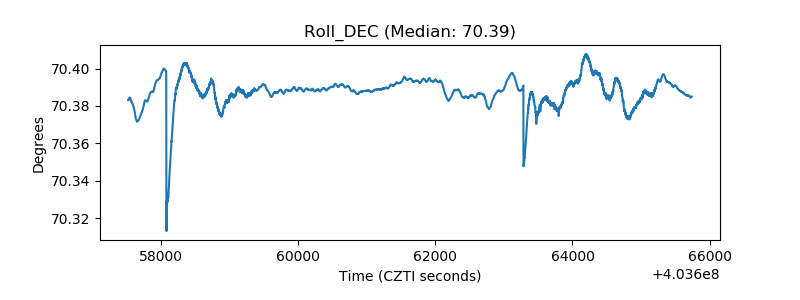 |
| _Roll_RA | 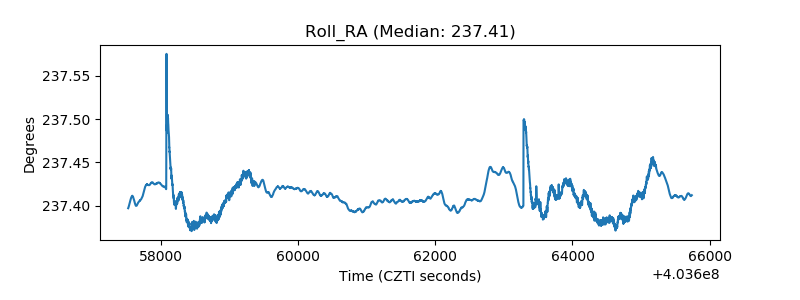 |
| Veto Counter | 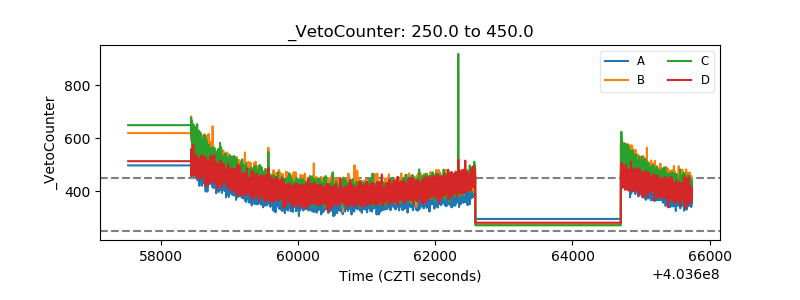 |