| Param | Original file | Final file |
|---|---|---|
| Filename | modeM0/AS1C07_001T12_9000005366_38130cztM0_level2.fits | modeM0/AS1C07_001T12_9000005366_38130cztM0_level2_quad_clean.evt |
| Size (bytes) | 304,727,040 | 91,794,240 |
| Size | 290.6 MB | 87.5 MB |
| Events in quadrant A | 2,937,310 | 621,828 |
| Events in quadrant B | 2,518,464 | 641,253 |
| Events in quadrant C | 2,530,820 | 611,192 |
| Events in quadrant D | 2,895,502 | 547,529 |
| Mode M0 | |||
|---|---|---|---|
| Quadrant | BADHDUFLAG | Total packets | Discarded packets |
| A | 0 | 11910 | 3 |
| B | 0 | 10863 | 2 |
| C | 0 | 10587 | 2 |
| D | 0 | 12199 | 2 |
| Mode M9 | |||
|---|---|---|---|
| Quadrant | BADHDUFLAG | Total packets | Discarded packets |
| A | 0 | 32 | 0 |
| B | 0 | 32 | 0 |
| C | 0 | 32 | 0 |
| D | 0 | 33 | 0 |
| Mode SS | |||
|---|---|---|---|
| Quadrant | BADHDUFLAG | Total packets | Discarded packets |
| A | 0 | 106 | 0 |
| B | 0 | 106 | 0 |
| C | 0 | 106 | 0 |
| D | 0 | 106 | 0 |
| Quadrant | Total seconds | Saturated seconds | Saturation percentage |
|---|---|---|---|
| A | 5102 | 15 | 0.294002% |
| B | 5102 | 36 | 0.705606% |
| C | 5102 | 14 | 0.274402% |
| D | 5102 | 132 | 2.587221% |
Noise dominated data is calculated using 1-second bins in cleaned event files. If a bin has >2000 counts, and if more than 50% of those come from <1% of pixels, then it is considered to be noise-dominated and hence unusable.
| Quadrant | # 1 sec bins | Bins with >0 counts | Bins with >2000 counts | High rate bins dominated by noise | Noise dominated (total time) | Noise dominated (detector-on time) | Marked lightcurve |
|---|---|---|---|---|---|---|---|
| A | 7225 | 5103 | 5 | 5 | 0.07% | 0.10% | 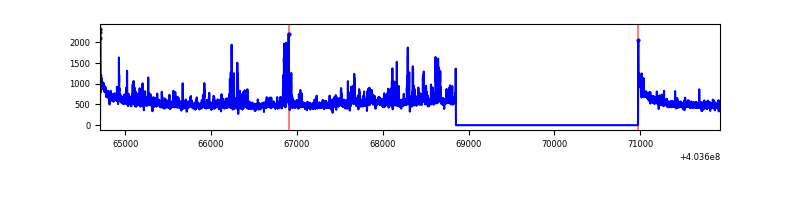 |
| B | 7225 | 5103 | 19 | 19 | 0.26% | 0.37% | 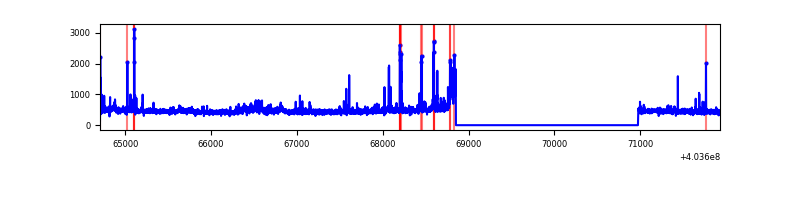 |
| C | 7225 | 5103 | 8 | 8 | 0.11% | 0.16% | 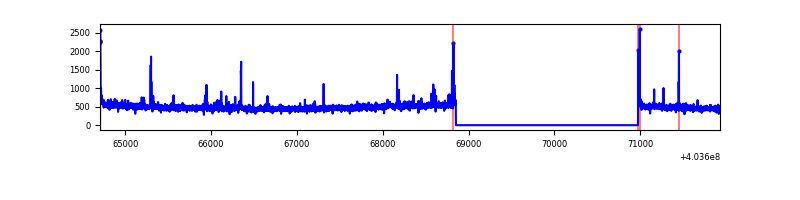 |
| D | 7225 | 5103 | 119 | 119 | 1.65% | 2.33% | 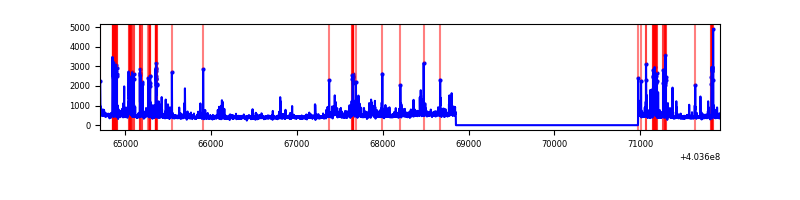 |
Top three noisy pixels from each quadrant. If the there are fewer than three noisy pixels in the level2.evt file, extra rows are filled as -1
| Pixel properties | Quadrant properties | ||||||
|---|---|---|---|---|---|---|---|
| Quadrant | DetID | PixID | Counts | Sigma | Mean | Median | Sigma |
| A | 10 | 83 | 359298 | 3074.74 | 576 | 566 | 116.7 |
| A | 12 | 16 | 248771 | 2127.4 | 576 | 566 | 116.7 |
| A | 12 | 194 | 43188 | 365.32 | 576 | 566 | 116.7 |
| B | 5 | 172 | 101528 | 927.84 | 575 | 559 | 108.8 |
| B | 4 | 171 | 94869 | 866.65 | 575 | 559 | 108.8 |
| B | 0 | 221 | 22376 | 200.48 | 575 | 559 | 108.8 |
| C | 15 | 214 | 215058 | 1655.71 | 557 | 562 | 129.5 |
| C | 1 | 23 | 63372 | 484.84 | 557 | 562 | 129.5 |
| C | 3 | 233 | 36947 | 280.86 | 557 | 562 | 129.5 |
| D | 13 | 249 | 404331 | 2986.74 | 549 | 532 | 135.2 |
| D | 4 | 239 | 99433 | 731.53 | 549 | 532 | 135.2 |
| D | 12 | 235 | 68509 | 502.8 | 549 | 532 | 135.2 |
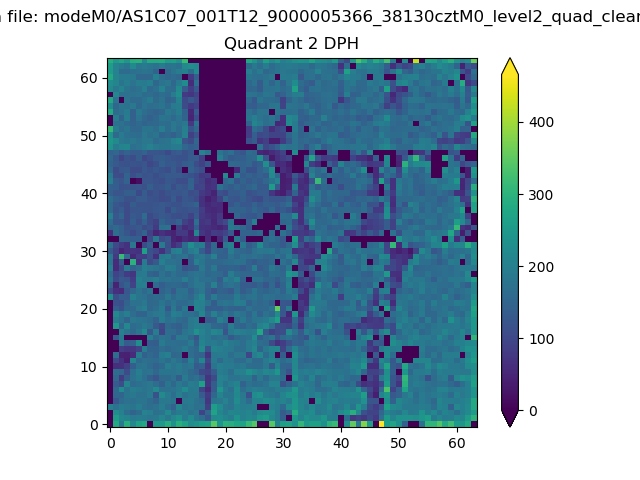
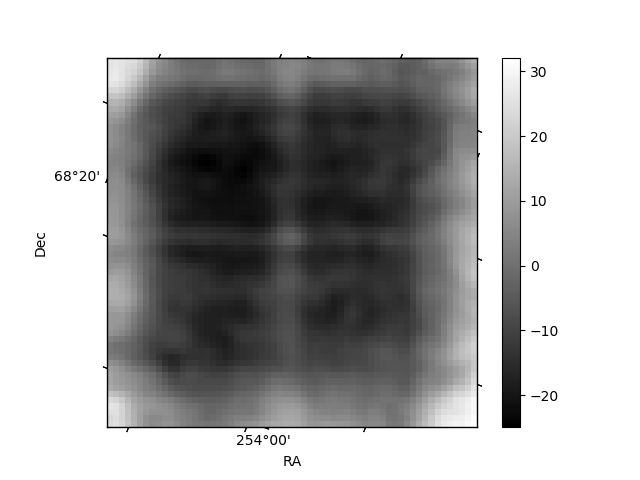
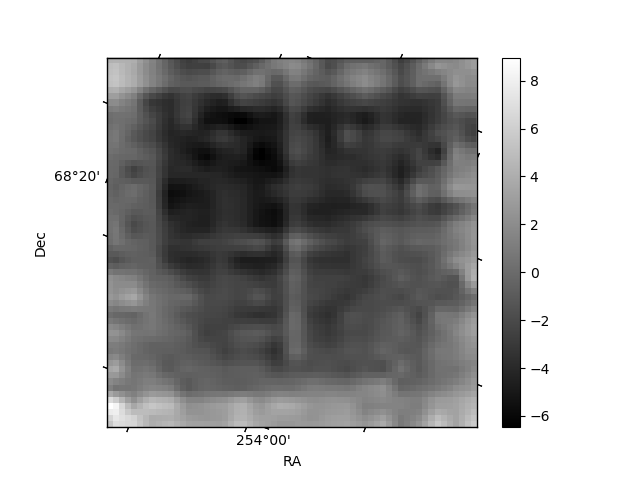
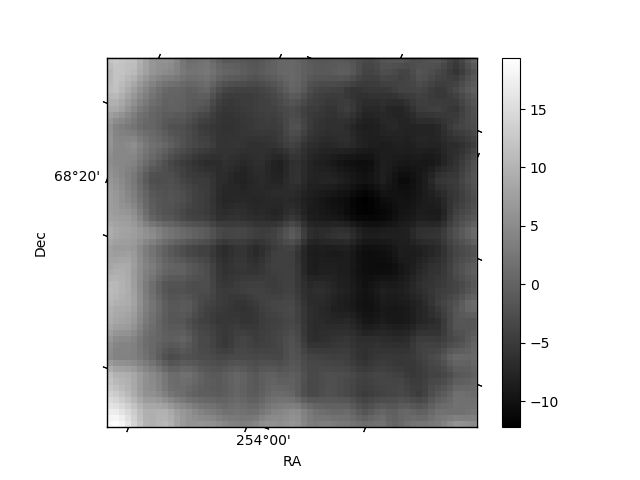
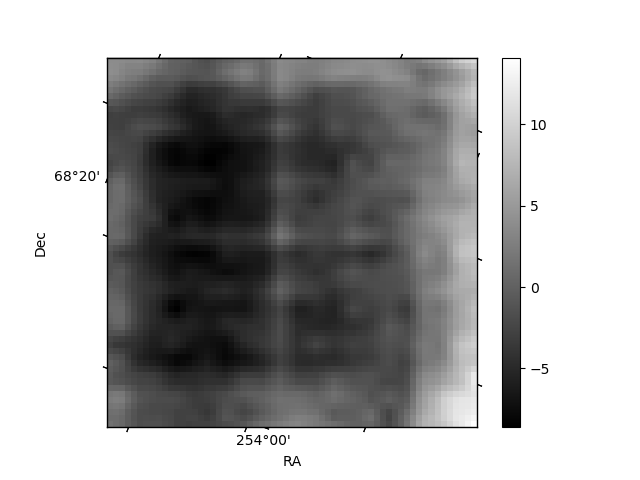
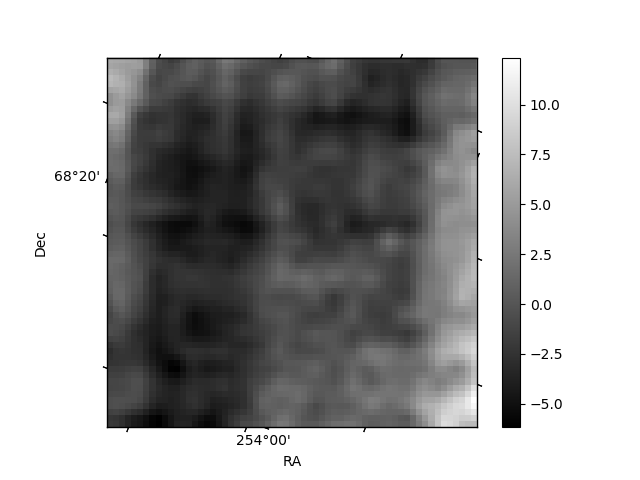
Histogram calculated using DETX and DETY for each event in the final _common_clean file
| Quadrant A | 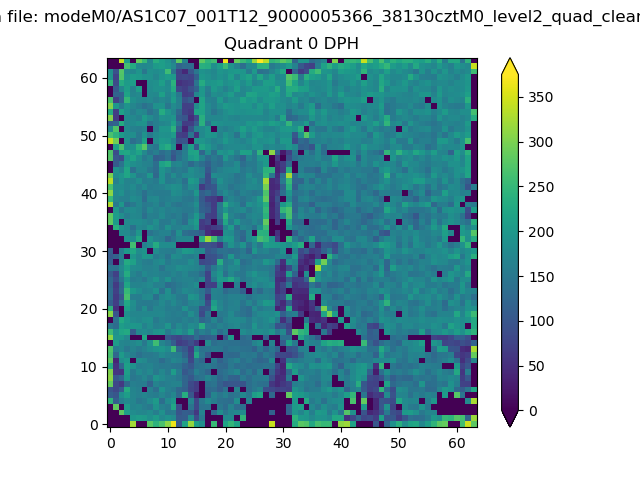 |
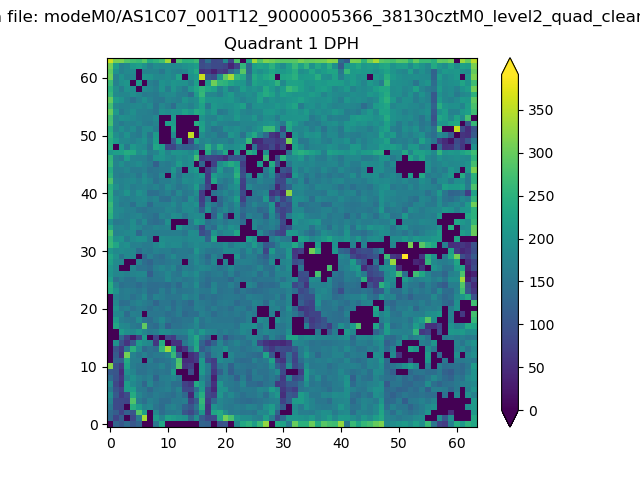 |
Quadrant B |
|---|---|---|---|
| Quadrant D | 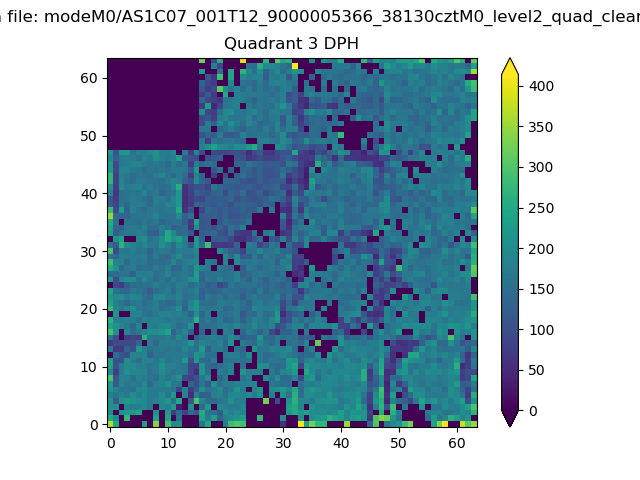 |
 |
Quadrant C |
| Plot type | Count rate plots | Images |
|---|---|---|
| Comparison with Poisson distribution Blue bars denote a histogram of data divided into 1 sec bins. Red curve is a Poisson curve with rate = median count rate of data. |
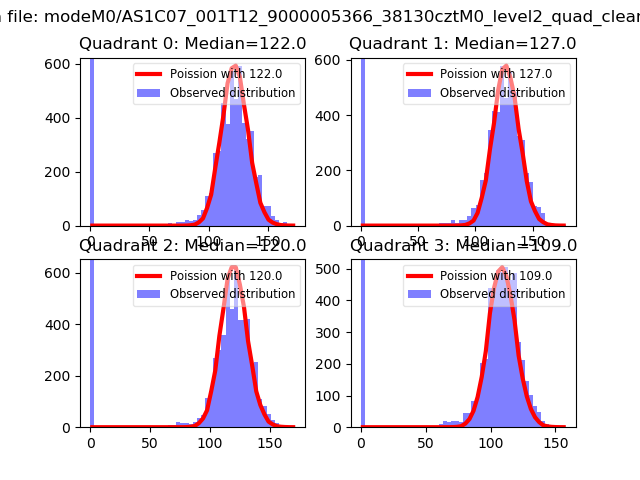 |
 |
| Quadrant-wise count rates Data is divided into 100 sec bins |
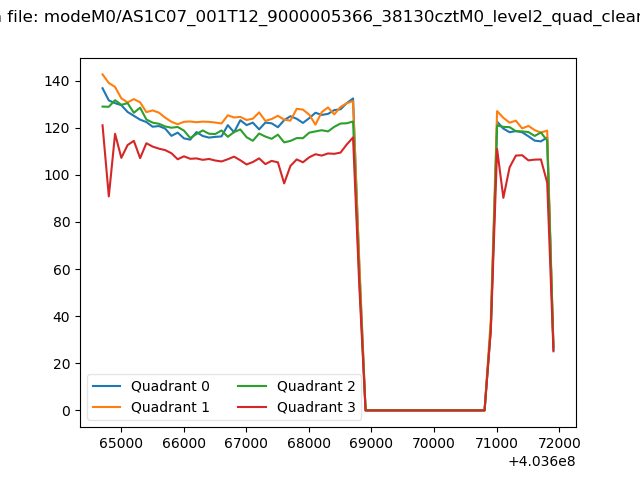 |
|
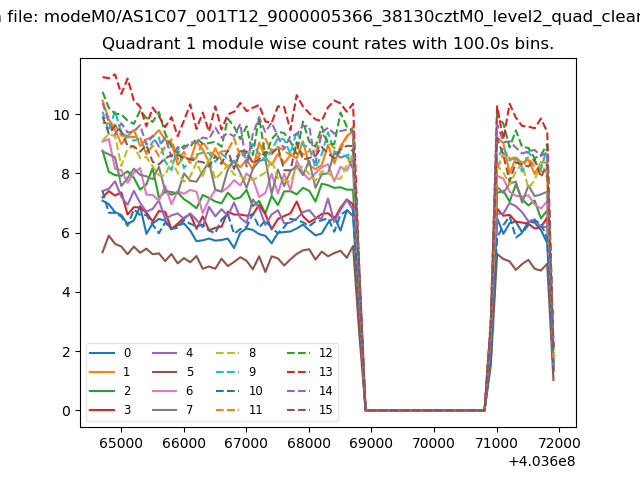
| Module-wise count rates for Quadrant A Data is divided into 100 sec bins |
 |
 |
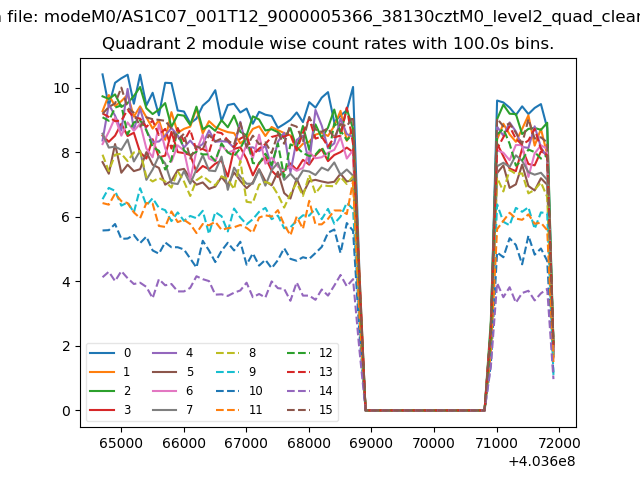
| Module-wise count rates for Quadrant B Data is divided into 100 sec bins |
 |
 |
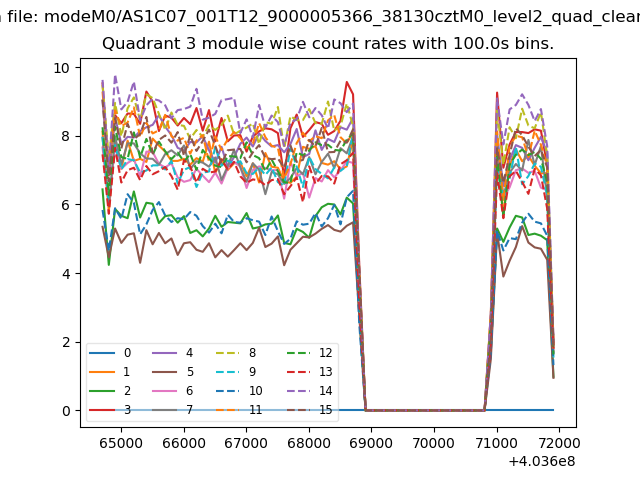
| Module-wise count rates for Quadrant C Data is divided into 100 sec bins |
 |
 |
| Module-wise count rates for Quadrant D Data is divided into 100 sec bins |
 |
 |
| Parameter | Plot |
|---|---|
| CZT HV Monitor | 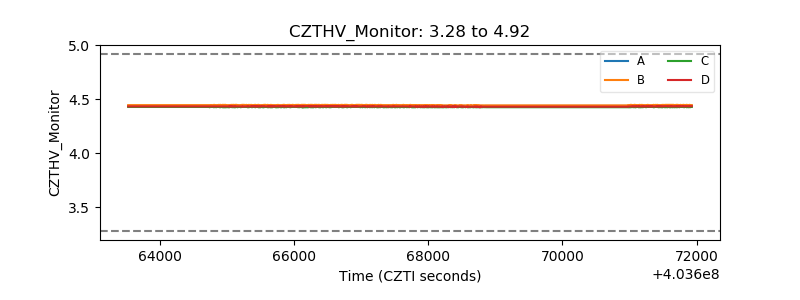 |
| D_VDD | 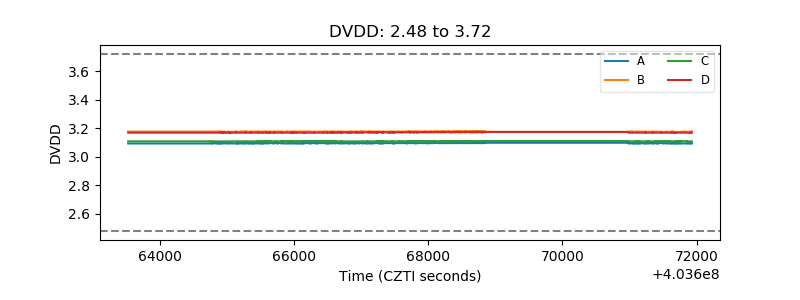 |
| Temperature 1 | 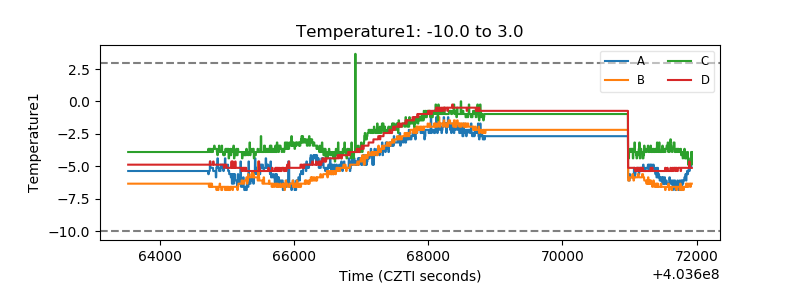 |
| Veto HV Monitor |  |
| Veto LLD | 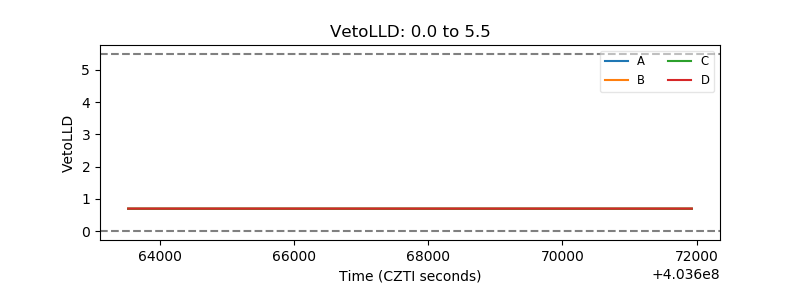 |
| Alpha Counter | 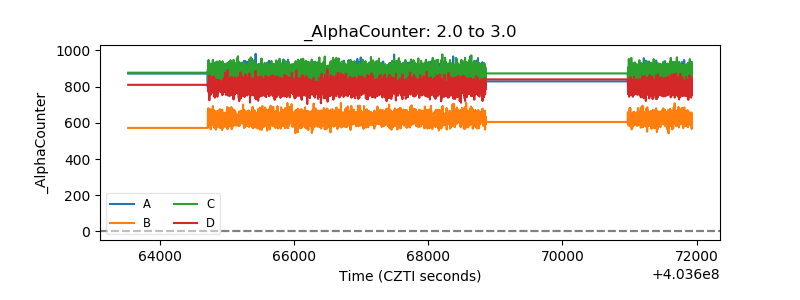 |
| _CPM_Rate | 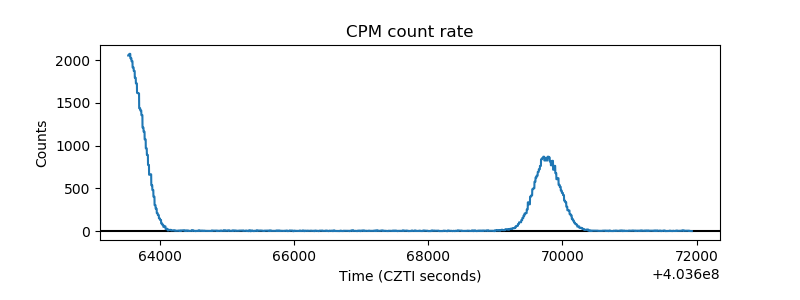 |
| CZT Counter | 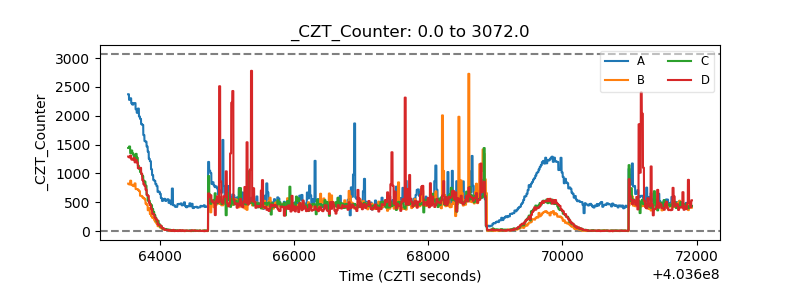 |
| +2.5 Volts monitor | 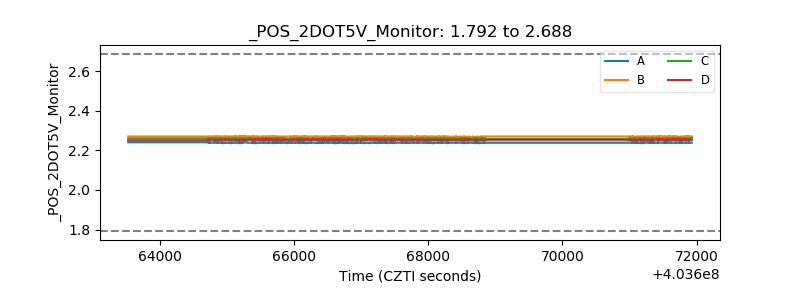 |
| +5 Volts monitor | 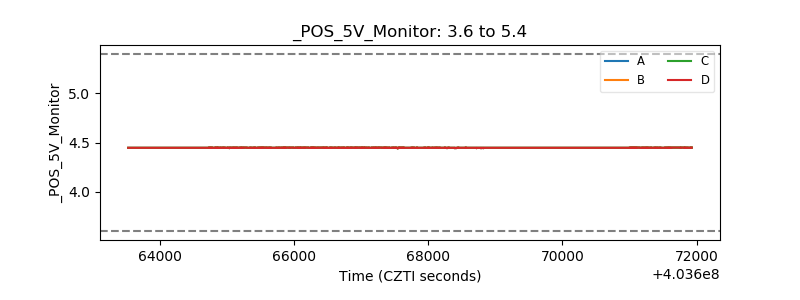 |
| _ROLL_ROT | 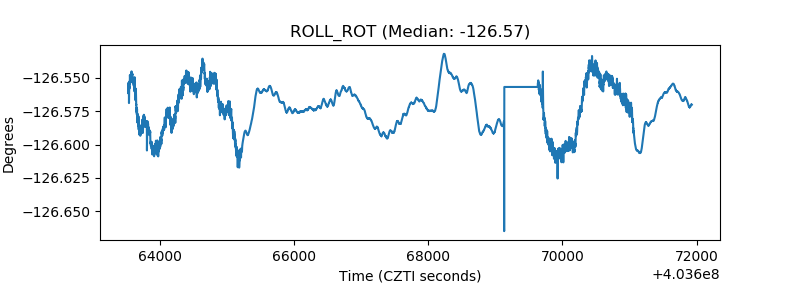 |
| _Roll_DEC | 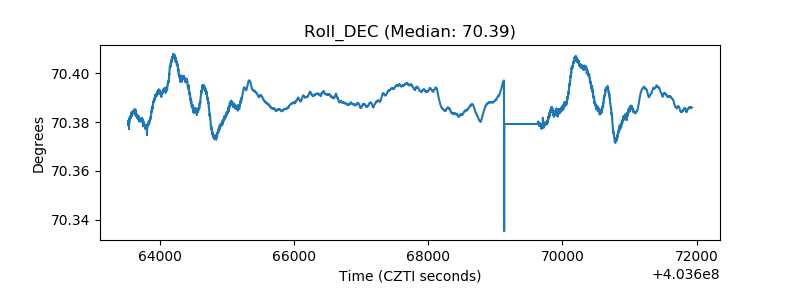 |
| _Roll_RA | 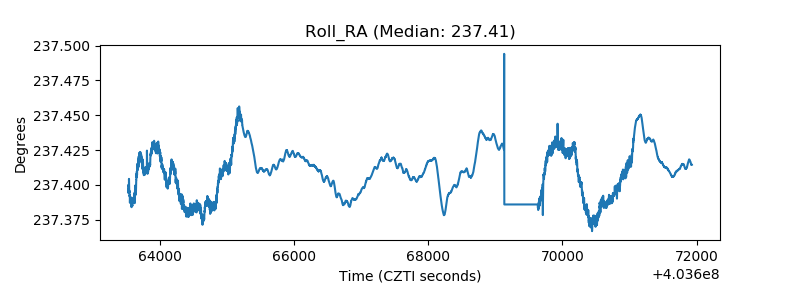 |
| Veto Counter | 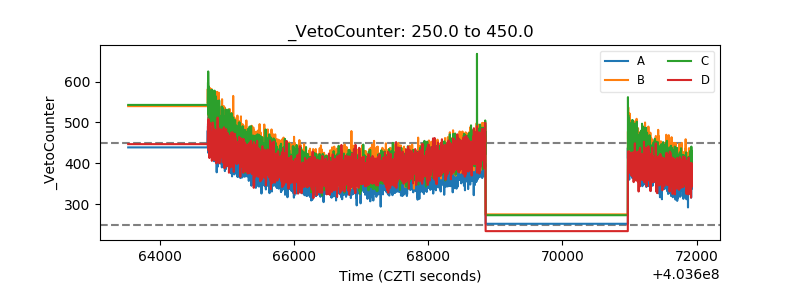 |