| Param | Original file | Final file |
|---|---|---|
| Filename | modeM0/AS1C07_001T12_9000005366_38131cztM0_level2.fits | modeM0/AS1C07_001T12_9000005366_38131cztM0_level2_quad_clean.evt |
| Size (bytes) | 296,239,680 | 86,895,360 |
| Size | 282.5 MB | 82.9 MB |
| Events in quadrant A | 2,833,684 | 588,816 |
| Events in quadrant B | 2,432,963 | 601,098 |
| Events in quadrant C | 2,429,316 | 571,071 |
| Events in quadrant D | 2,878,595 | 518,596 |
| Mode M0 | |||
|---|---|---|---|
| Quadrant | BADHDUFLAG | Total packets | Discarded packets |
| A | 0 | 11515 | 3 |
| B | 0 | 10778 | 2 |
| C | 0 | 10391 | 2 |
| D | 0 | 12106 | 2 |
| Mode M9 | |||
|---|---|---|---|
| Quadrant | BADHDUFLAG | Total packets | Discarded packets |
| A | 0 | 33 | 0 |
| B | 0 | 33 | 0 |
| C | 0 | 33 | 0 |
| D | 0 | 34 | 0 |
| Mode SS | |||
|---|---|---|---|
| Quadrant | BADHDUFLAG | Total packets | Discarded packets |
| A | 0 | 102 | 0 |
| B | 0 | 102 | 0 |
| C | 0 | 102 | 0 |
| D | 0 | 102 | 0 |
| Quadrant | Total seconds | Saturated seconds | Saturation percentage |
|---|---|---|---|
| A | 5018 | 16 | 0.318852% |
| B | 5018 | 50 | 0.996413% |
| C | 5018 | 19 | 0.378637% |
| D | 5018 | 103 | 2.052611% |
Noise dominated data is calculated using 1-second bins in cleaned event files. If a bin has >2000 counts, and if more than 50% of those come from <1% of pixels, then it is considered to be noise-dominated and hence unusable.
| Quadrant | # 1 sec bins | Bins with >0 counts | Bins with >2000 counts | High rate bins dominated by noise | Noise dominated (total time) | Noise dominated (detector-on time) | Marked lightcurve |
|---|---|---|---|---|---|---|---|
| A | 7051 | 5019 | 12 | 12 | 0.17% | 0.24% | 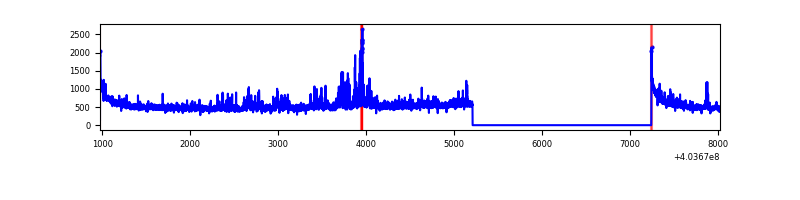 |
| B | 7051 | 5019 | 36 | 36 | 0.51% | 0.72% | 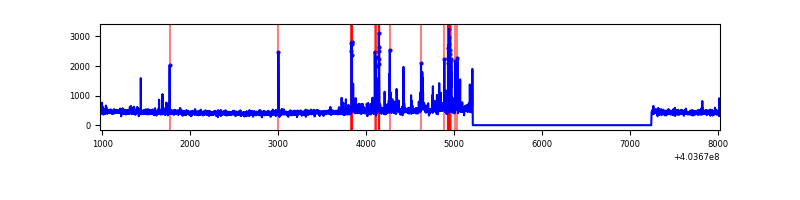 |
| C | 7051 | 5019 | 12 | 12 | 0.17% | 0.24% |  |
| D | 7051 | 5019 | 100 | 100 | 1.42% | 1.99% | 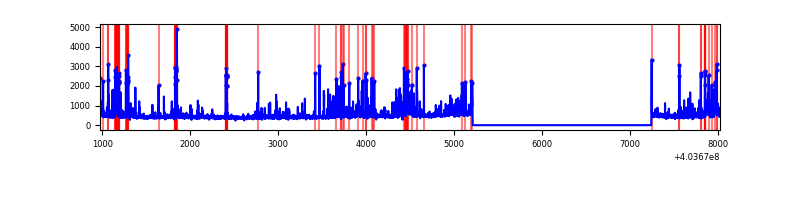 |
Top three noisy pixels from each quadrant. If the there are fewer than three noisy pixels in the level2.evt file, extra rows are filled as -1
| Pixel properties | Quadrant properties | ||||||
|---|---|---|---|---|---|---|---|
| Quadrant | DetID | PixID | Counts | Sigma | Mean | Median | Sigma |
| A | 10 | 83 | 356286 | 3157.3 | 556 | 545 | 112.7 |
| A | 12 | 16 | 251514 | 2227.42 | 556 | 545 | 112.7 |
| A | 12 | 194 | 40201 | 351.96 | 556 | 545 | 112.7 |
| B | 0 | 229 | 156163 | 1467.62 | 552 | 537 | 106.0 |
| B | 5 | 172 | 48771 | 454.87 | 552 | 537 | 106.0 |
| B | 15 | 85 | 28867 | 267.16 | 552 | 537 | 106.0 |
| C | 15 | 214 | 211706 | 1680.91 | 536 | 539 | 125.6 |
| C | 14 | 254 | 67668 | 534.35 | 536 | 539 | 125.6 |
| C | 0 | 10 | 23599 | 183.56 | 536 | 539 | 125.6 |
| D | 13 | 249 | 277717 | 2123.88 | 531 | 516 | 130.5 |
| D | 1 | 52 | 265709 | 2031.87 | 531 | 516 | 130.5 |
| D | 13 | 138 | 70297 | 534.65 | 531 | 516 | 130.5 |
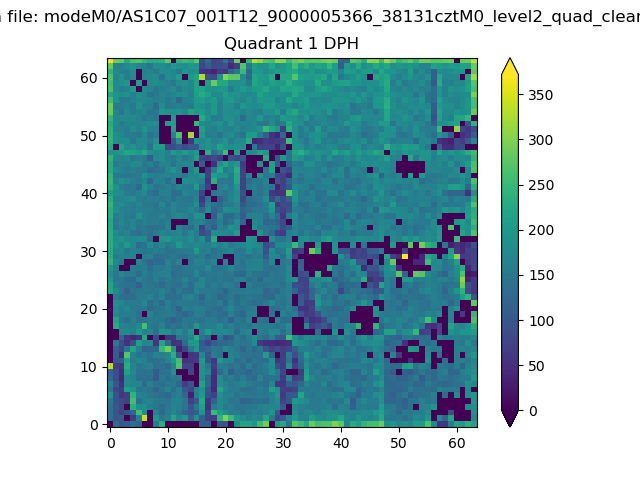
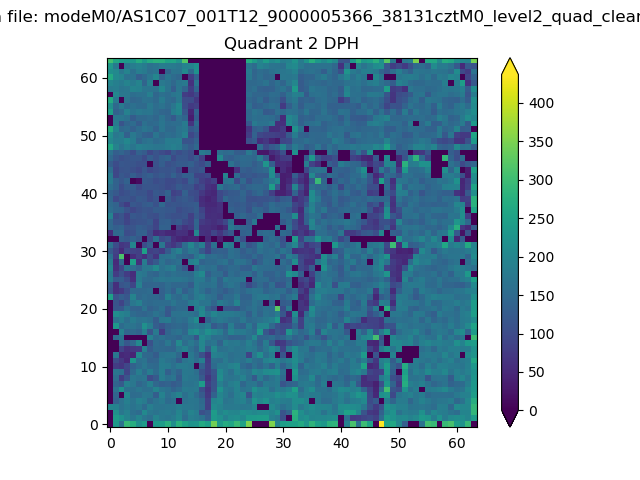
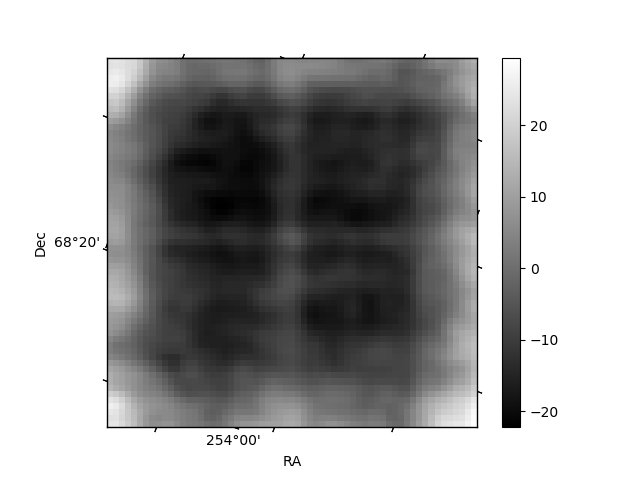
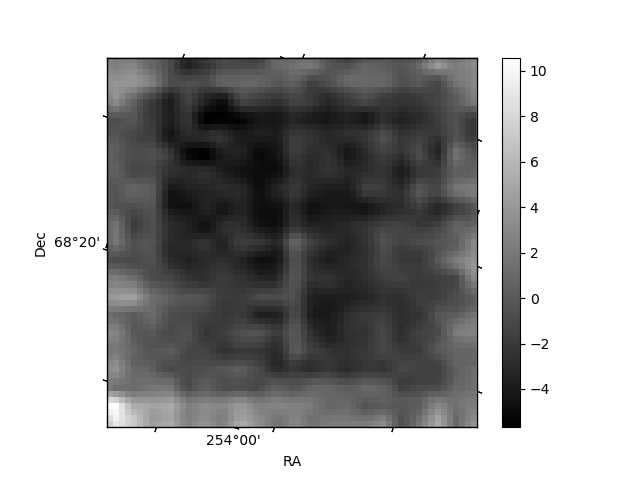
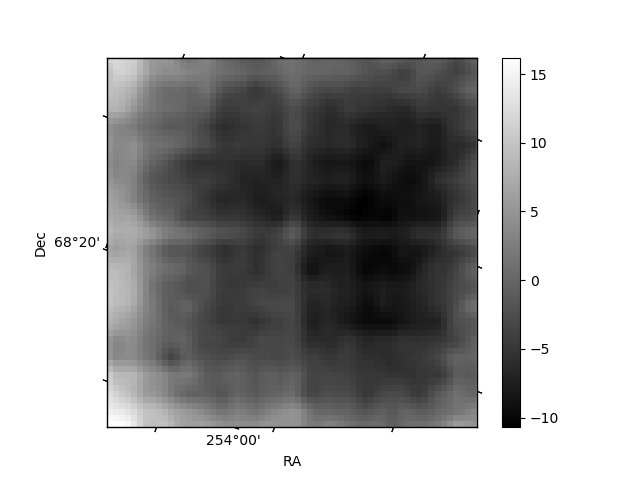
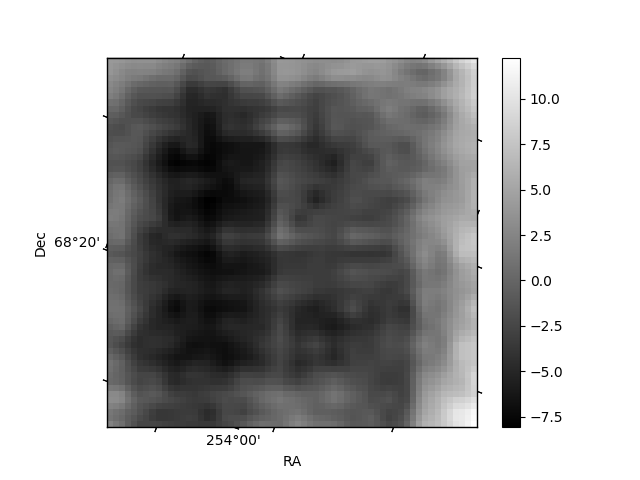
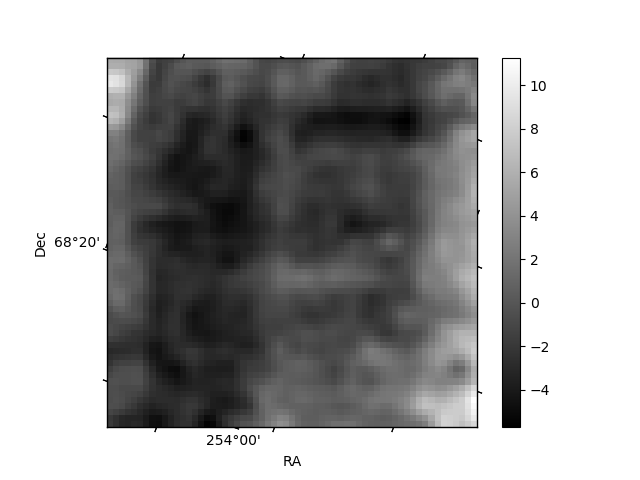
Histogram calculated using DETX and DETY for each event in the final _common_clean file
| Quadrant A | 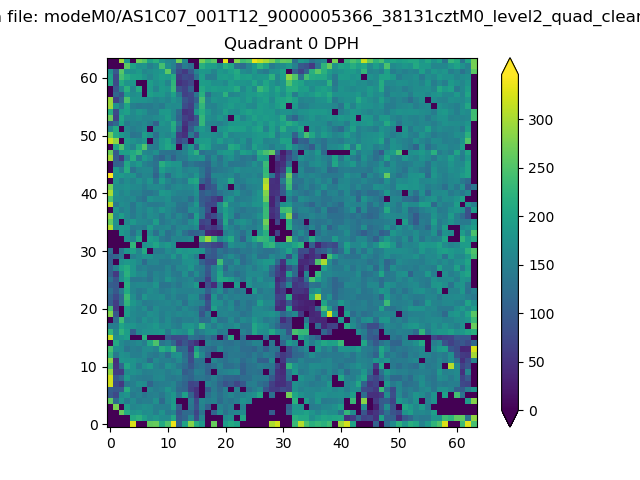 |
 |
Quadrant B |
|---|---|---|---|
| Quadrant D | 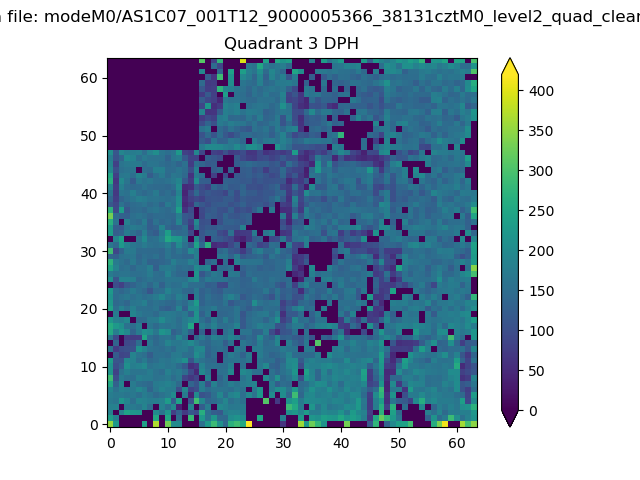 |
 |
Quadrant C |
| Plot type | Count rate plots | Images |
|---|---|---|
| Comparison with Poisson distribution Blue bars denote a histogram of data divided into 1 sec bins. Red curve is a Poisson curve with rate = median count rate of data. |
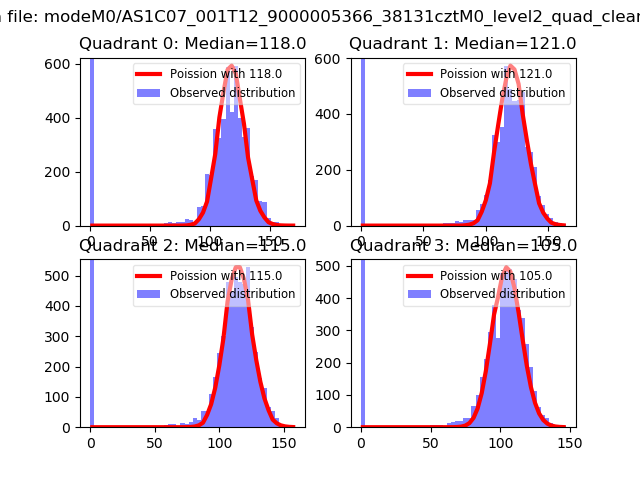 |
 |
| Quadrant-wise count rates Data is divided into 100 sec bins |
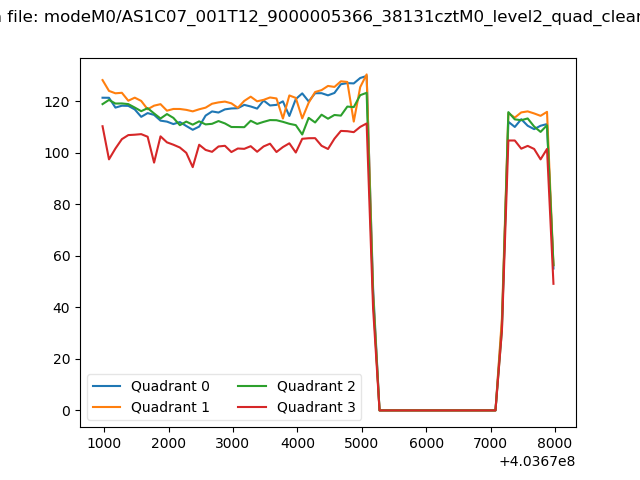 |
|
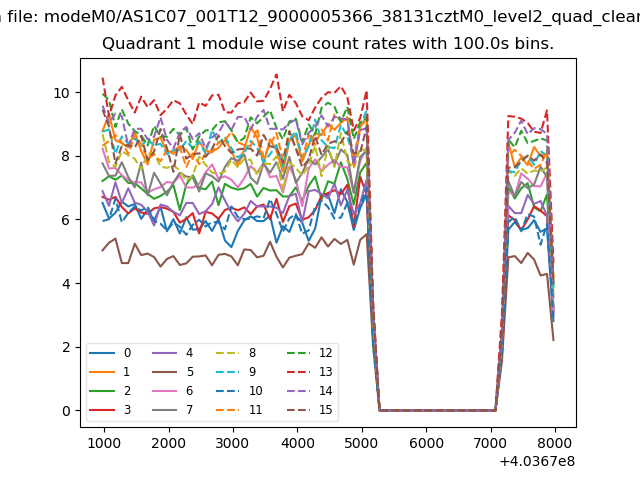
| Module-wise count rates for Quadrant A Data is divided into 100 sec bins |
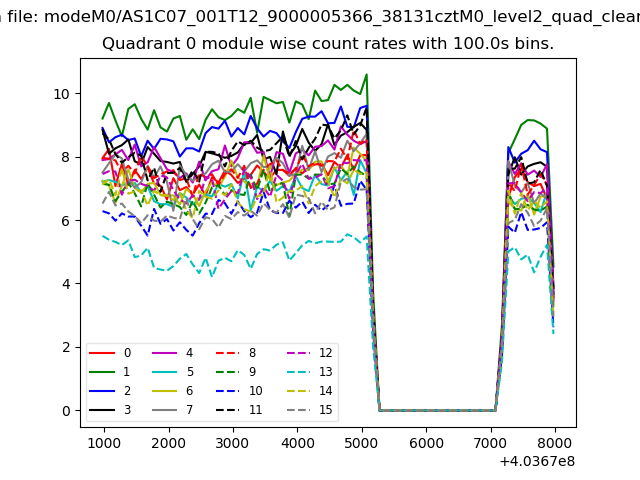 |
 |
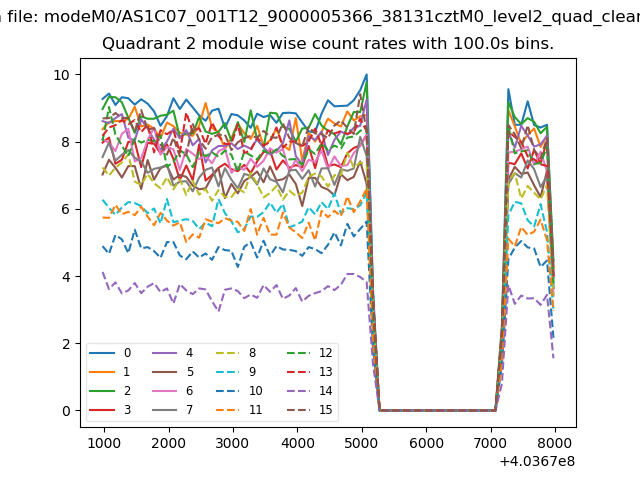
| Module-wise count rates for Quadrant B Data is divided into 100 sec bins |
 |
 |
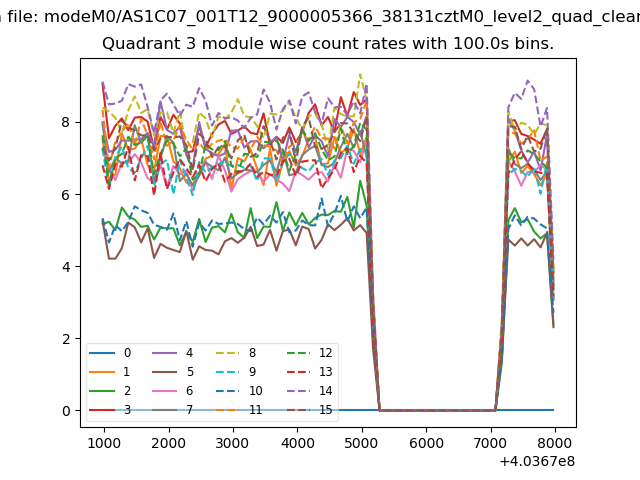
| Module-wise count rates for Quadrant C Data is divided into 100 sec bins |
 |
 |
| Module-wise count rates for Quadrant D Data is divided into 100 sec bins |
 |
 |
| Parameter | Plot |
|---|---|
| CZT HV Monitor | 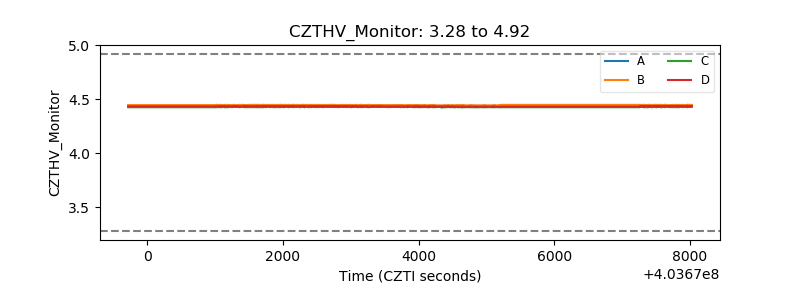 |
| D_VDD | 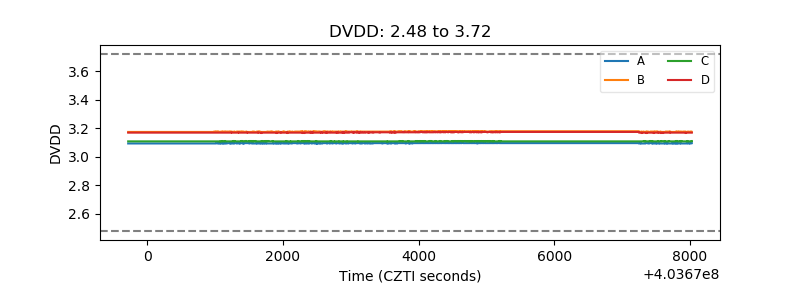 |
| Temperature 1 | 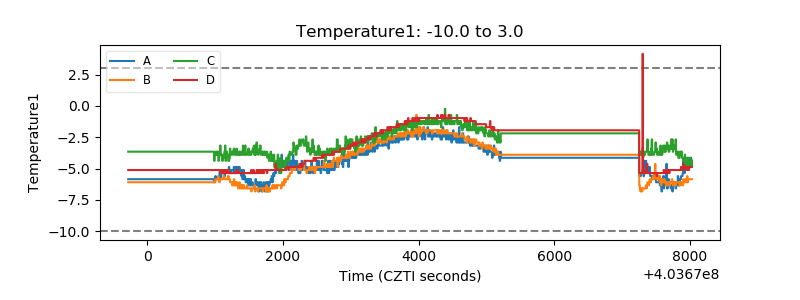 |
| Veto HV Monitor | 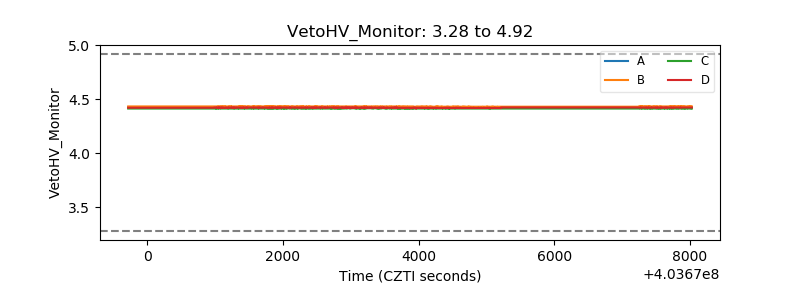 |
| Veto LLD | 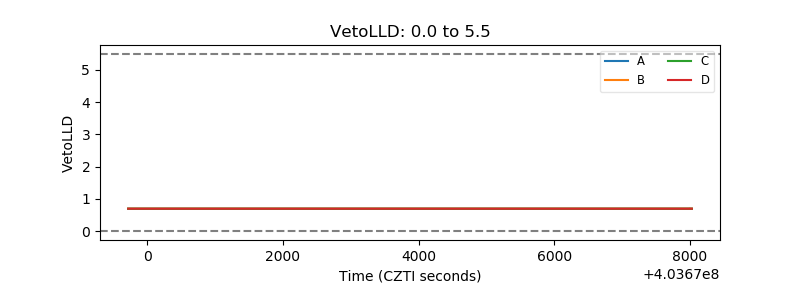 |
| Alpha Counter | 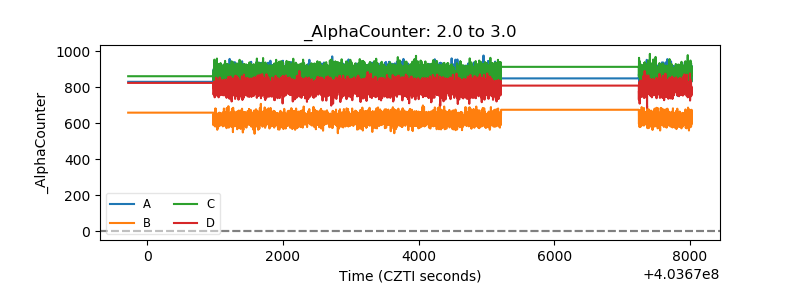 |
| _CPM_Rate | 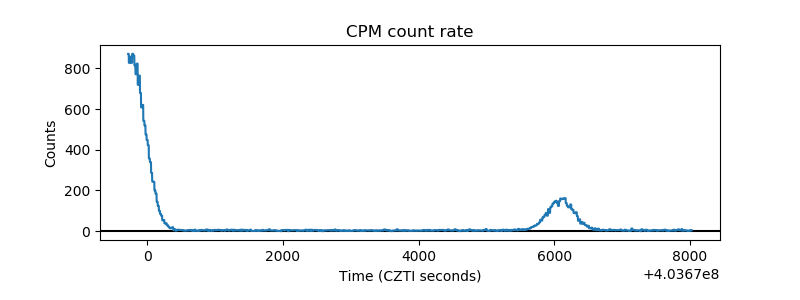 |
| CZT Counter | 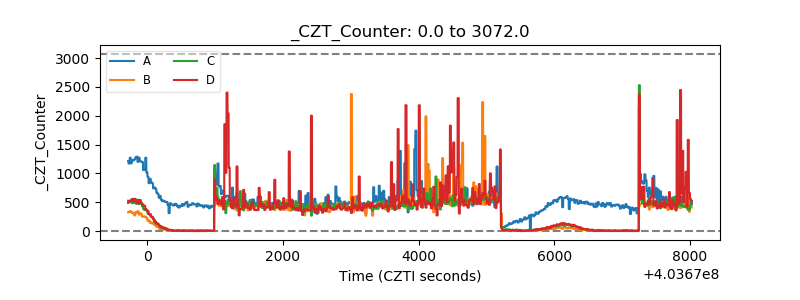 |
| +2.5 Volts monitor | 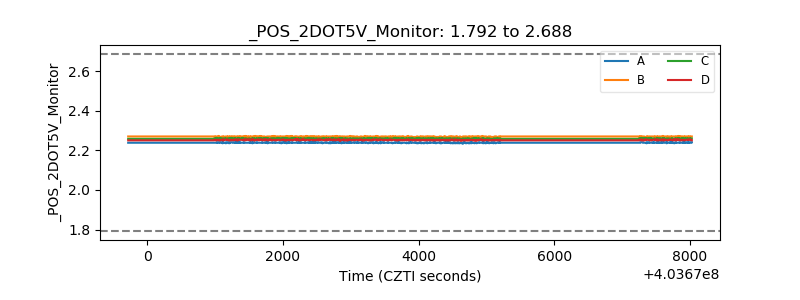 |
| +5 Volts monitor | 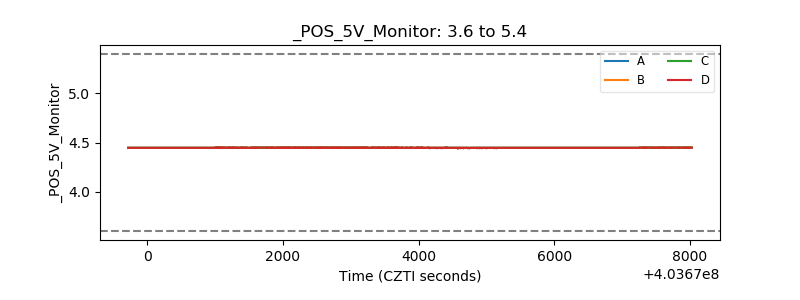 |
| _ROLL_ROT | 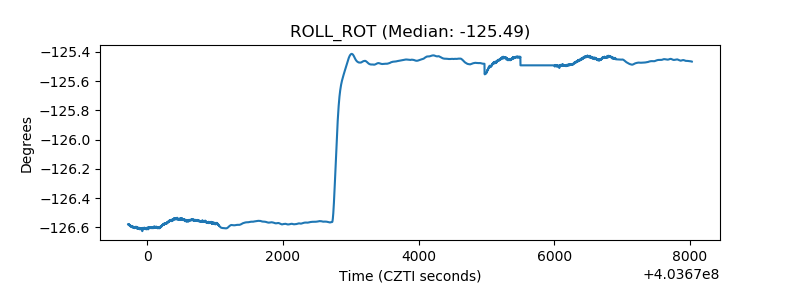 |
| _Roll_DEC | 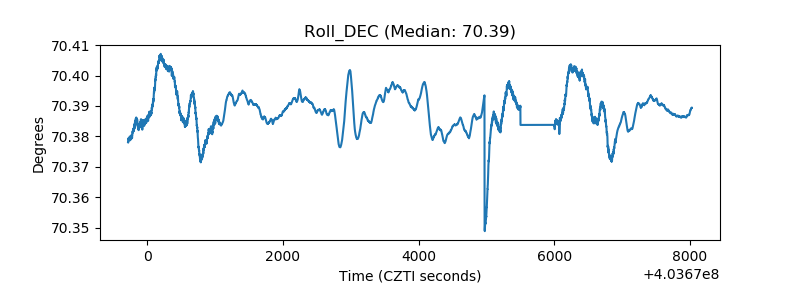 |
| _Roll_RA | 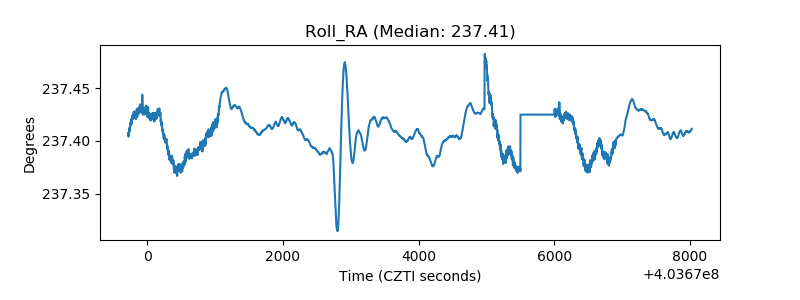 |
| Veto Counter | 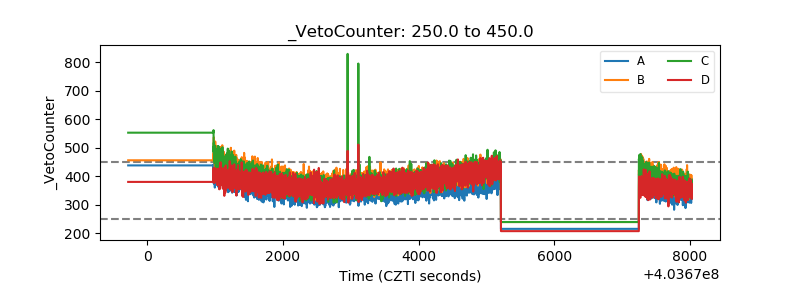 |