| Param | Original file | Final file |
|---|---|---|
| Filename | modeM0/AS1C07_001T12_9000005366_38132cztM0_level2.fits | modeM0/AS1C07_001T12_9000005366_38132cztM0_level2_quad_clean.evt |
| Size (bytes) | 313,940,160 | 88,992,000 |
| Size | 299.4 MB | 84.9 MB |
| Events in quadrant A | 3,131,798 | 601,613 |
| Events in quadrant B | 2,489,326 | 609,952 |
| Events in quadrant C | 2,592,744 | 582,339 |
| Events in quadrant D | 2,997,080 | 531,943 |
| Mode M0 | |||
|---|---|---|---|
| Quadrant | BADHDUFLAG | Total packets | Discarded packets |
| A | 0 | 12624 | 3 |
| B | 0 | 11137 | 2 |
| C | 0 | 11062 | 2 |
| D | 0 | 12531 | 2 |
| Mode M9 | |||
|---|---|---|---|
| Quadrant | BADHDUFLAG | Total packets | Discarded packets |
| A | 0 | 29 | 0 |
| B | 0 | 29 | 0 |
| C | 0 | 29 | 0 |
| D | 0 | 30 | 0 |
| Mode SS | |||
|---|---|---|---|
| Quadrant | BADHDUFLAG | Total packets | Discarded packets |
| A | 0 | 108 | 0 |
| B | 0 | 108 | 0 |
| C | 0 | 108 | 0 |
| D | 0 | 108 | 0 |
| Quadrant | Total seconds | Saturated seconds | Saturation percentage |
|---|---|---|---|
| A | 5263 | 24 | 0.456014% |
| B | 5263 | 62 | 1.178035% |
| C | 5263 | 9 | 0.171005% |
| D | 5263 | 61 | 1.159035% |
Noise dominated data is calculated using 1-second bins in cleaned event files. If a bin has >2000 counts, and if more than 50% of those come from <1% of pixels, then it is considered to be noise-dominated and hence unusable.
| Quadrant | # 1 sec bins | Bins with >0 counts | Bins with >2000 counts | High rate bins dominated by noise | Noise dominated (total time) | Noise dominated (detector-on time) | Marked lightcurve |
|---|---|---|---|---|---|---|---|
| A | 7026 | 5264 | 16 | 16 | 0.23% | 0.30% | 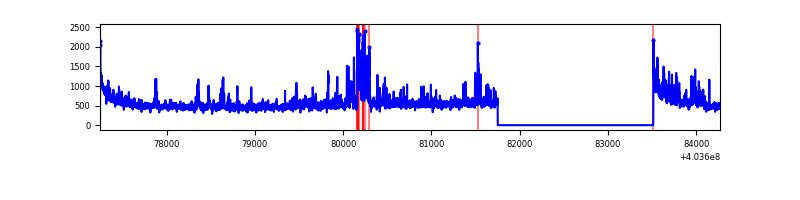 |
| B | 7026 | 5264 | 43 | 43 | 0.61% | 0.82% | 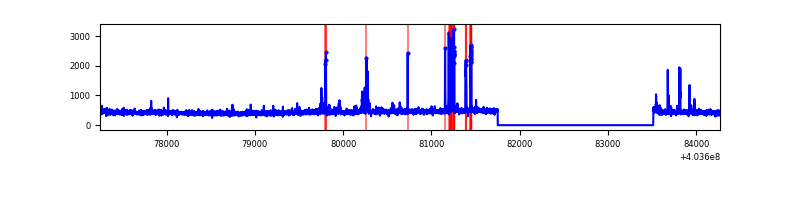 |
| C | 7026 | 5264 | 5 | 5 | 0.07% | 0.09% | 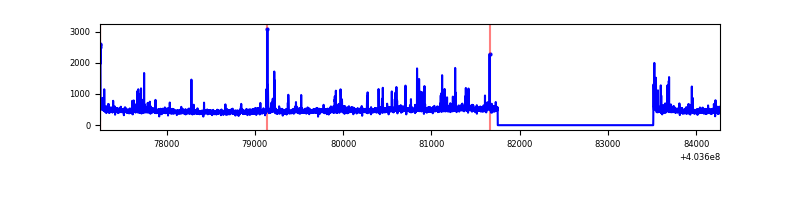 |
| D | 7026 | 5264 | 56 | 56 | 0.80% | 1.06% | 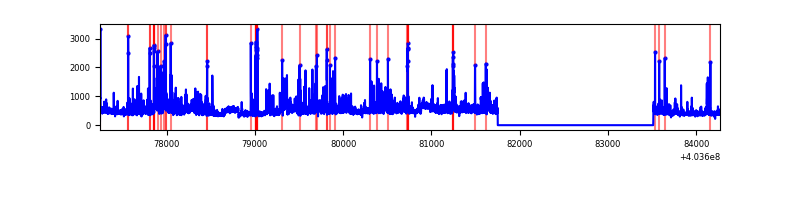 |
Top three noisy pixels from each quadrant. If the there are fewer than three noisy pixels in the level2.evt file, extra rows are filled as -1
| Pixel properties | Quadrant properties | ||||||
|---|---|---|---|---|---|---|---|
| Quadrant | DetID | PixID | Counts | Sigma | Mean | Median | Sigma |
| A | 12 | 16 | 414136 | 3569.57 | 577 | 566 | 115.9 |
| A | 10 | 83 | 371939 | 3205.37 | 577 | 566 | 115.9 |
| A | 12 | 194 | 63943 | 547.01 | 577 | 566 | 115.9 |
| B | 5 | 172 | 151223 | 1375.67 | 571 | 556 | 109.5 |
| B | 0 | 229 | 44216 | 398.64 | 571 | 556 | 109.5 |
| B | 4 | 171 | 20183 | 179.21 | 571 | 556 | 109.5 |
| C | 15 | 214 | 221926 | 1700.15 | 558 | 561 | 130.2 |
| C | 14 | 254 | 95987 | 732.9 | 558 | 561 | 130.2 |
| C | 0 | 239 | 52794 | 401.17 | 558 | 561 | 130.2 |
| D | 1 | 52 | 303994 | 2219.73 | 557 | 541 | 136.7 |
| D | 13 | 249 | 124819 | 909.08 | 557 | 541 | 136.7 |
| D | 2 | 250 | 80876 | 587.64 | 557 | 541 | 136.7 |
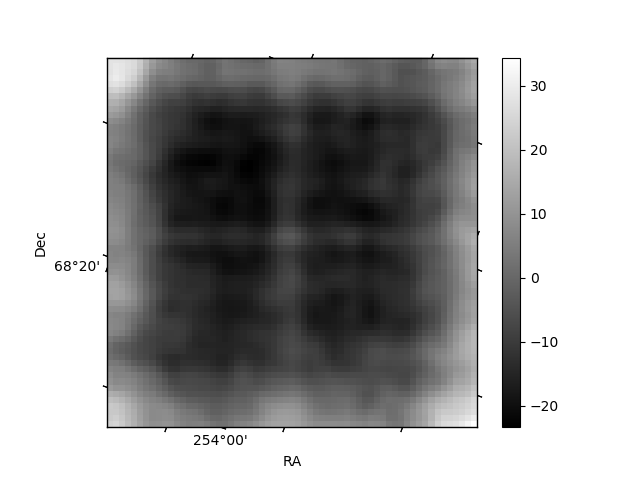
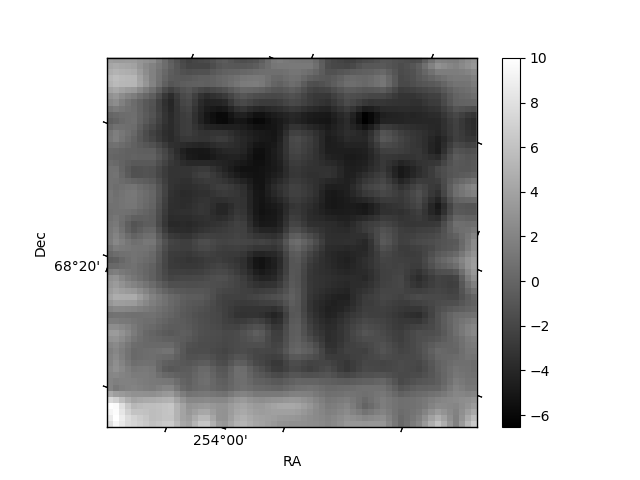
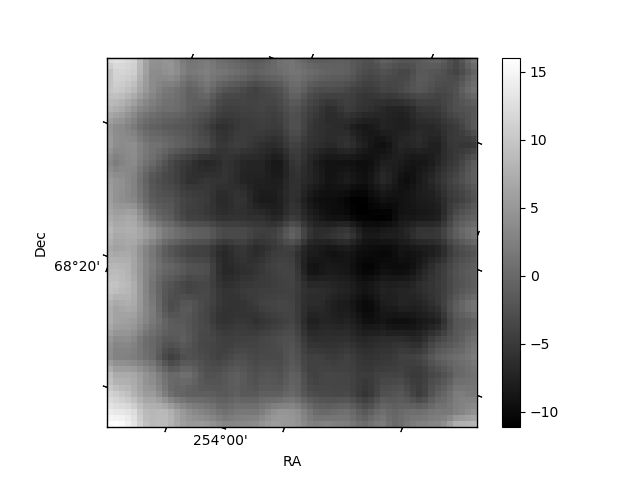
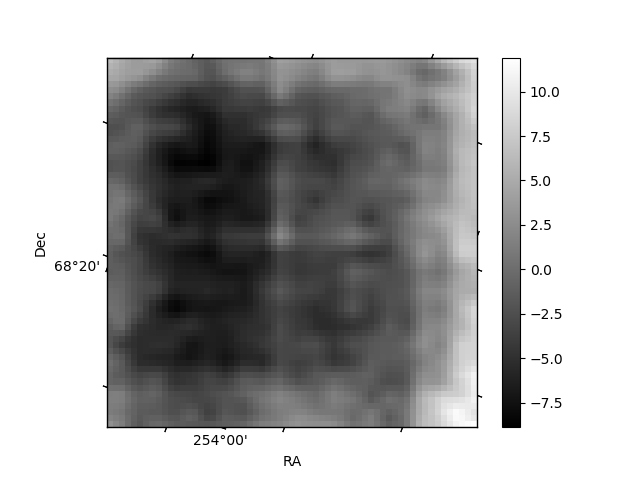
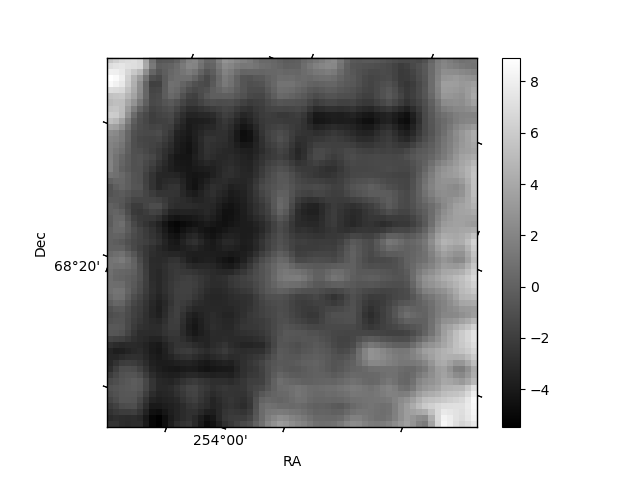
Histogram calculated using DETX and DETY for each event in the final _common_clean file
| Quadrant A | 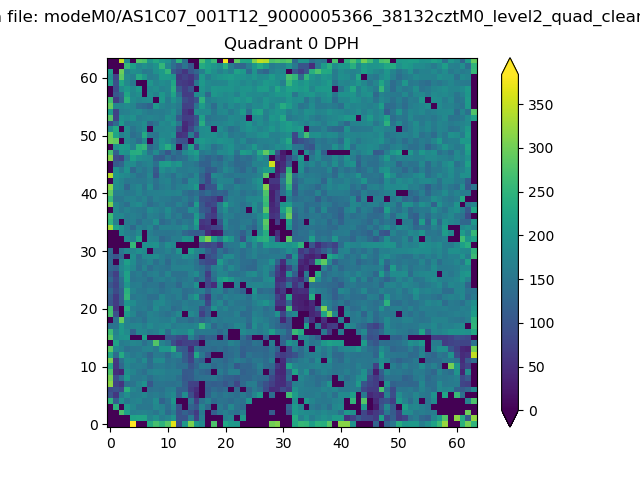 |
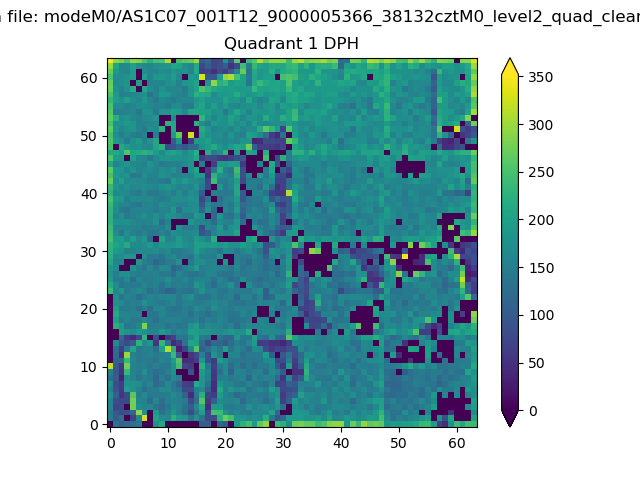 |
Quadrant B |
|---|---|---|---|
| Quadrant D | 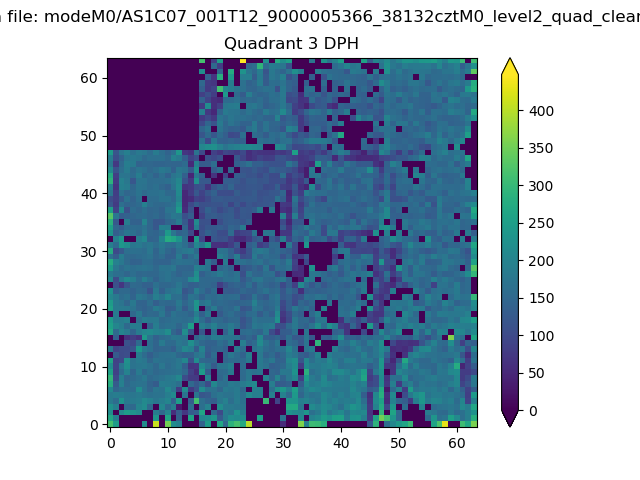 |
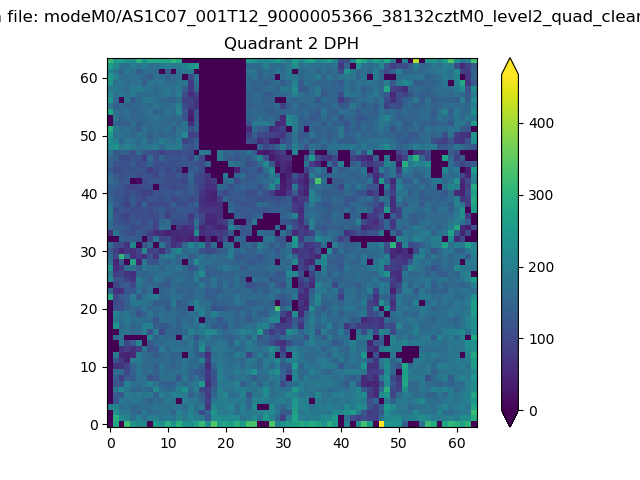 |
Quadrant C |
| Plot type | Count rate plots | Images |
|---|---|---|
| Comparison with Poisson distribution Blue bars denote a histogram of data divided into 1 sec bins. Red curve is a Poisson curve with rate = median count rate of data. |
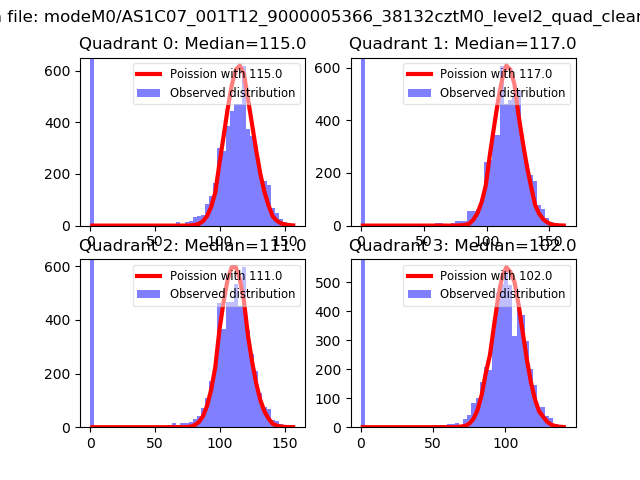 |
 |
| Quadrant-wise count rates Data is divided into 100 sec bins |
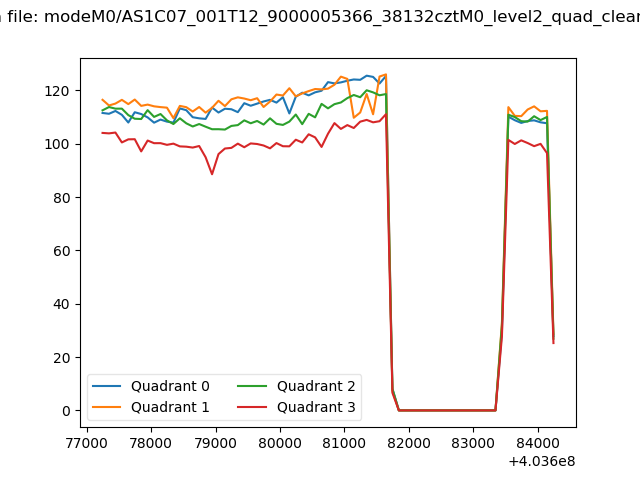 |
|
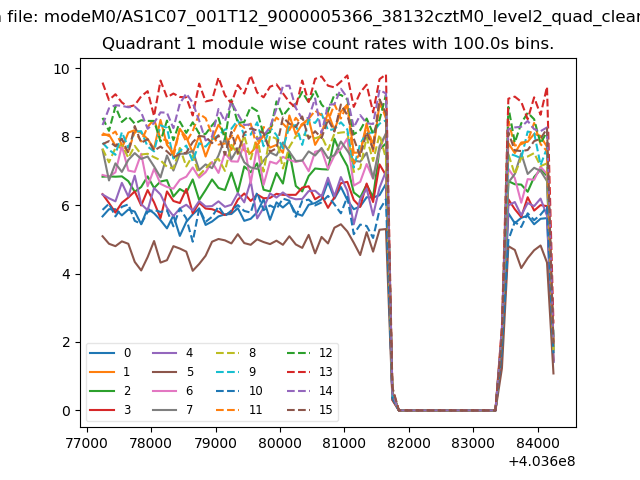
| Module-wise count rates for Quadrant A Data is divided into 100 sec bins |
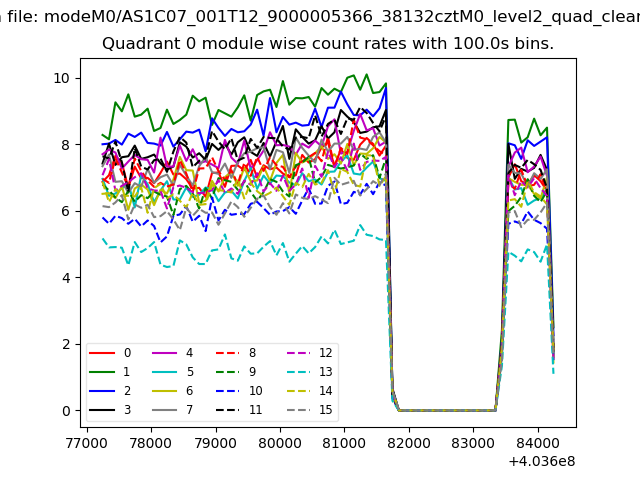 |
 |
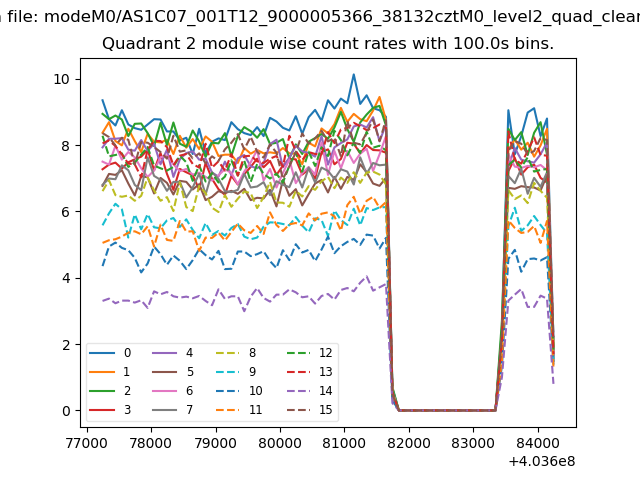
| Module-wise count rates for Quadrant B Data is divided into 100 sec bins |
 |
 |
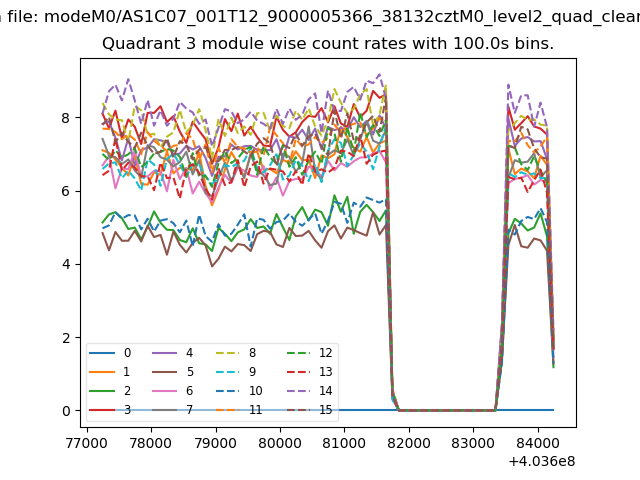
| Module-wise count rates for Quadrant C Data is divided into 100 sec bins |
 |
 |
| Module-wise count rates for Quadrant D Data is divided into 100 sec bins |
 |
 |
| Parameter | Plot |
|---|---|
| CZT HV Monitor | 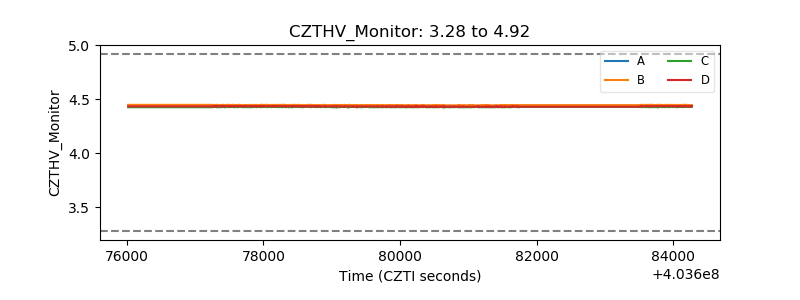 |
| D_VDD | 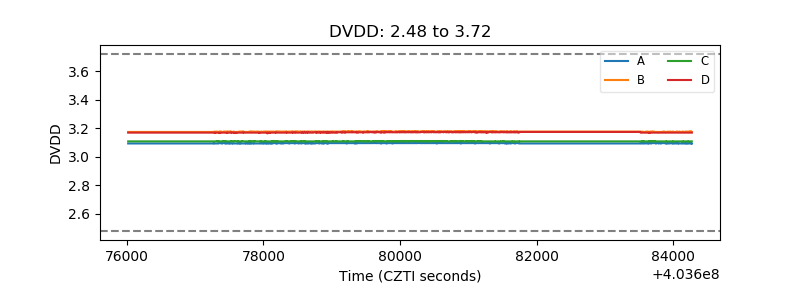 |
| Temperature 1 | 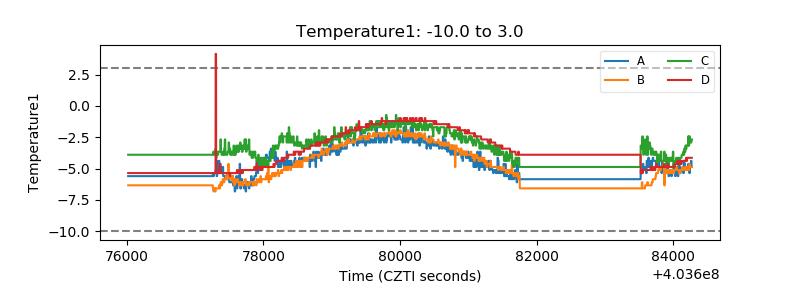 |
| Veto HV Monitor | 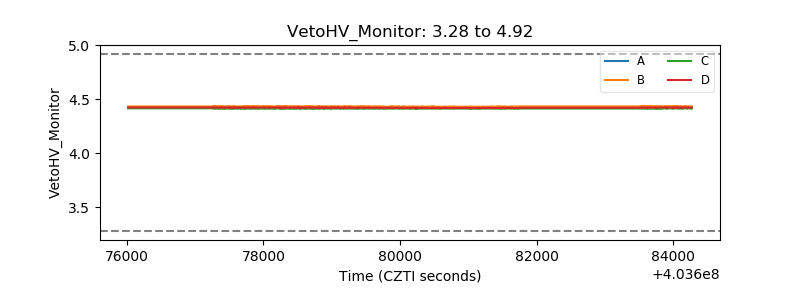 |
| Veto LLD | 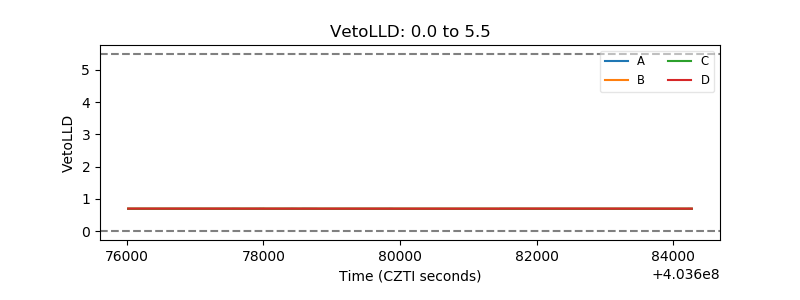 |
| Alpha Counter | 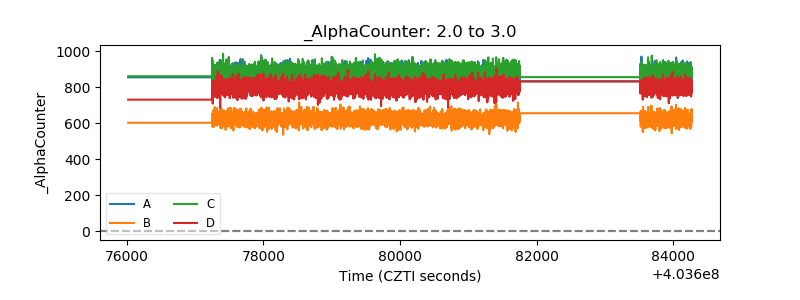 |
| _CPM_Rate | 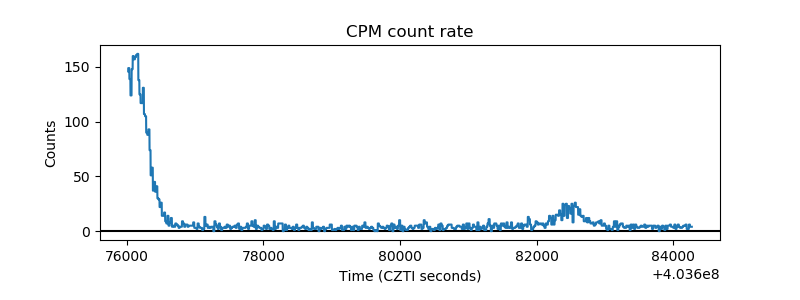 |
| CZT Counter | 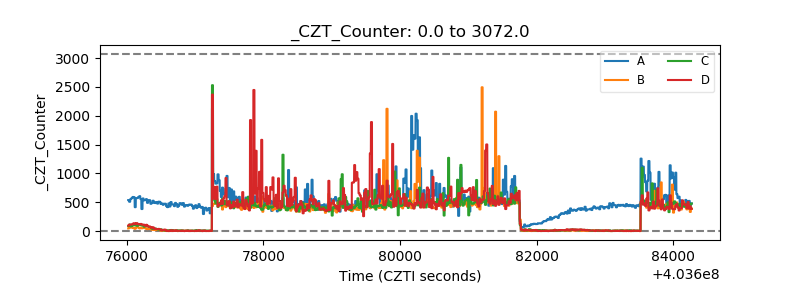 |
| +2.5 Volts monitor | 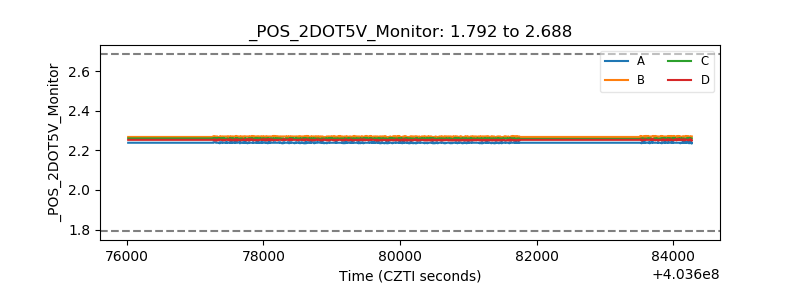 |
| +5 Volts monitor | 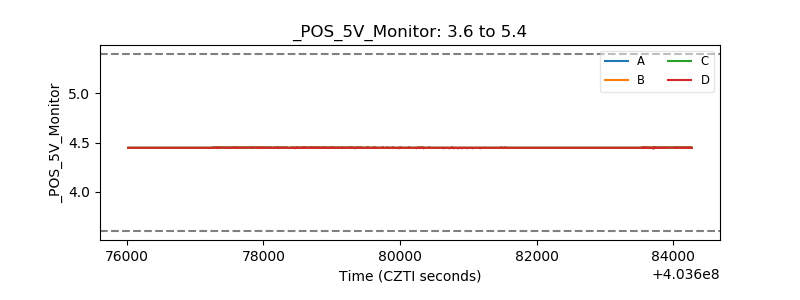 |
| _ROLL_ROT | 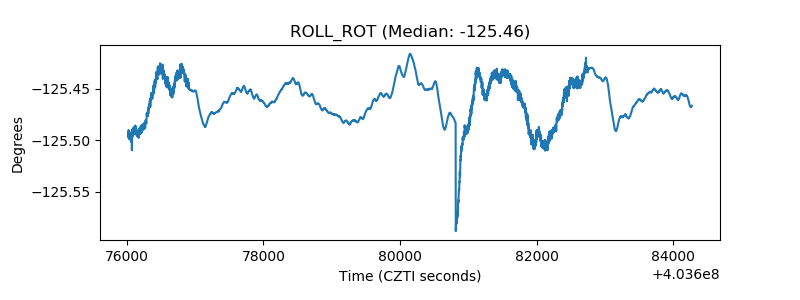 |
| _Roll_DEC | 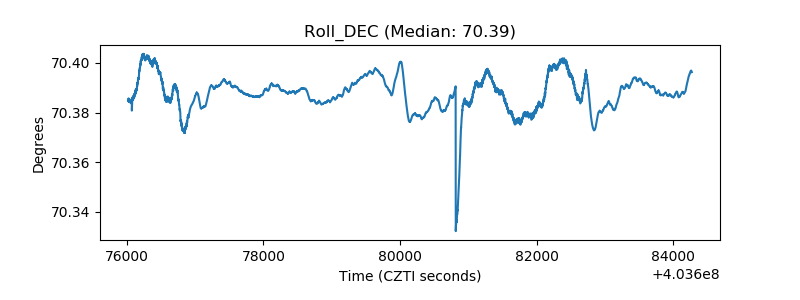 |
| _Roll_RA | 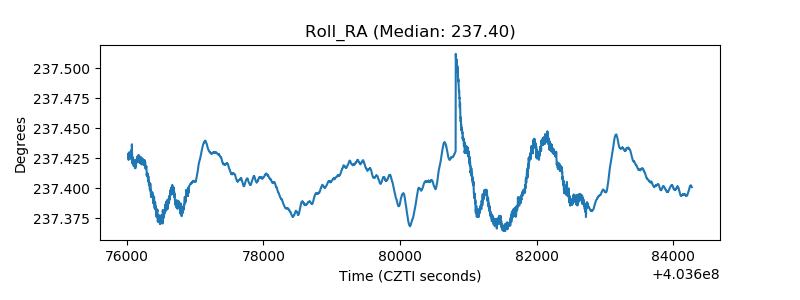 |
| Veto Counter | 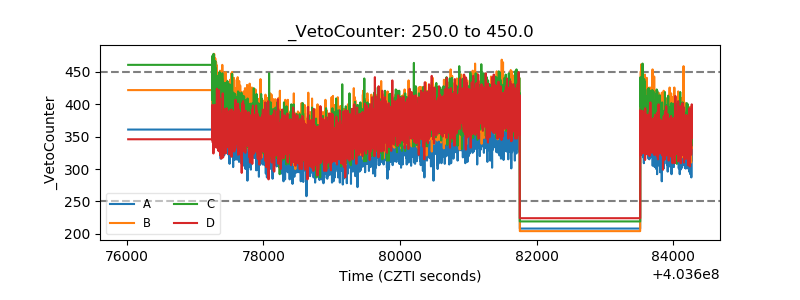 |