| Param | Original file | Final file |
|---|---|---|
| Filename | modeM0/AS1C07_001T12_9000005366_38133cztM0_level2.fits | modeM0/AS1C07_001T12_9000005366_38133cztM0_level2_quad_clean.evt |
| Size (bytes) | 340,200,000 | 94,711,680 |
| Size | 324.4 MB | 90.3 MB |
| Events in quadrant A | 3,244,641 | 644,464 |
| Events in quadrant B | 2,588,614 | 655,014 |
| Events in quadrant C | 3,105,684 | 606,143 |
| Events in quadrant D | 3,213,311 | 565,633 |
| Mode M0 | |||
|---|---|---|---|
| Quadrant | BADHDUFLAG | Total packets | Discarded packets |
| A | 0 | 13155 | 3 |
| B | 0 | 11626 | 2 |
| C | 0 | 12785 | 2 |
| D | 0 | 13532 | 2 |
| Mode M9 | |||
|---|---|---|---|
| Quadrant | BADHDUFLAG | Total packets | Discarded packets |
| A | 0 | 22 | 0 |
| B | 0 | 22 | 0 |
| C | 0 | 22 | 0 |
| D | 0 | 23 | 0 |
| Mode SS | |||
|---|---|---|---|
| Quadrant | BADHDUFLAG | Total packets | Discarded packets |
| A | 0 | 118 | 0 |
| B | 0 | 118 | 0 |
| C | 0 | 118 | 0 |
| D | 0 | 118 | 0 |
| Quadrant | Total seconds | Saturated seconds | Saturation percentage |
|---|---|---|---|
| A | 5660 | 12 | 0.212014% |
| B | 5660 | 18 | 0.318021% |
| C | 5660 | 140 | 2.473498% |
| D | 5660 | 78 | 1.378092% |
Noise dominated data is calculated using 1-second bins in cleaned event files. If a bin has >2000 counts, and if more than 50% of those come from <1% of pixels, then it is considered to be noise-dominated and hence unusable.
| Quadrant | # 1 sec bins | Bins with >0 counts | Bins with >2000 counts | High rate bins dominated by noise | Noise dominated (total time) | Noise dominated (detector-on time) | Marked lightcurve |
|---|---|---|---|---|---|---|---|
| A | 7123 | 5661 | 2 | 2 | 0.03% | 0.04% | 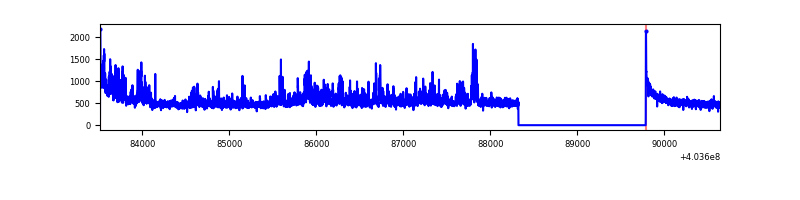 |
| B | 7123 | 5661 | 5 | 5 | 0.07% | 0.09% | 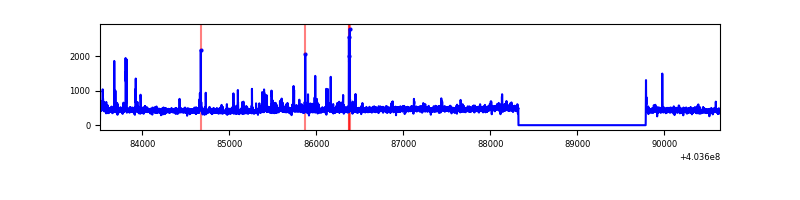 |
| C | 7123 | 5661 | 132 | 132 | 1.85% | 2.33% | 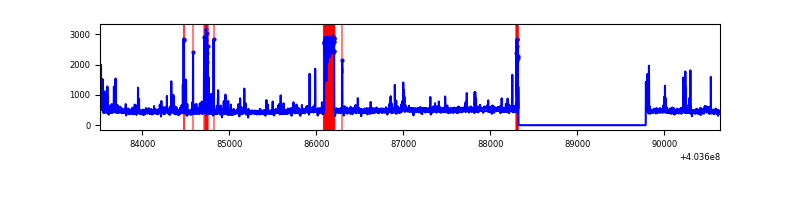 |
| D | 7123 | 5661 | 68 | 68 | 0.95% | 1.20% | 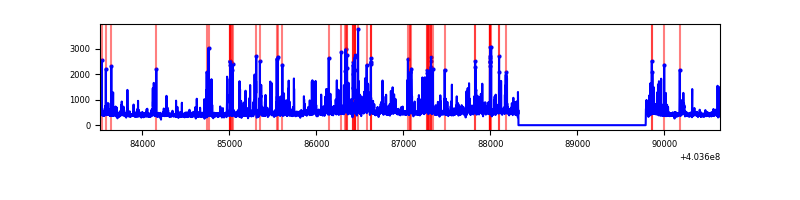 |
Top three noisy pixels from each quadrant. If the there are fewer than three noisy pixels in the level2.evt file, extra rows are filled as -1
| Pixel properties | Quadrant properties | ||||||
|---|---|---|---|---|---|---|---|
| Quadrant | DetID | PixID | Counts | Sigma | Mean | Median | Sigma |
| A | 10 | 83 | 388489 | 3081.44 | 623 | 610 | 125.9 |
| A | 12 | 16 | 353570 | 2804.03 | 623 | 610 | 125.9 |
| A | 12 | 194 | 57962 | 455.62 | 623 | 610 | 125.9 |
| B | 0 | 229 | 45586 | 378.48 | 617 | 600 | 118.9 |
| B | 5 | 172 | 45167 | 374.95 | 617 | 600 | 118.9 |
| B | 4 | 171 | 33798 | 279.3 | 617 | 600 | 118.9 |
| C | 0 | 239 | 399091 | 2894.1 | 593 | 595 | 137.7 |
| C | 15 | 214 | 238130 | 1725.11 | 593 | 595 | 137.7 |
| C | 14 | 254 | 71980 | 518.44 | 593 | 595 | 137.7 |
| D | 1 | 52 | 270840 | 1861.26 | 600 | 582 | 145.2 |
| D | 12 | 227 | 165121 | 1133.17 | 600 | 582 | 145.2 |
| D | 13 | 249 | 132609 | 909.27 | 600 | 582 | 145.2 |
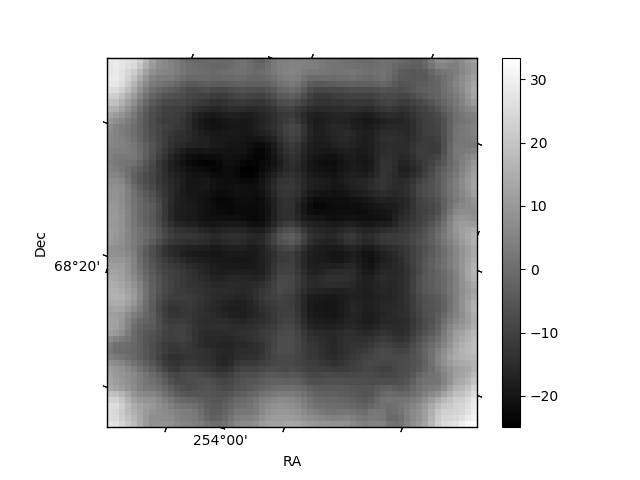
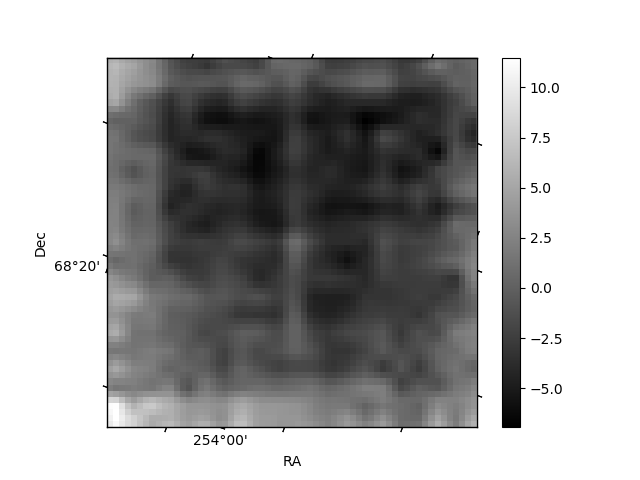
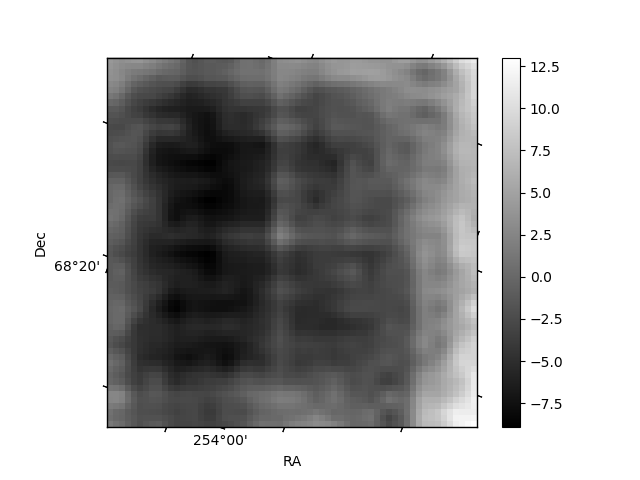
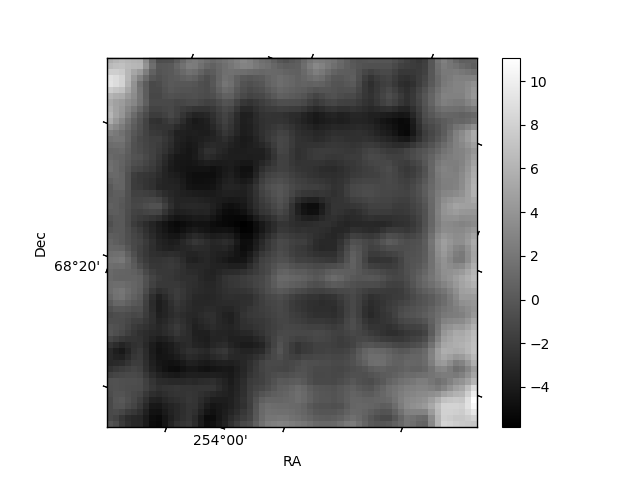
Histogram calculated using DETX and DETY for each event in the final _common_clean file
| Quadrant A | 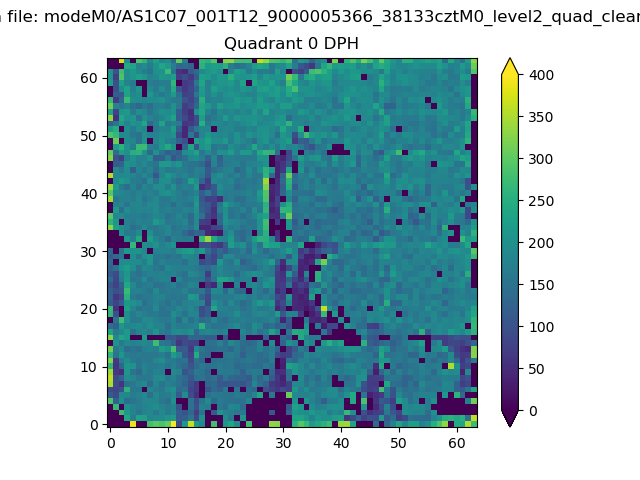 |
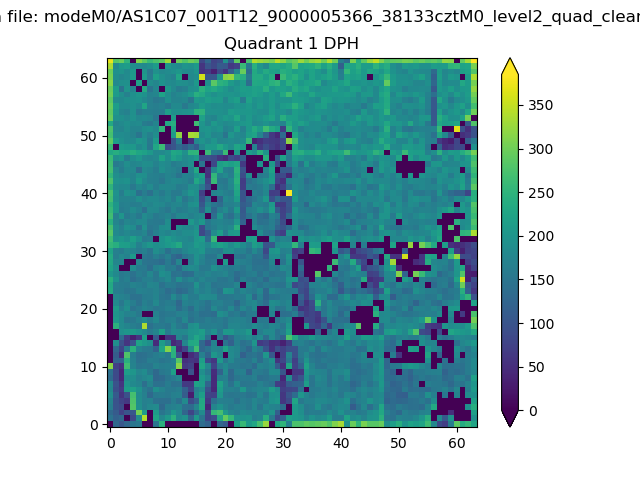 |
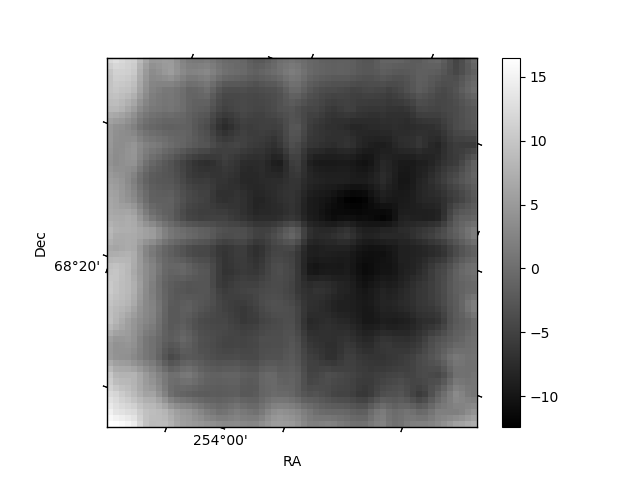
Quadrant B |
|---|---|---|---|
| Quadrant D | 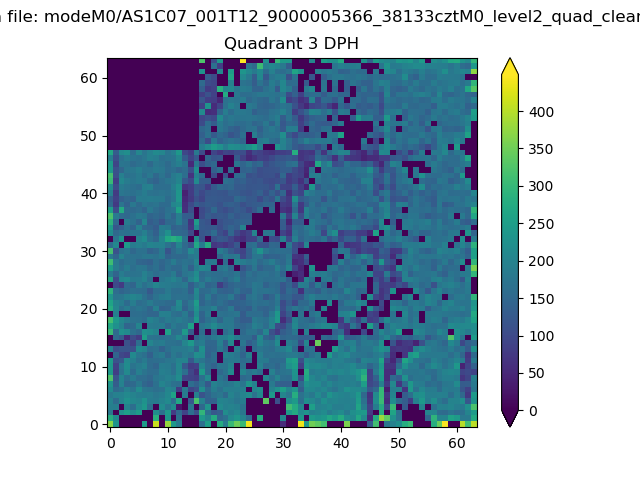 |
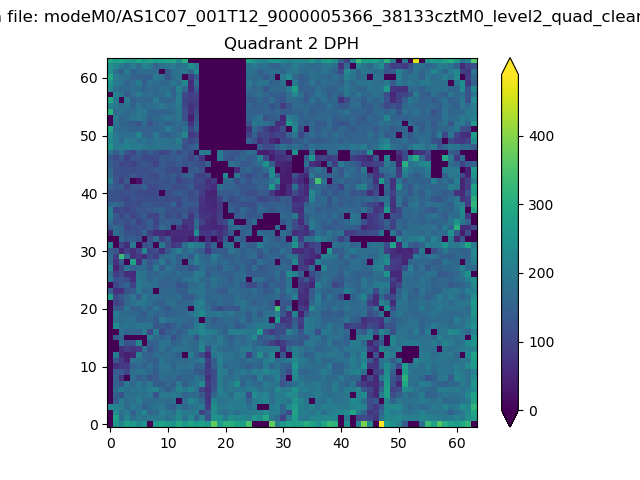 |
Quadrant C |
| Plot type | Count rate plots | Images |
|---|---|---|
| Comparison with Poisson distribution Blue bars denote a histogram of data divided into 1 sec bins. Red curve is a Poisson curve with rate = median count rate of data. |
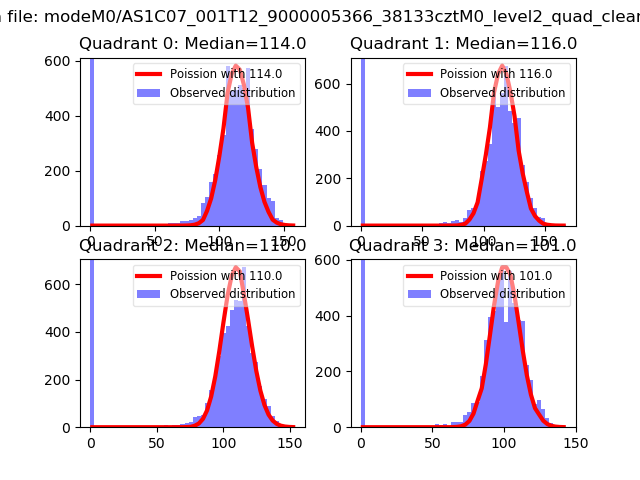 |
 |
| Quadrant-wise count rates Data is divided into 100 sec bins |
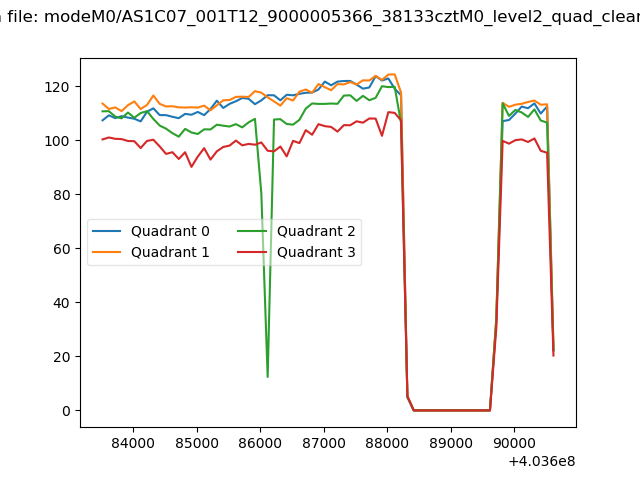 |
|
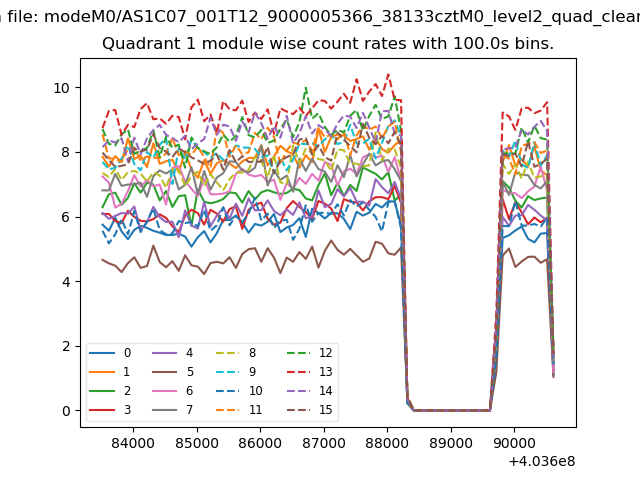
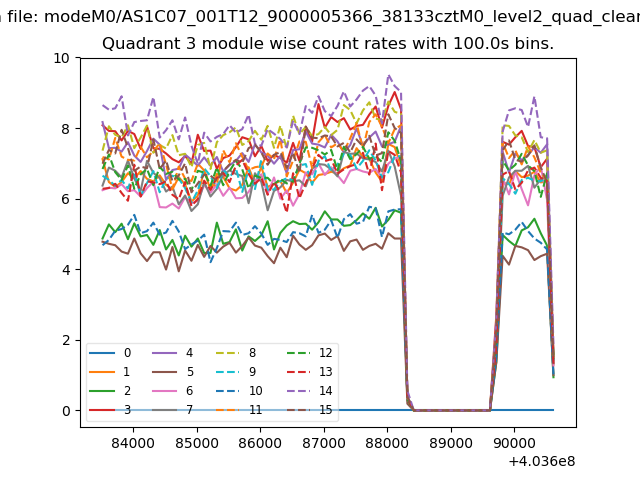
| Module-wise count rates for Quadrant A Data is divided into 100 sec bins |
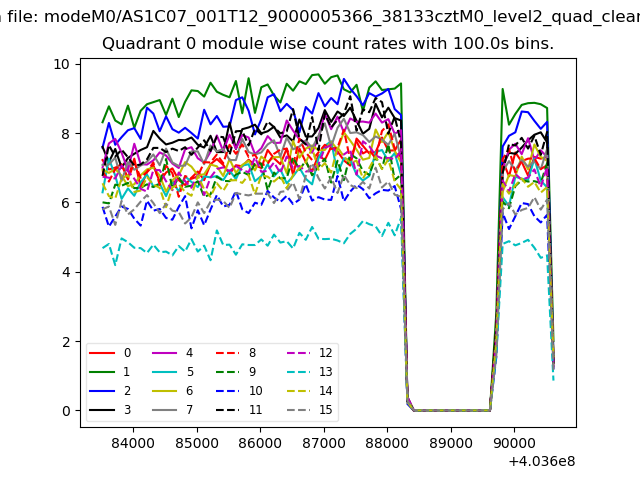 |
 |
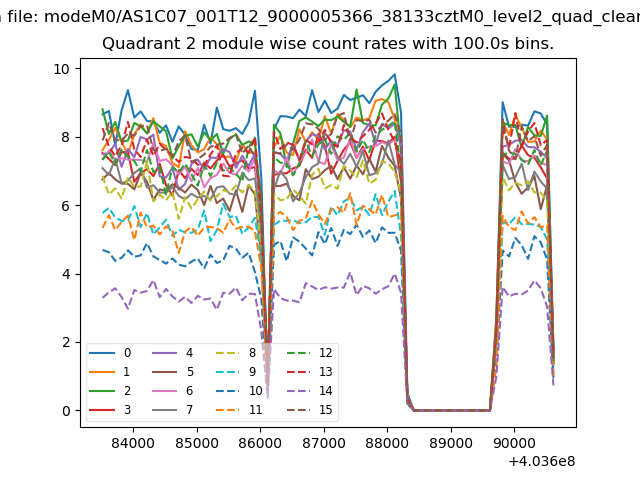
| Module-wise count rates for Quadrant B Data is divided into 100 sec bins |
 |
 |
| Module-wise count rates for Quadrant C Data is divided into 100 sec bins |
 |
 |
| Module-wise count rates for Quadrant D Data is divided into 100 sec bins |
 |
 |
| Parameter | Plot |
|---|---|
| CZT HV Monitor | 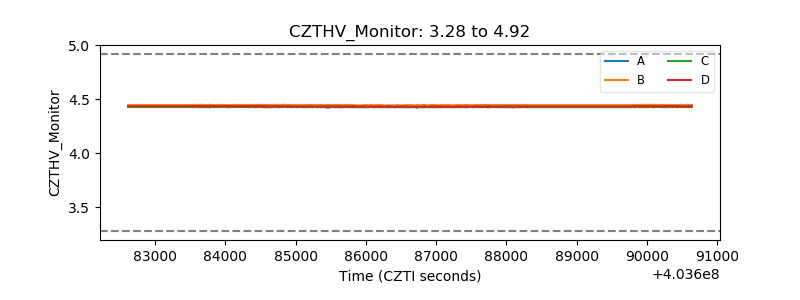 |
| D_VDD | 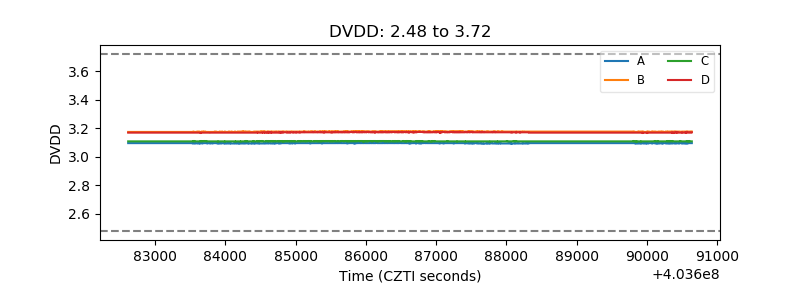 |
| Temperature 1 | 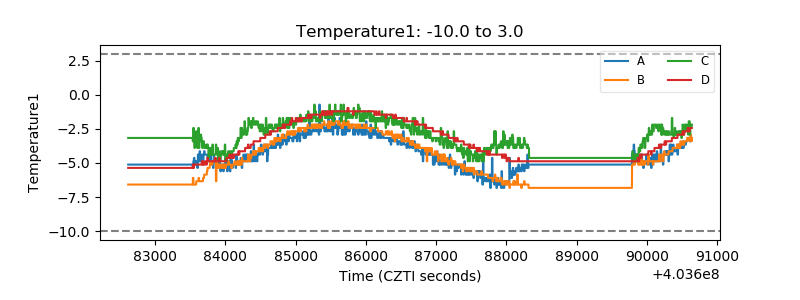 |
| Veto HV Monitor | 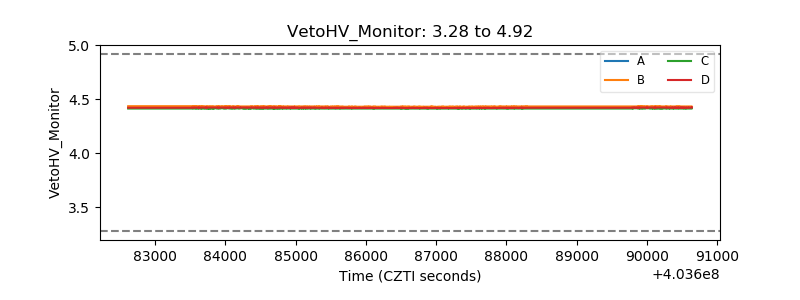 |
| Veto LLD | 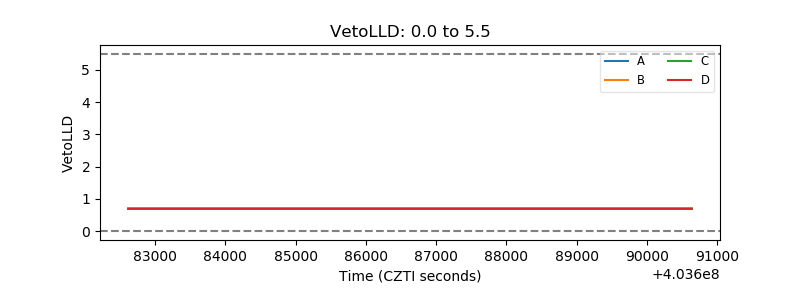 |
| Alpha Counter | 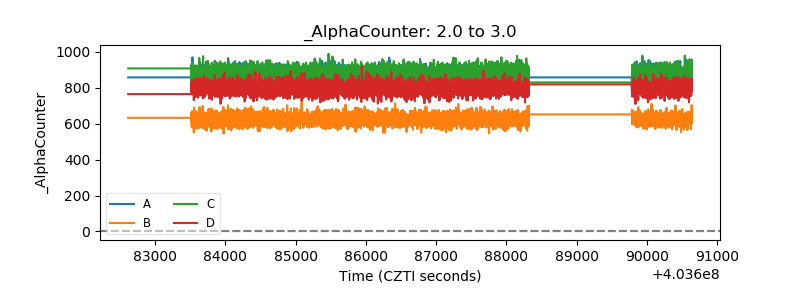 |
| _CPM_Rate | 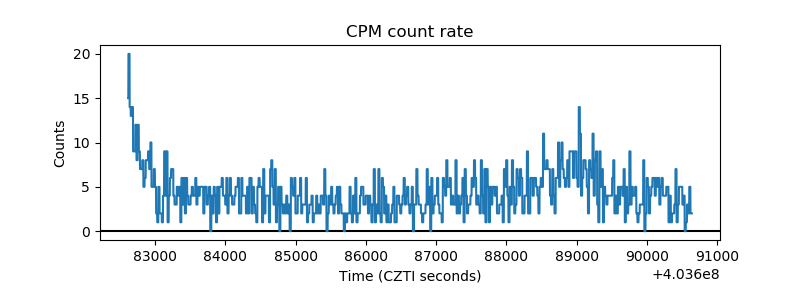 |
| CZT Counter | 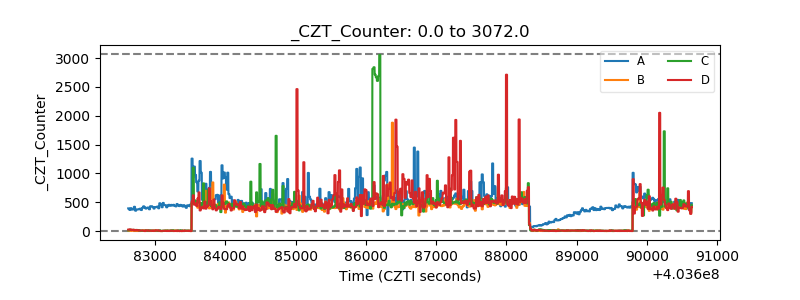 |
| +2.5 Volts monitor | 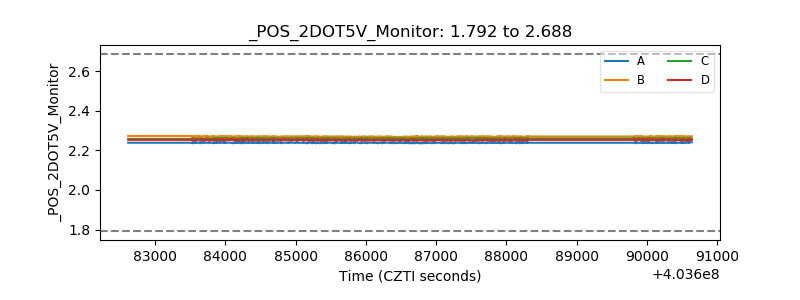 |
| +5 Volts monitor | 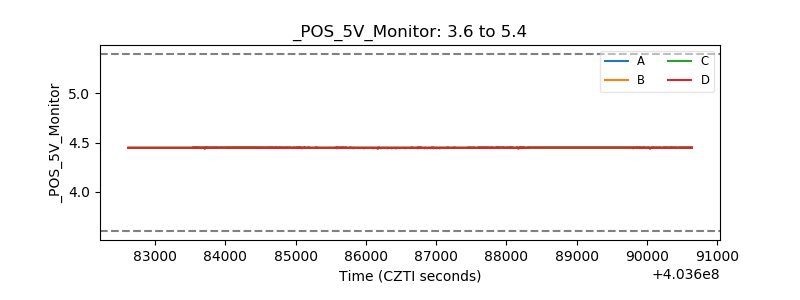 |
| _ROLL_ROT | 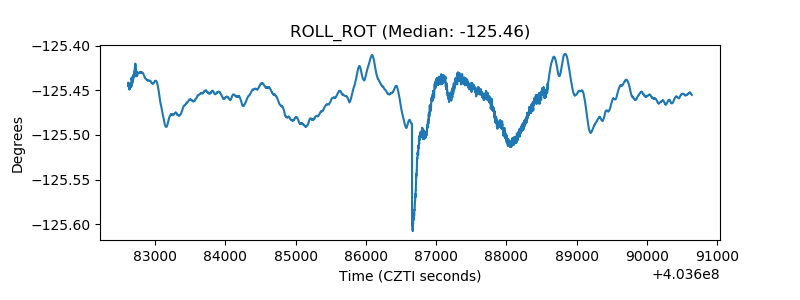 |
| _Roll_DEC | 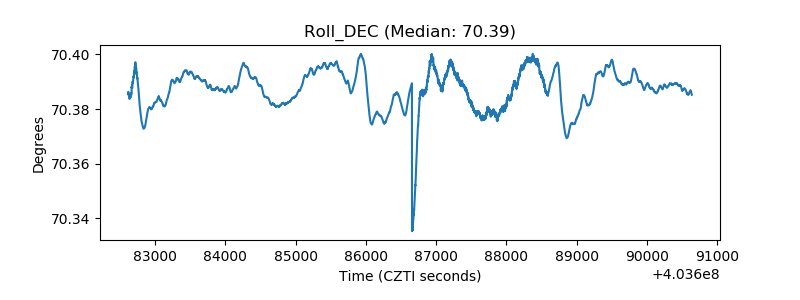 |
| _Roll_RA | 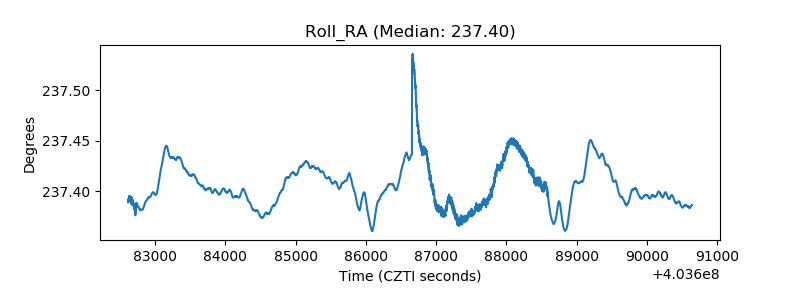 |
| Veto Counter | 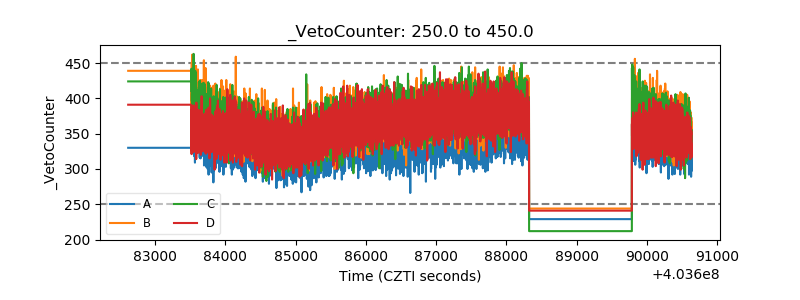 |