| Param | Original file | Final file |
|---|---|---|
| Filename | modeM0/AS1C07_001T12_9000005366_38134cztM0_level2.fits | modeM0/AS1C07_001T12_9000005366_38134cztM0_level2_quad_clean.evt |
| Size (bytes) | 348,217,920 | 97,807,680 |
| Size | 332.1 MB | 93.3 MB |
| Events in quadrant A | 2,979,469 | 665,584 |
| Events in quadrant B | 3,094,321 | 667,440 |
| Events in quadrant C | 2,885,888 | 637,602 |
| Events in quadrant D | 3,472,251 | 580,002 |
| Mode M0 | |||
|---|---|---|---|
| Quadrant | BADHDUFLAG | Total packets | Discarded packets |
| A | 0 | 12325 | 3 |
| B | 0 | 13194 | 2 |
| C | 0 | 12179 | 2 |
| D | 0 | 14370 | 2 |
| Mode M9 | |||
|---|---|---|---|
| Quadrant | BADHDUFLAG | Total packets | Discarded packets |
| A | 0 | 13 | 0 |
| B | 0 | 13 | 0 |
| C | 0 | 13 | 0 |
| D | 0 | 13 | 0 |
| Mode SS | |||
|---|---|---|---|
| Quadrant | BADHDUFLAG | Total packets | Discarded packets |
| A | 0 | 120 | 0 |
| B | 0 | 120 | 0 |
| C | 0 | 120 | 0 |
| D | 0 | 120 | 0 |
| Quadrant | Total seconds | Saturated seconds | Saturation percentage |
|---|---|---|---|
| A | 5879 | 11 | 0.187107% |
| B | 5879 | 122 | 2.075183% |
| C | 5879 | 13 | 0.221126% |
| D | 5880 | 97 | 1.649660% |
Noise dominated data is calculated using 1-second bins in cleaned event files. If a bin has >2000 counts, and if more than 50% of those come from <1% of pixels, then it is considered to be noise-dominated and hence unusable.
| Quadrant | # 1 sec bins | Bins with >0 counts | Bins with >2000 counts | High rate bins dominated by noise | Noise dominated (total time) | Noise dominated (detector-on time) | Marked lightcurve |
|---|---|---|---|---|---|---|---|
| A | 7192 | 5880 | 5 | 5 | 0.07% | 0.09% | 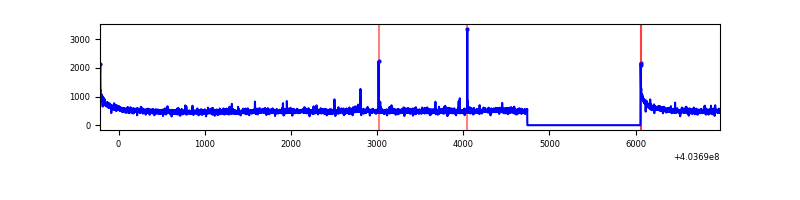 |
| B | 7192 | 5880 | 86 | 86 | 1.20% | 1.46% | 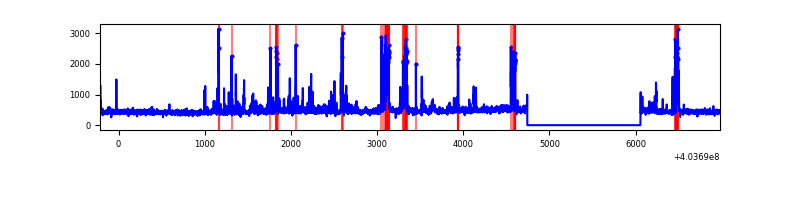 |
| C | 7192 | 5880 | 5 | 5 | 0.07% | 0.09% | 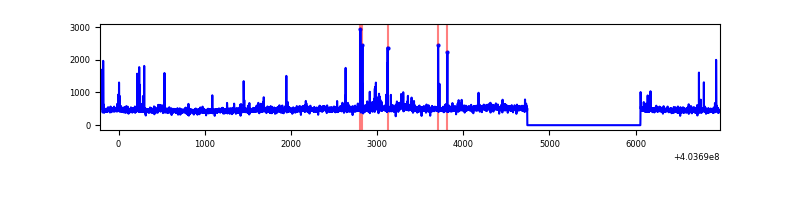 |
| D | 7193 | 5881 | 97 | 97 | 1.35% | 1.65% | 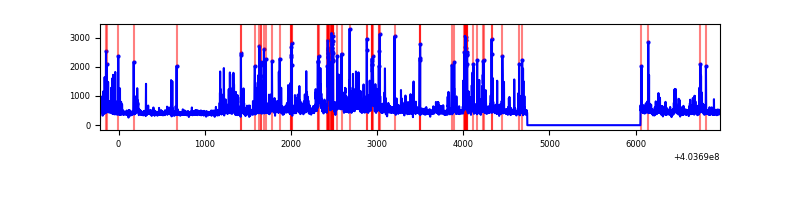 |
Top three noisy pixels from each quadrant. If the there are fewer than three noisy pixels in the level2.evt file, extra rows are filled as -1
| Pixel properties | Quadrant properties | ||||||
|---|---|---|---|---|---|---|---|
| Quadrant | DetID | PixID | Counts | Sigma | Mean | Median | Sigma |
| A | 10 | 83 | 402579 | 3064.03 | 649 | 636 | 131.2 |
| A | 12 | 189 | 26404 | 196.43 | 649 | 636 | 131.2 |
| A | 9 | 143 | 17649 | 129.69 | 649 | 636 | 131.2 |
| B | 0 | 229 | 346956 | 2775.64 | 640 | 622 | 124.8 |
| B | 5 | 172 | 111181 | 886.06 | 640 | 622 | 124.8 |
| B | 4 | 171 | 104677 | 833.93 | 640 | 622 | 124.8 |
| C | 15 | 214 | 246115 | 1687.96 | 628 | 632 | 145.4 |
| C | 3 | 233 | 58020 | 394.6 | 628 | 632 | 145.4 |
| C | 14 | 254 | 44440 | 301.23 | 628 | 632 | 145.4 |
| D | 12 | 227 | 257944 | 1680.01 | 625 | 607 | 153.2 |
| D | 13 | 249 | 185756 | 1208.74 | 625 | 607 | 153.2 |
| D | 4 | 239 | 135926 | 883.42 | 625 | 607 | 153.2 |
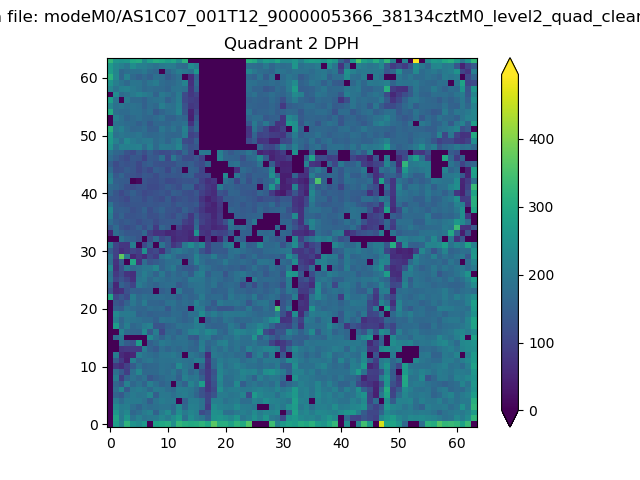
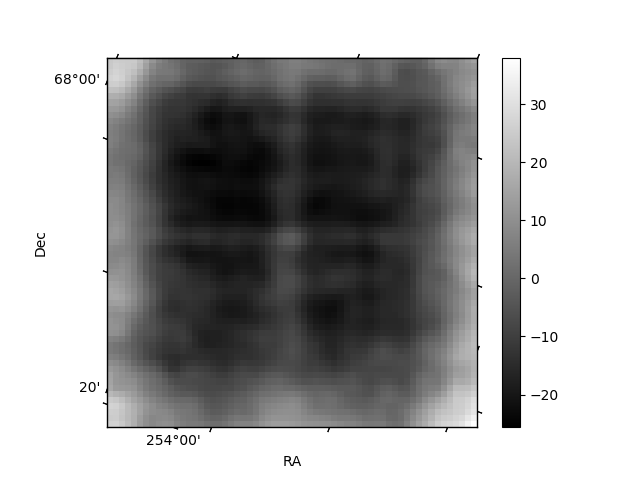
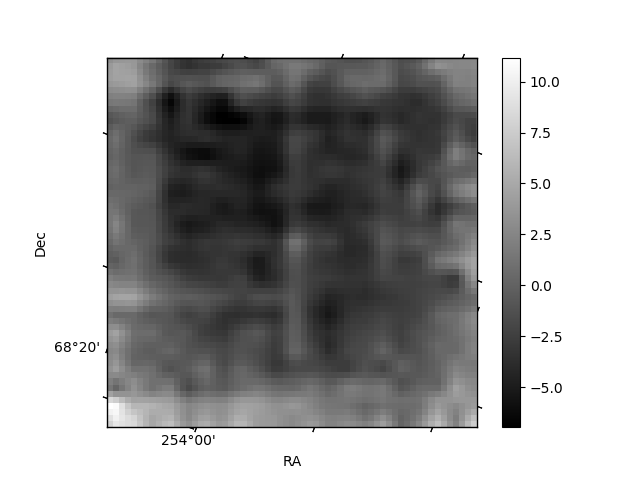
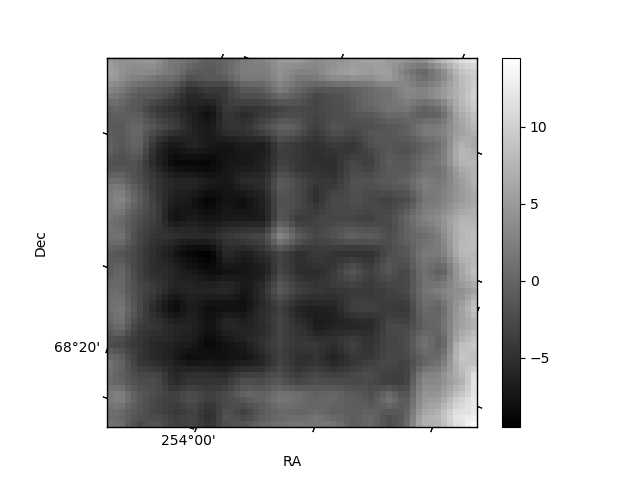
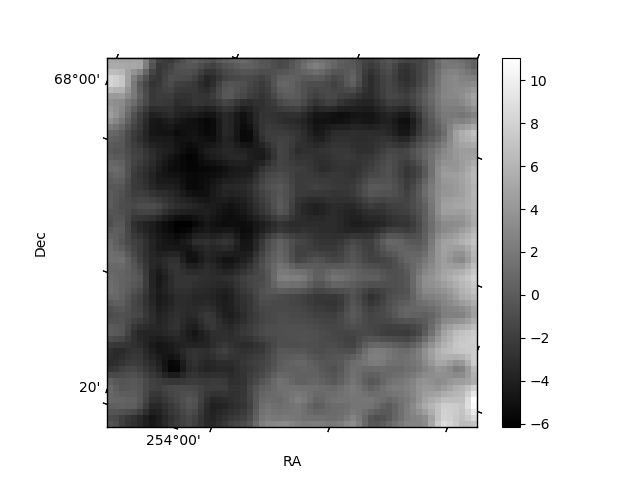
Histogram calculated using DETX and DETY for each event in the final _common_clean file
| Quadrant A | 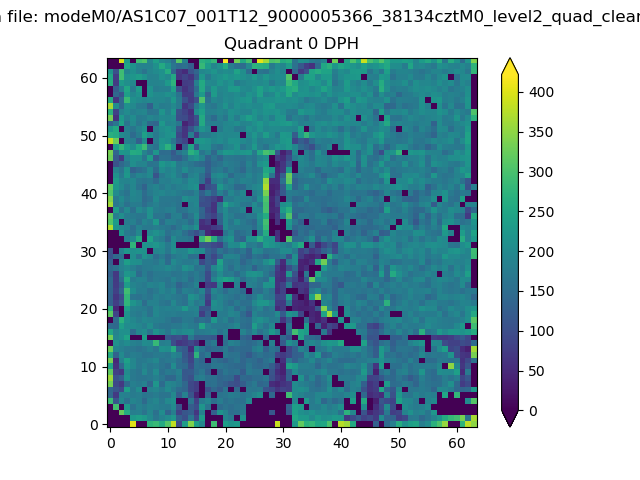 |
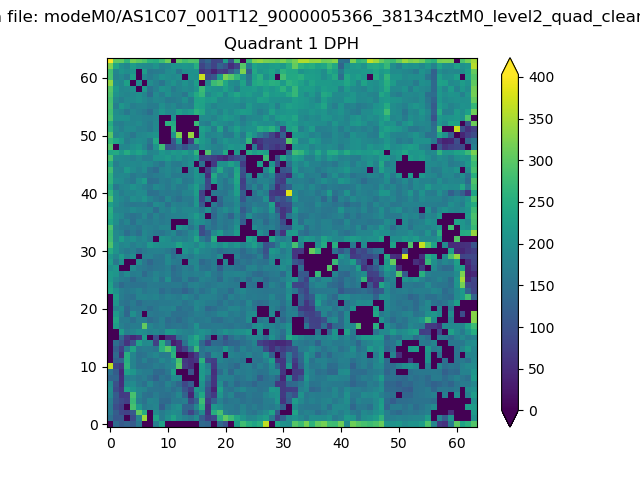 |
Quadrant B |
|---|---|---|---|
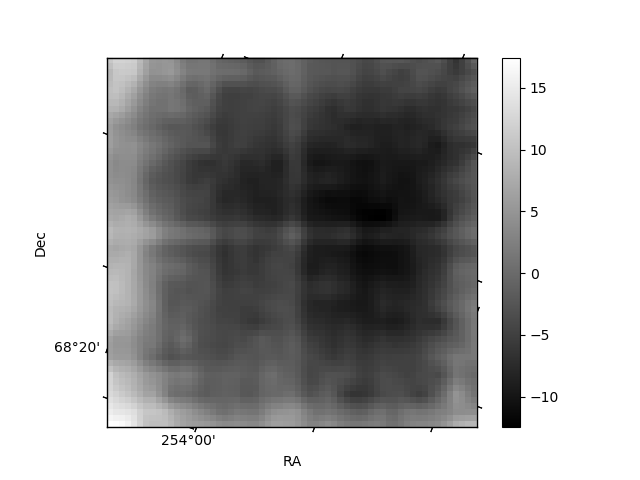
| Quadrant D | 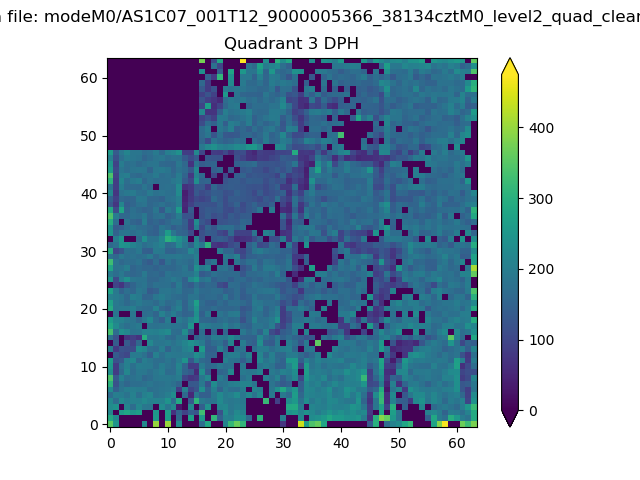 |
 |
Quadrant C |
| Plot type | Count rate plots | Images |
|---|---|---|
| Comparison with Poisson distribution Blue bars denote a histogram of data divided into 1 sec bins. Red curve is a Poisson curve with rate = median count rate of data. |
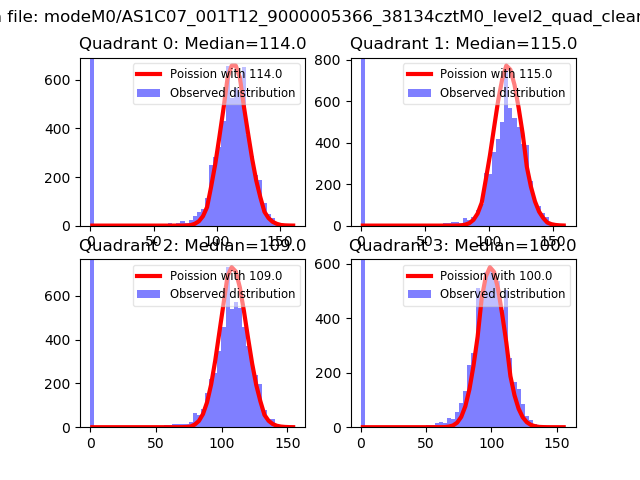 |
 |
| Quadrant-wise count rates Data is divided into 100 sec bins |
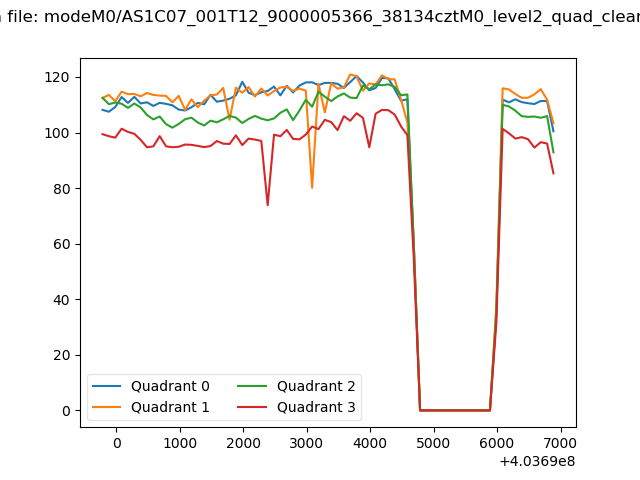 |
|
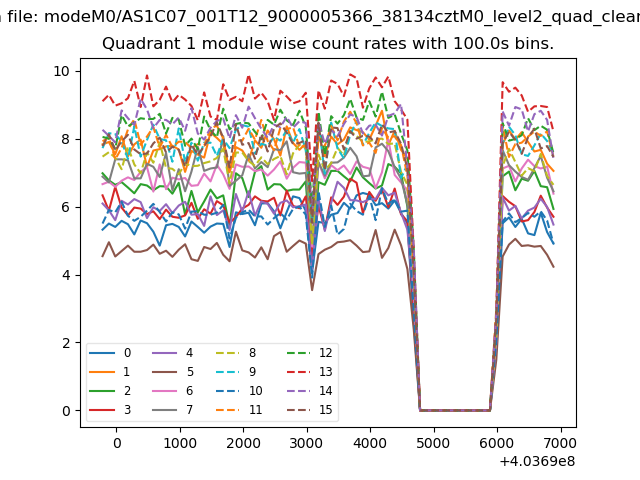
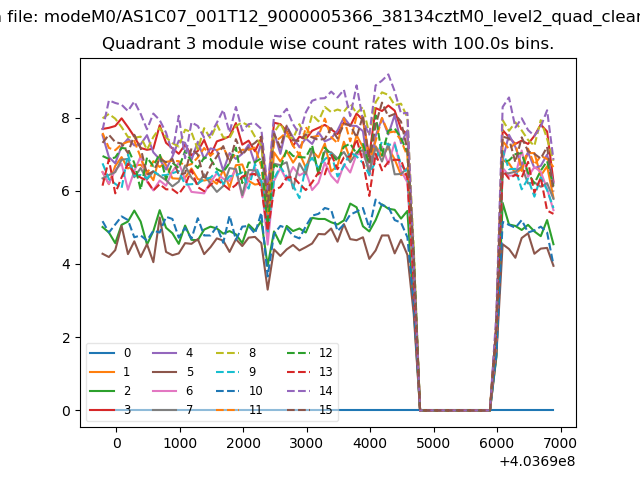
| Module-wise count rates for Quadrant A Data is divided into 100 sec bins |
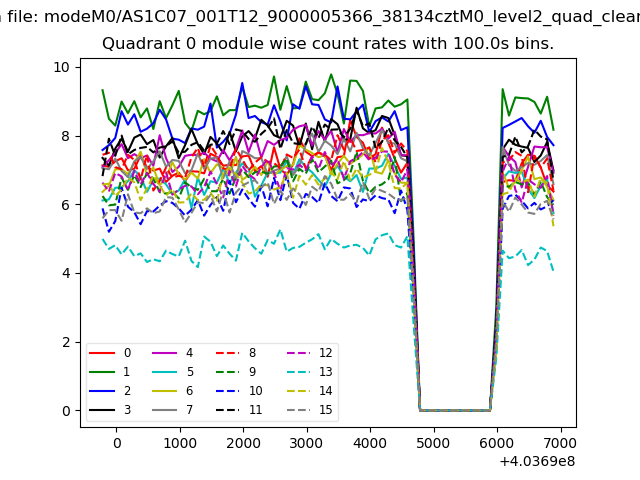 |
 |
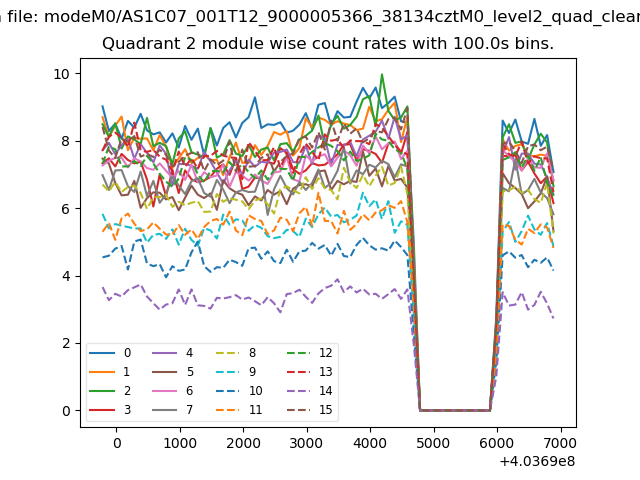
| Module-wise count rates for Quadrant B Data is divided into 100 sec bins |
 |
 |
| Module-wise count rates for Quadrant C Data is divided into 100 sec bins |
 |
 |
| Module-wise count rates for Quadrant D Data is divided into 100 sec bins |
 |
 |
| Parameter | Plot |
|---|---|
| CZT HV Monitor | 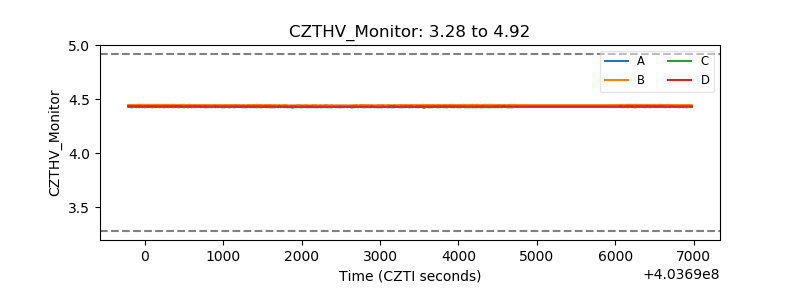 |
| D_VDD | 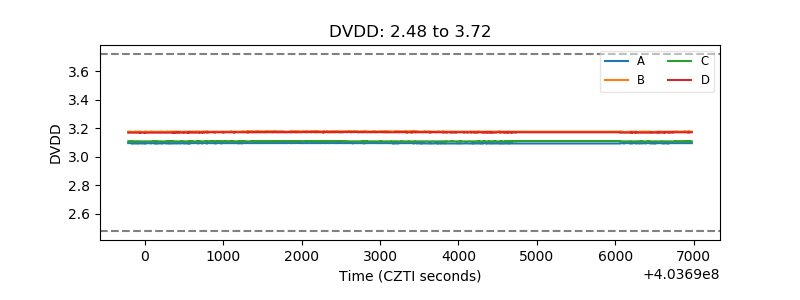 |
| Temperature 1 | 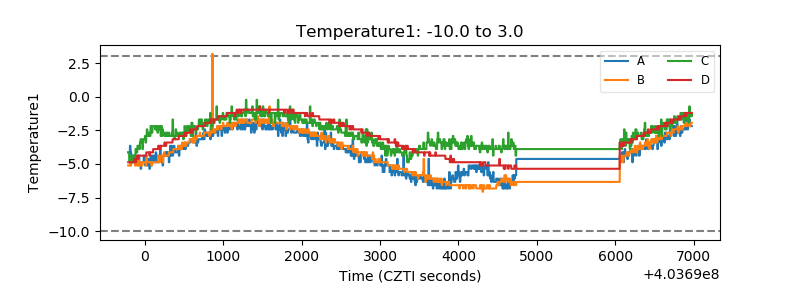 |
| Veto HV Monitor | 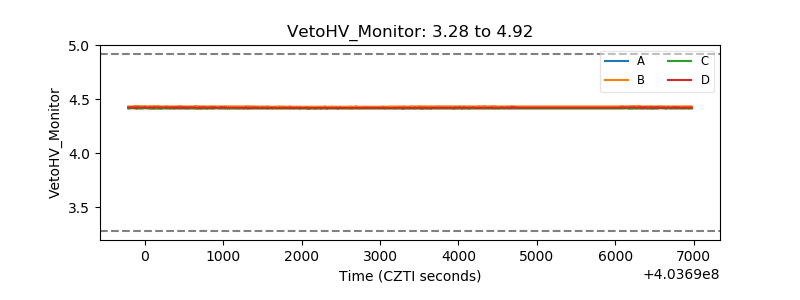 |
| Veto LLD | 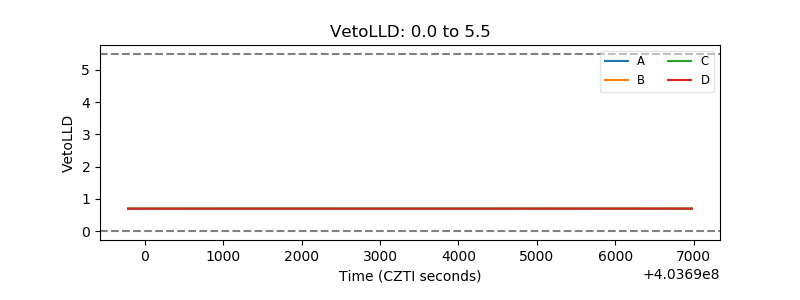 |
| Alpha Counter | 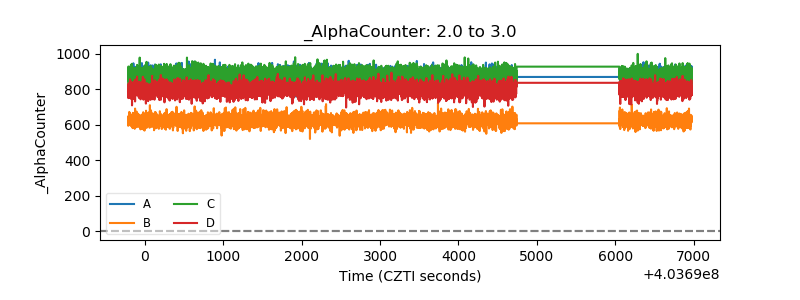 |
| _CPM_Rate | 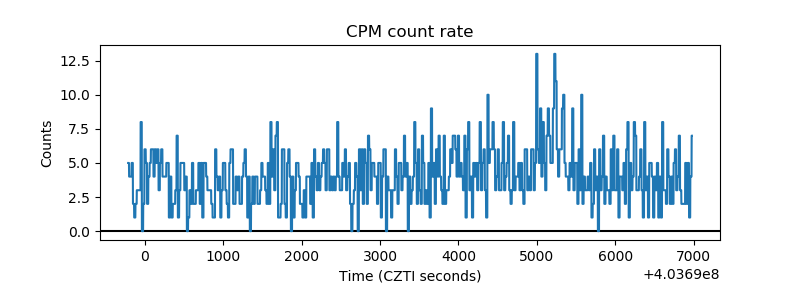 |
| CZT Counter | 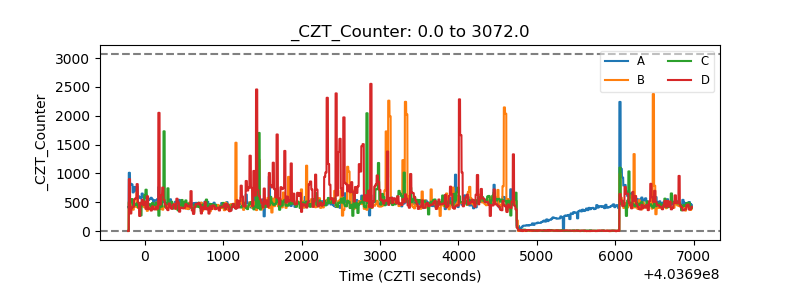 |
| +2.5 Volts monitor | 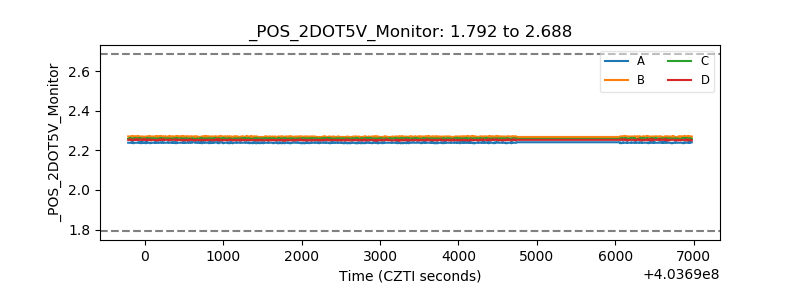 |
| +5 Volts monitor | 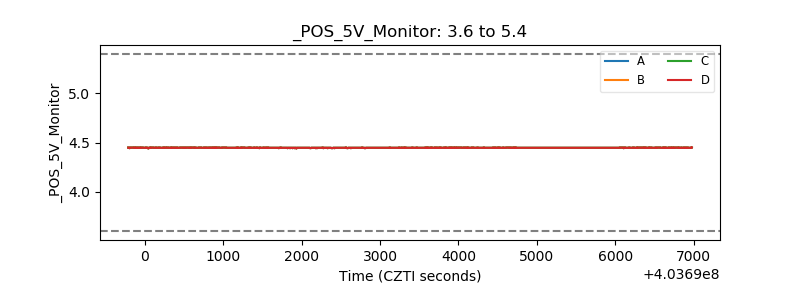 |
| _ROLL_ROT | 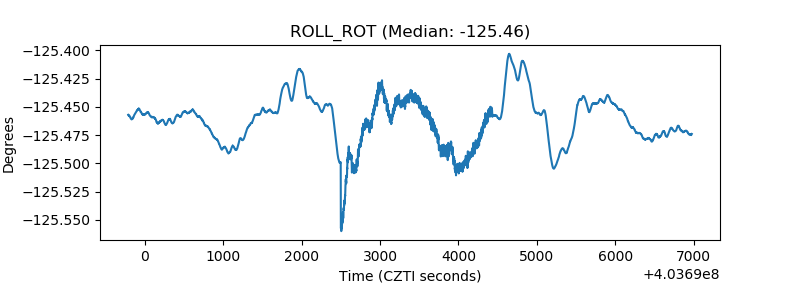 |
| _Roll_DEC | 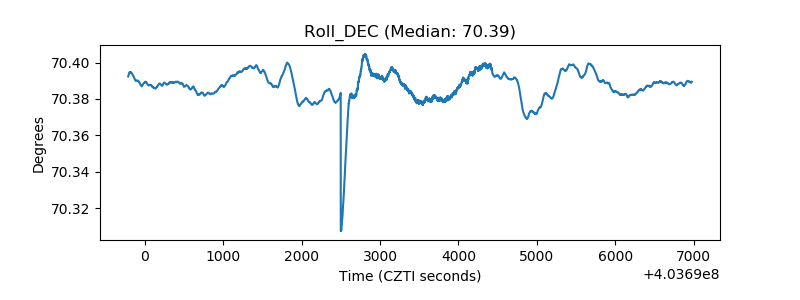 |
| _Roll_RA | 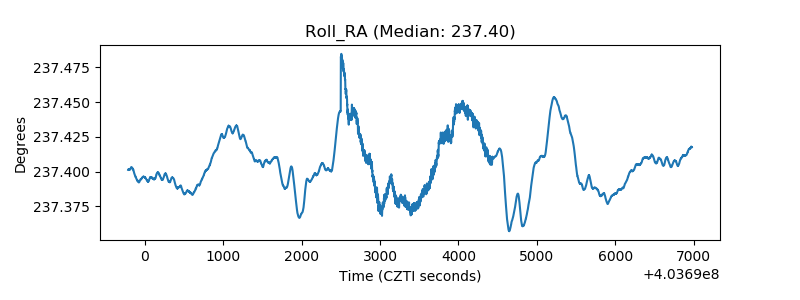 |
| Veto Counter | 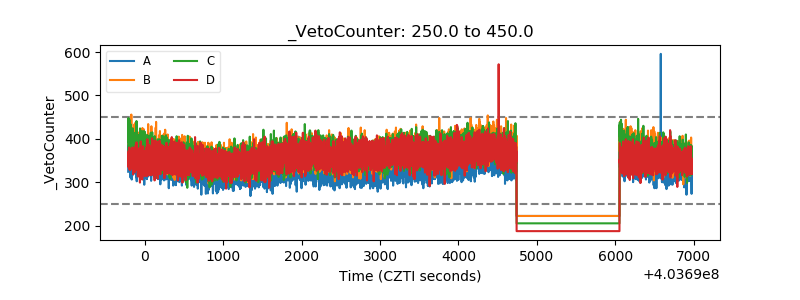 |