| Param | Original file | Final file |
|---|---|---|
| Filename | modeM0/AS1C07_001T12_9000005366_38137cztM0_level2.fits | modeM0/AS1C07_001T12_9000005366_38137cztM0_level2_quad_clean.evt |
| Size (bytes) | 903,948,480 | 256,608,000 |
| Size | 862.1 MB | 244.7 MB |
| Events in quadrant A | 7,943,637 | 1,745,868 |
| Events in quadrant B | 8,124,886 | 1,747,889 |
| Events in quadrant C | 7,628,579 | 1,668,946 |
| Events in quadrant D | 8,556,320 | 1,531,806 |
| Mode M0 | |||
|---|---|---|---|
| Quadrant | BADHDUFLAG | Total packets | Discarded packets |
| A | 0 | 32991 | 5 |
| B | 0 | 34596 | 4 |
| C | 0 | 32231 | 4 |
| D | 0 | 36063 | 4 |
| Mode M9 | |||
|---|---|---|---|
| Quadrant | BADHDUFLAG | Total packets | Discarded packets |
| A | 0 | 45 | 0 |
| B | 0 | 45 | 0 |
| C | 0 | 45 | 0 |
| D | 0 | 46 | 0 |
| Mode SS | |||
|---|---|---|---|
| Quadrant | BADHDUFLAG | Total packets | Discarded packets |
| A | 0 | 316 | 0 |
| B | 0 | 316 | 0 |
| C | 0 | 316 | 0 |
| D | 0 | 316 | 0 |
| Quadrant | Total seconds | Saturated seconds | Saturation percentage |
|---|---|---|---|
| A | 15585 | 38 | 0.243824% |
| B | 15585 | 216 | 1.385948% |
| C | 15585 | 34 | 0.218158% |
| D | 15585 | 196 | 1.257620% |
Noise dominated data is calculated using 1-second bins in cleaned event files. If a bin has >2000 counts, and if more than 50% of those come from <1% of pixels, then it is considered to be noise-dominated and hence unusable.
| Quadrant | # 1 sec bins | Bins with >0 counts | Bins with >2000 counts | High rate bins dominated by noise | Noise dominated (total time) | Noise dominated (detector-on time) | Marked lightcurve |
|---|---|---|---|---|---|---|---|
| A | 19794 | 15588 | 12 | 12 | 0.06% | 0.08% | 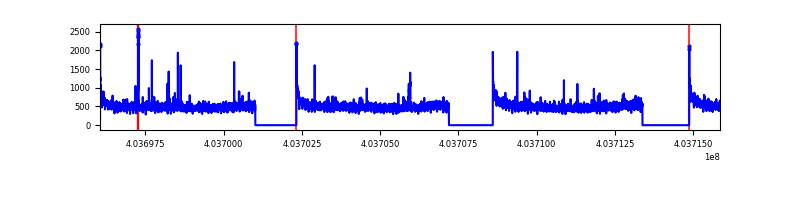 |
| B | 19794 | 15588 | 141 | 141 | 0.71% | 0.90% | 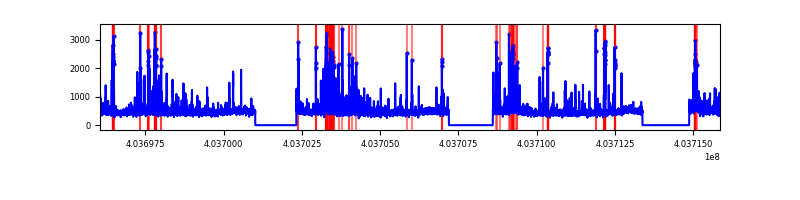 |
| C | 19794 | 15588 | 27 | 27 | 0.14% | 0.17% | 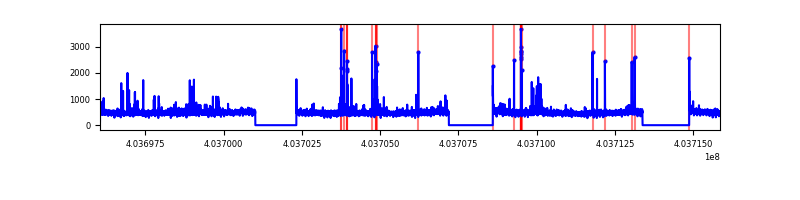 |
| D | 19794 | 15588 | 158 | 158 | 0.80% | 1.01% | 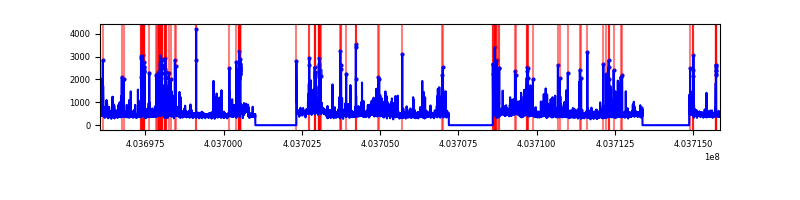 |
Top three noisy pixels from each quadrant. If the there are fewer than three noisy pixels in the level2.evt file, extra rows are filled as -1
| Pixel properties | Quadrant properties | ||||||
|---|---|---|---|---|---|---|---|
| Quadrant | DetID | PixID | Counts | Sigma | Mean | Median | Sigma |
| A | 10 | 83 | 993492 | 2848.68 | 1730 | 1693 | 348.2 |
| A | 12 | 189 | 96717 | 272.93 | 1730 | 1693 | 348.2 |
| A | 15 | 223 | 69125 | 193.68 | 1730 | 1693 | 348.2 |
| B | 0 | 229 | 531217 | 1639.33 | 1709 | 1664 | 323.0 |
| B | 4 | 171 | 260261 | 800.54 | 1709 | 1664 | 323.0 |
| B | 5 | 172 | 252620 | 776.88 | 1709 | 1664 | 323.0 |
| C | 15 | 214 | 645868 | 1646.68 | 1683 | 1690 | 391.2 |
| C | 1 | 23 | 159516 | 403.44 | 1683 | 1690 | 391.2 |
| C | 14 | 254 | 100807 | 253.37 | 1683 | 1690 | 391.2 |
| D | 12 | 233 | 520015 | 1283.82 | 1674 | 1627 | 403.8 |
| D | 13 | 249 | 205942 | 506.0 | 1674 | 1627 | 403.8 |
| D | 1 | 52 | 164286 | 402.83 | 1674 | 1627 | 403.8 |
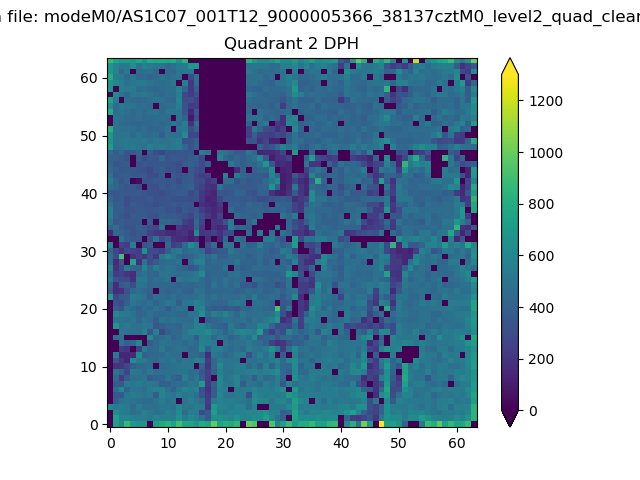
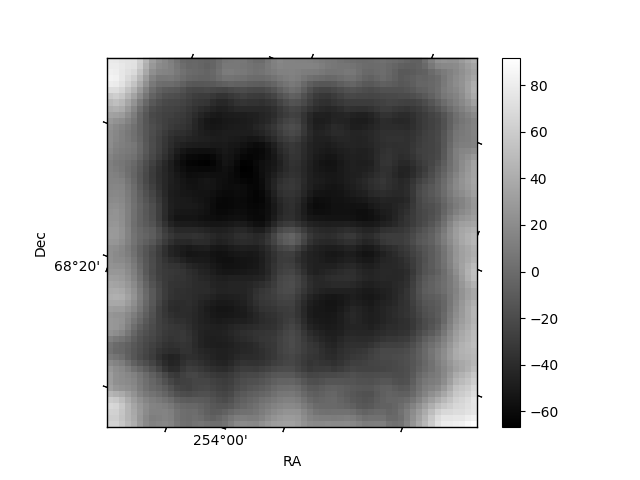
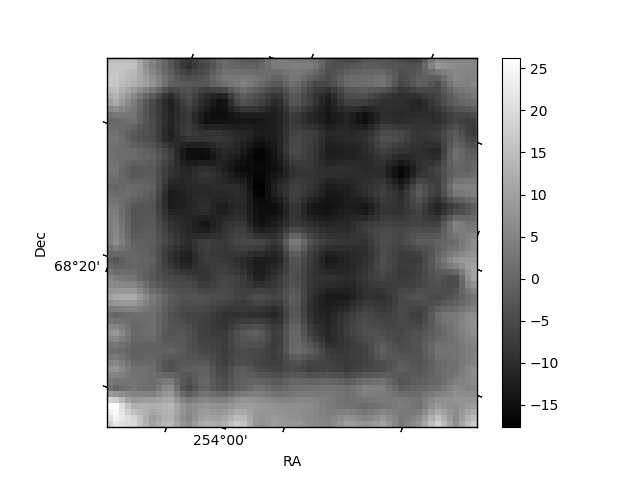
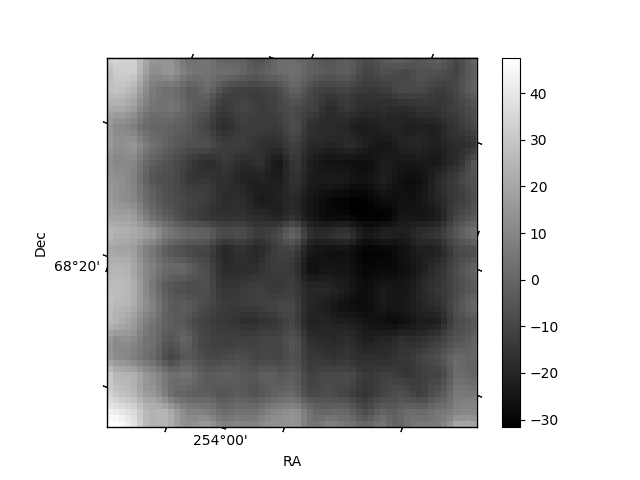
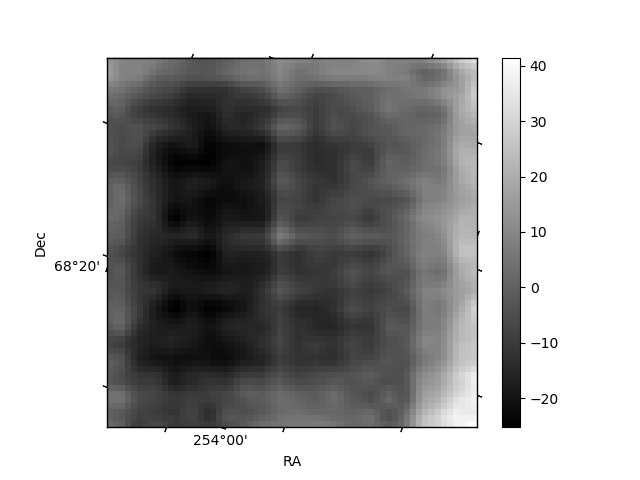
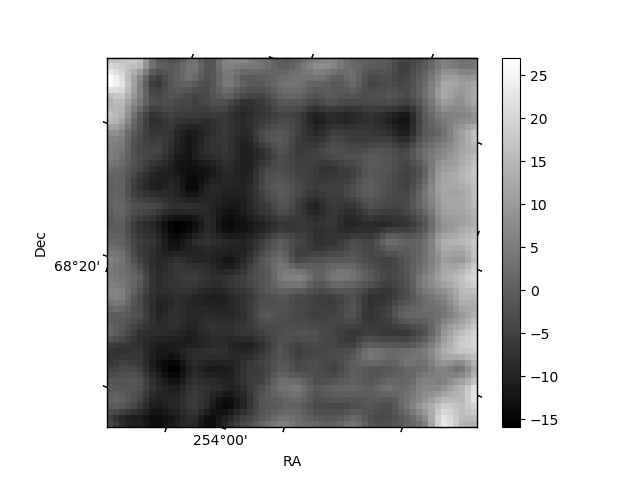
Histogram calculated using DETX and DETY for each event in the final _common_clean file
| Quadrant A | 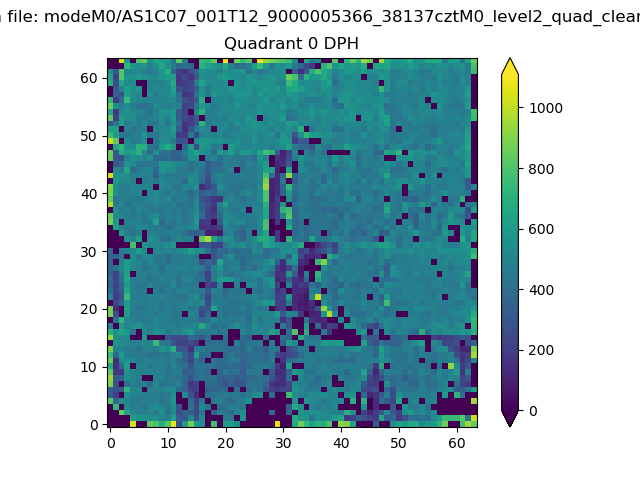 |
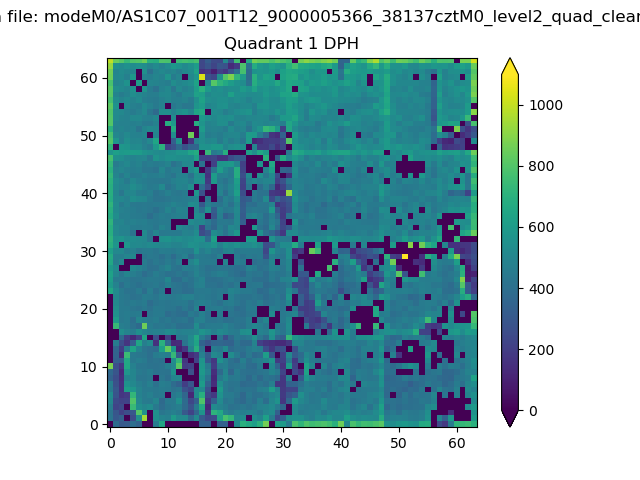 |
Quadrant B |
|---|---|---|---|
| Quadrant D | 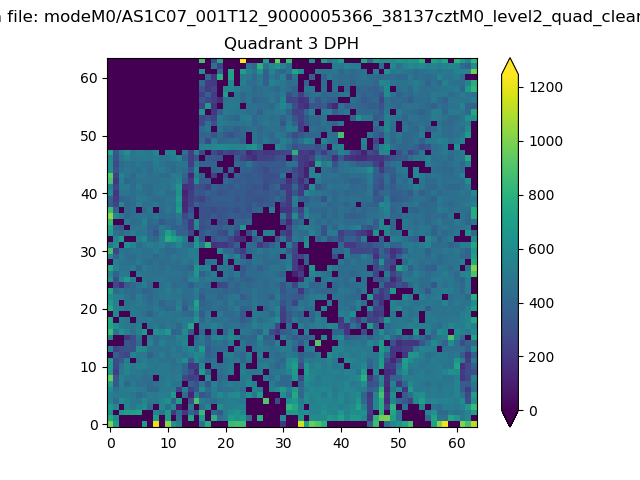 |
 |
Quadrant C |
| Plot type | Count rate plots | Images |
|---|---|---|
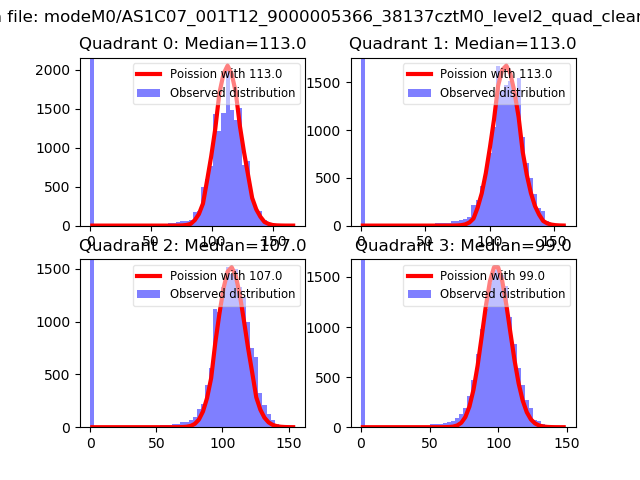
| Comparison with Poisson distribution Blue bars denote a histogram of data divided into 1 sec bins. Red curve is a Poisson curve with rate = median count rate of data. |
 |
 |
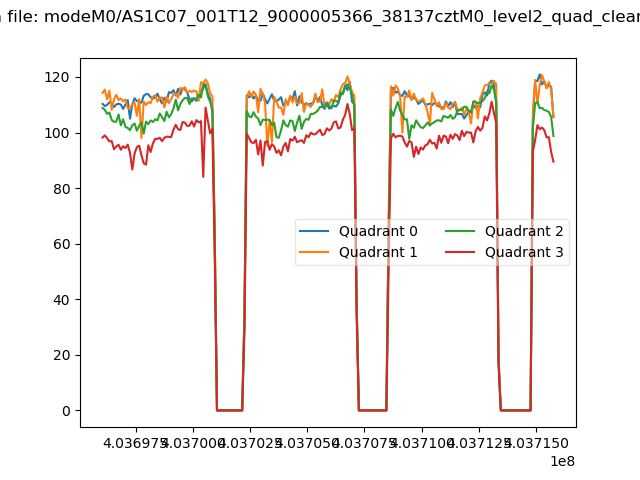
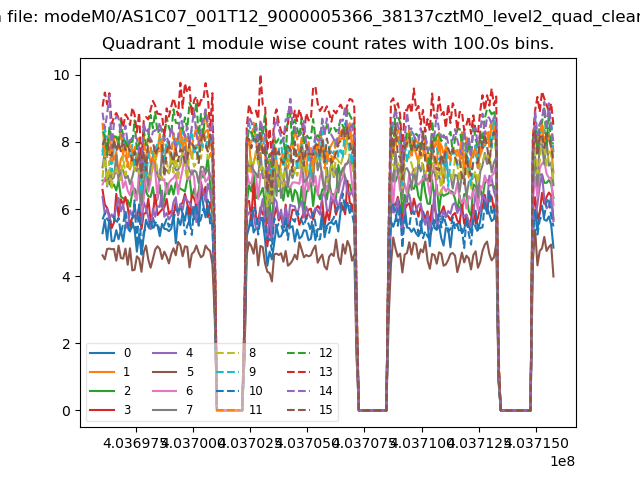
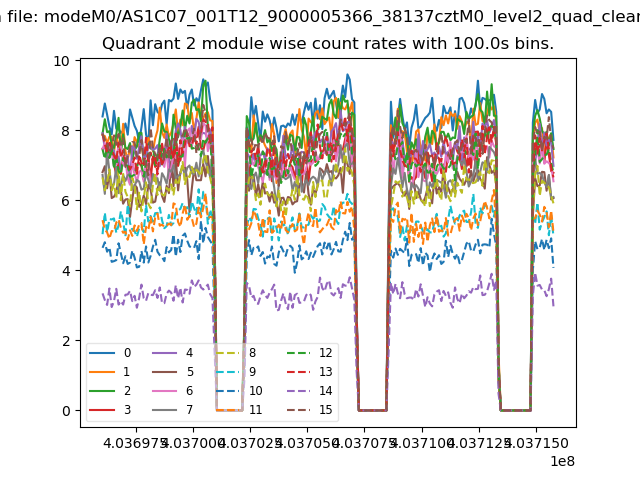
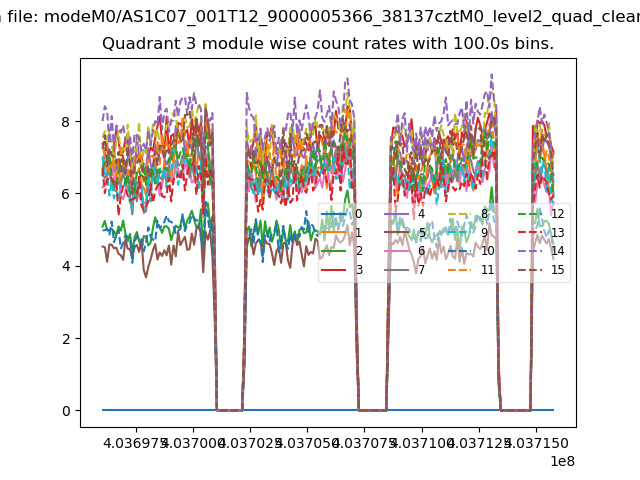
| Quadrant-wise count rates Data is divided into 100 sec bins |
 |
|
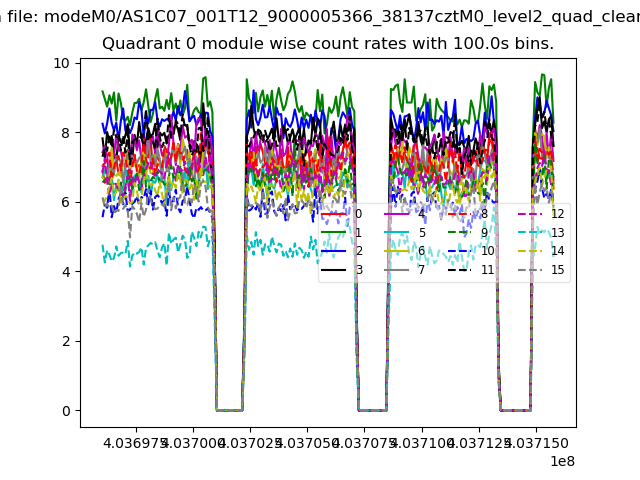
| Module-wise count rates for Quadrant A Data is divided into 100 sec bins |
 |
 |
| Module-wise count rates for Quadrant B Data is divided into 100 sec bins |
 |
 |
| Module-wise count rates for Quadrant C Data is divided into 100 sec bins |
 |
 |
| Module-wise count rates for Quadrant D Data is divided into 100 sec bins |
 |
 |
| Parameter | Plot |
|---|---|
| CZT HV Monitor | 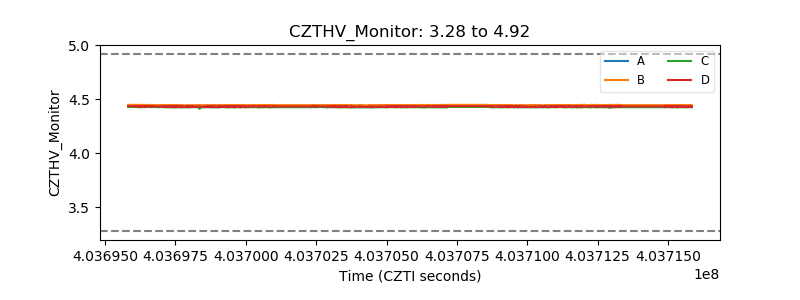 |
| D_VDD | 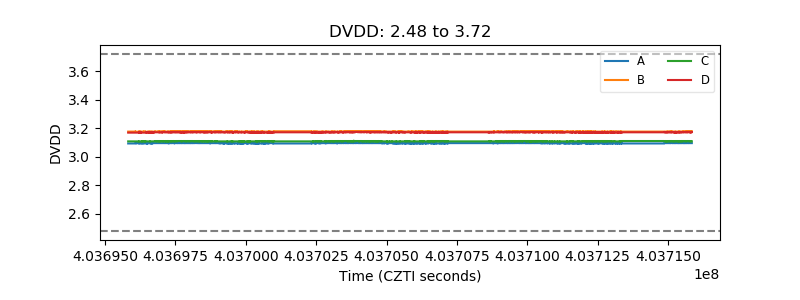 |
| Temperature 1 | 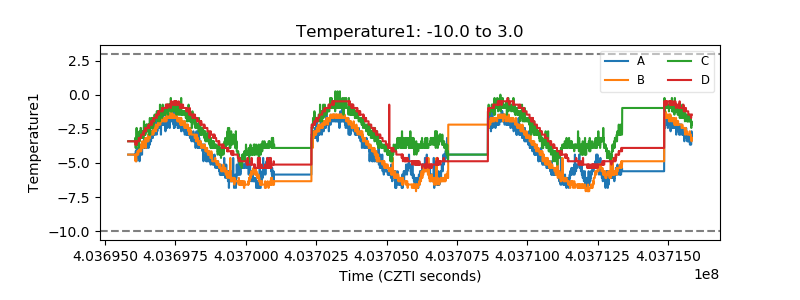 |
| Veto HV Monitor | 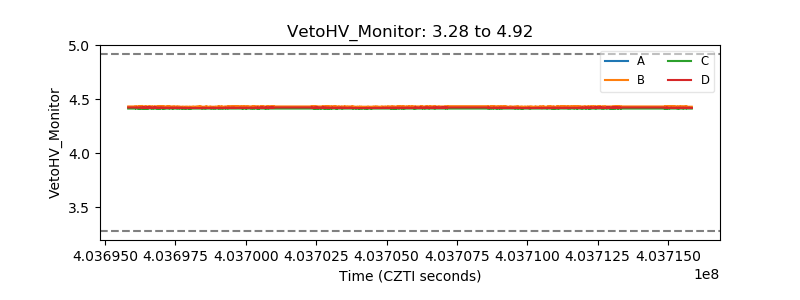 |
| Veto LLD | 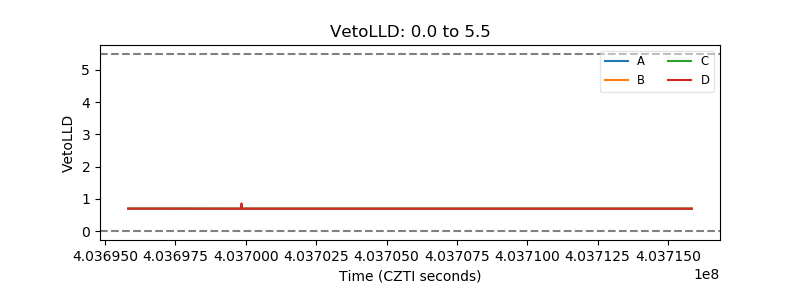 |
| Alpha Counter | 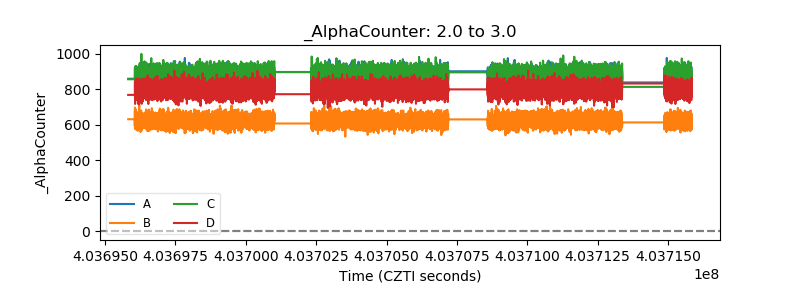 |
| _CPM_Rate | 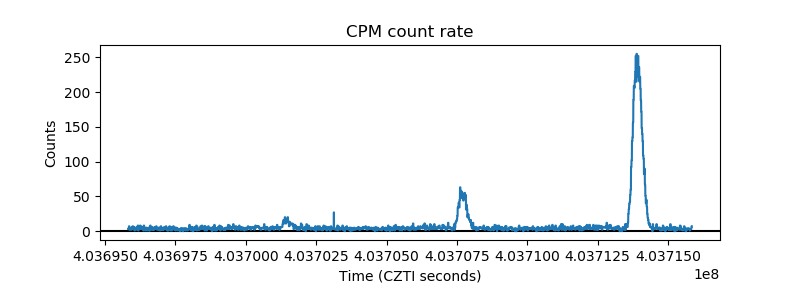 |
| CZT Counter | 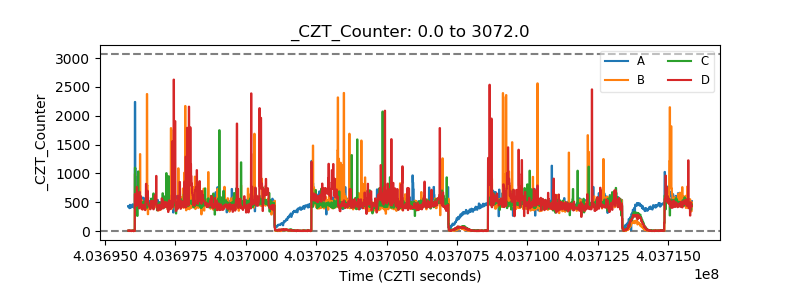 |
| +2.5 Volts monitor |  |
| +5 Volts monitor | 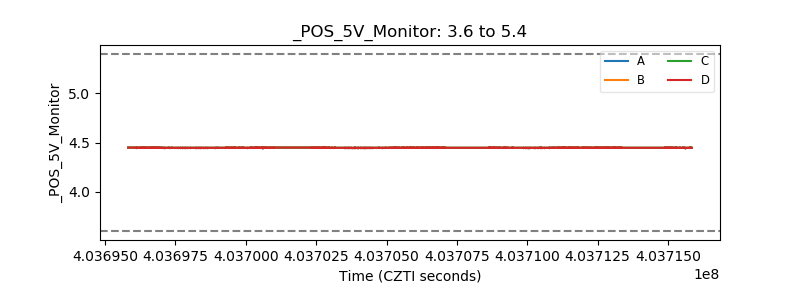 |
| _ROLL_ROT | 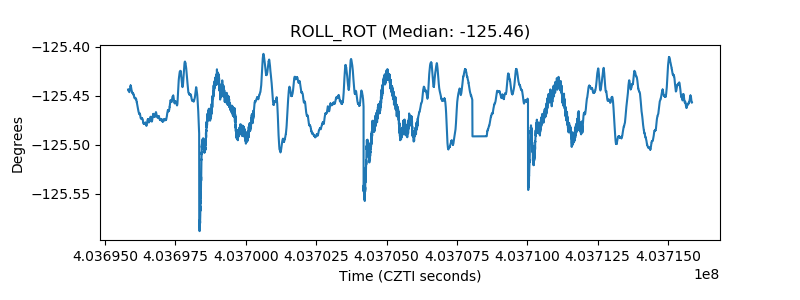 |
| _Roll_DEC | 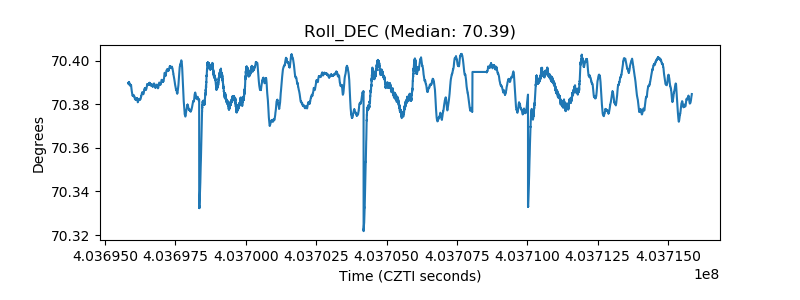 |
| _Roll_RA | 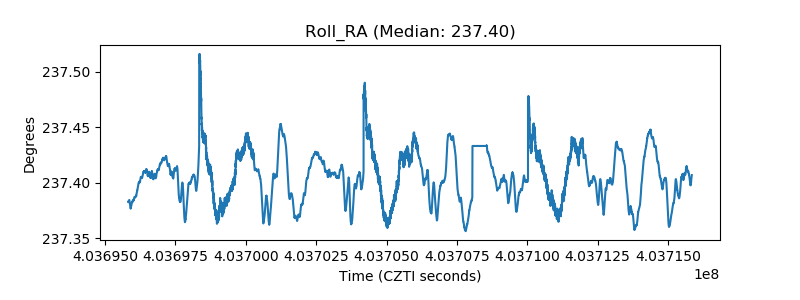 |
| Veto Counter | 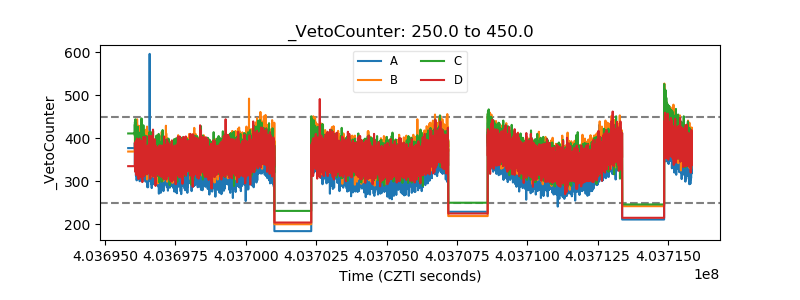 |