| Param | Original file | Final file |
|---|---|---|
| Filename | modeM0/AS1C07_001T12_9000005366_38138cztM0_level2.fits | modeM0/AS1C07_001T12_9000005366_38138cztM0_level2_quad_clean.evt |
| Size (bytes) | 304,130,880 | 92,977,920 |
| Size | 290.0 MB | 88.7 MB |
| Events in quadrant A | 2,781,754 | 630,923 |
| Events in quadrant B | 2,670,840 | 634,030 |
| Events in quadrant C | 2,629,864 | 605,343 |
| Events in quadrant D | 2,746,679 | 559,651 |
| Mode M0 | |||
|---|---|---|---|
| Quadrant | BADHDUFLAG | Total packets | Discarded packets |
| A | 0 | 11808 | 3 |
| B | 0 | 11716 | 2 |
| C | 0 | 11229 | 2 |
| D | 0 | 12014 | 2 |
| Mode M9 | |||
|---|---|---|---|
| Quadrant | BADHDUFLAG | Total packets | Discarded packets |
| A | 0 | 15 | 0 |
| B | 0 | 15 | 0 |
| C | 0 | 15 | 0 |
| D | 0 | 15 | 0 |
| Mode SS | |||
|---|---|---|---|
| Quadrant | BADHDUFLAG | Total packets | Discarded packets |
| A | 0 | 114 | 0 |
| B | 0 | 114 | 0 |
| C | 0 | 114 | 0 |
| D | 0 | 114 | 0 |
| Quadrant | Total seconds | Saturated seconds | Saturation percentage |
|---|---|---|---|
| A | 5500 | 11 | 0.200000% |
| B | 5500 | 34 | 0.618182% |
| C | 5500 | 5 | 0.090909% |
| D | 5500 | 34 | 0.618182% |
Noise dominated data is calculated using 1-second bins in cleaned event files. If a bin has >2000 counts, and if more than 50% of those come from <1% of pixels, then it is considered to be noise-dominated and hence unusable.
| Quadrant | # 1 sec bins | Bins with >0 counts | Bins with >2000 counts | High rate bins dominated by noise | Noise dominated (total time) | Noise dominated (detector-on time) | Marked lightcurve |
|---|---|---|---|---|---|---|---|
| A | 7083 | 5501 | 4 | 4 | 0.06% | 0.07% | 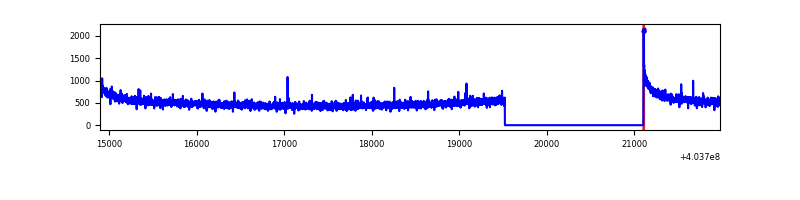 |
| B | 7083 | 5501 | 21 | 21 | 0.30% | 0.38% | 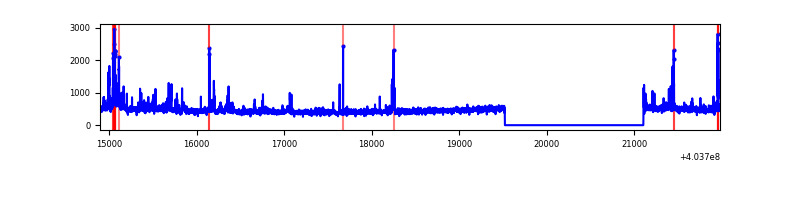 |
| C | 7083 | 5501 | 4 | 4 | 0.06% | 0.07% | 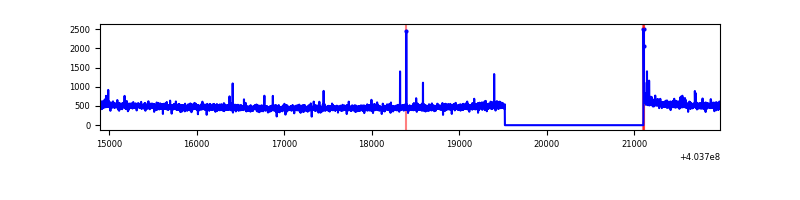 |
| D | 7083 | 5501 | 26 | 26 | 0.37% | 0.47% | 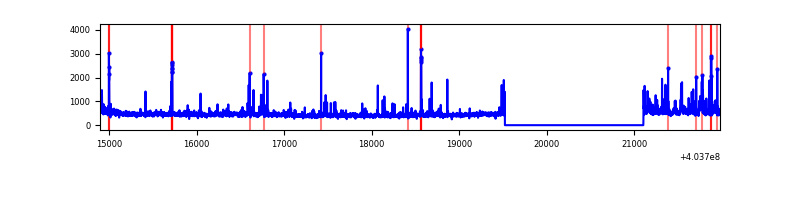 |
Top three noisy pixels from each quadrant. If the there are fewer than three noisy pixels in the level2.evt file, extra rows are filled as -1
| Pixel properties | Quadrant properties | ||||||
|---|---|---|---|---|---|---|---|
| Quadrant | DetID | PixID | Counts | Sigma | Mean | Median | Sigma |
| A | 10 | 83 | 373681 | 3005.97 | 615 | 602 | 124.1 |
| A | 12 | 189 | 13163 | 101.21 | 615 | 602 | 124.1 |
| A | 15 | 223 | 8895 | 66.82 | 615 | 602 | 124.1 |
| B | 0 | 229 | 93506 | 793.36 | 609 | 593 | 117.1 |
| B | 5 | 184 | 41421 | 348.62 | 609 | 593 | 117.1 |
| B | 5 | 172 | 39341 | 330.86 | 609 | 593 | 117.1 |
| C | 15 | 214 | 230354 | 1633.09 | 601 | 605 | 140.7 |
| C | 14 | 254 | 14361 | 97.78 | 601 | 605 | 140.7 |
| C | 0 | 10 | 12603 | 85.28 | 601 | 605 | 140.7 |
| D | 12 | 235 | 102269 | 695.66 | 599 | 582 | 146.2 |
| D | 12 | 233 | 85608 | 581.68 | 599 | 582 | 146.2 |
| D | 13 | 249 | 67026 | 454.55 | 599 | 582 | 146.2 |
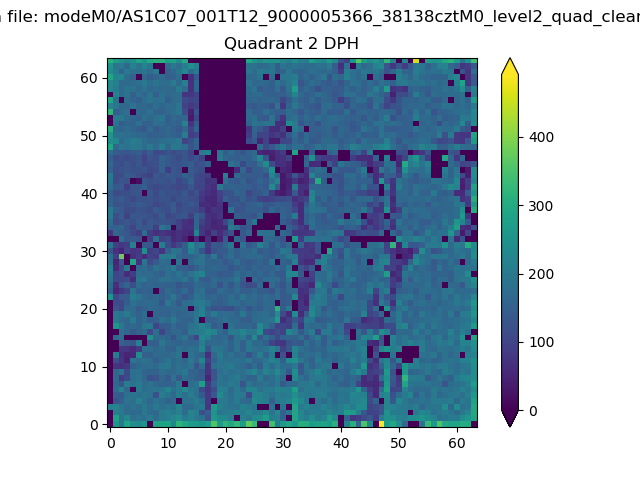
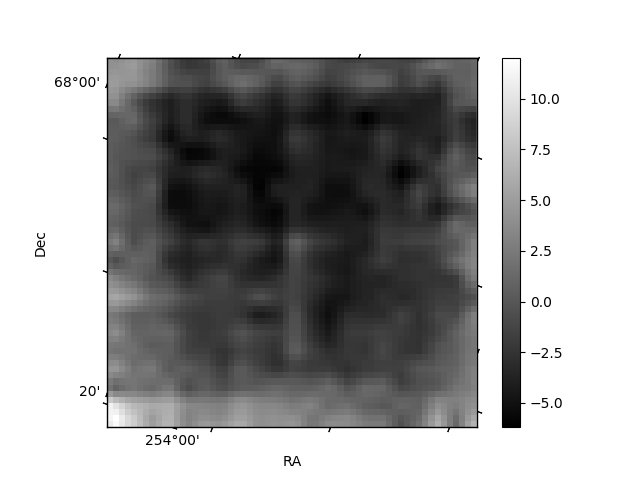
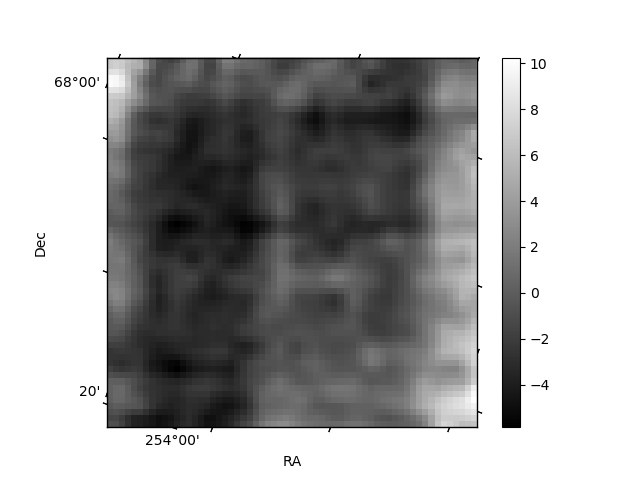
Histogram calculated using DETX and DETY for each event in the final _common_clean file
| Quadrant A |  |
 |
Quadrant B |
|---|---|---|---|
| Quadrant D | 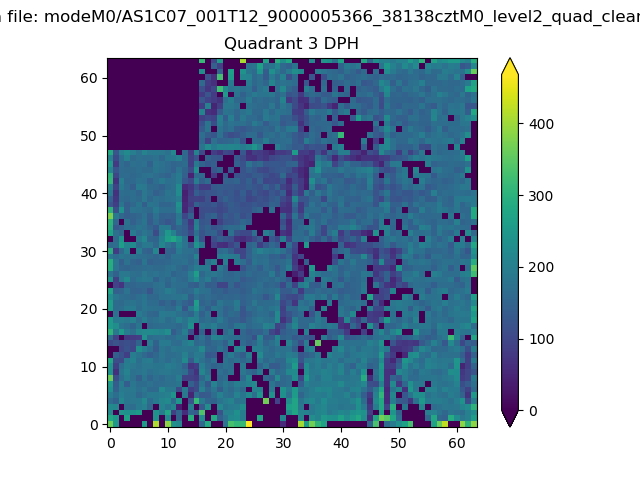 |
 |
Quadrant C |
| Plot type | Count rate plots | Images |
|---|---|---|
| Comparison with Poisson distribution Blue bars denote a histogram of data divided into 1 sec bins. Red curve is a Poisson curve with rate = median count rate of data. |
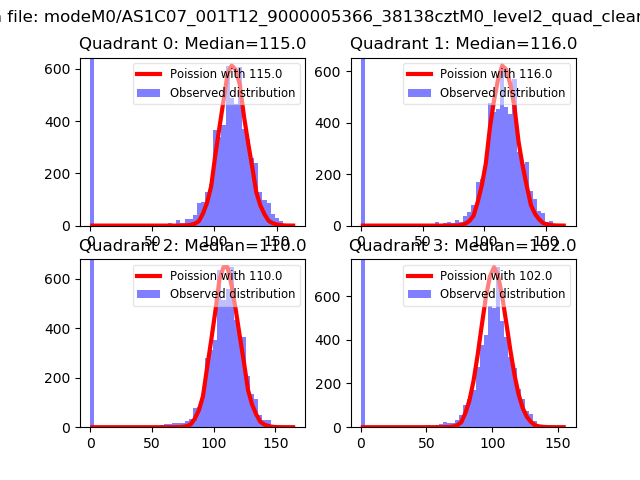 |
 |
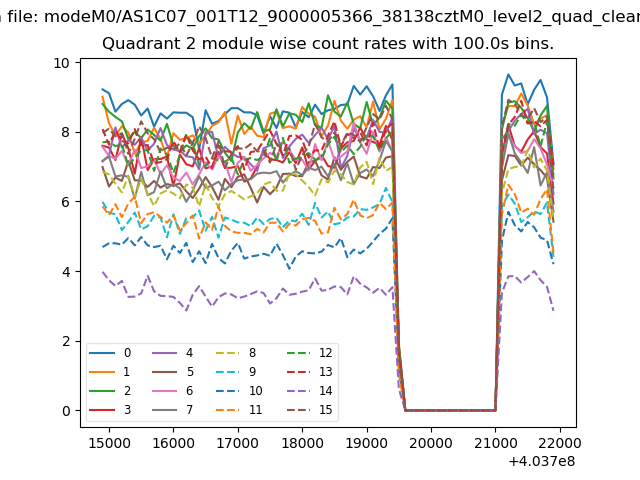
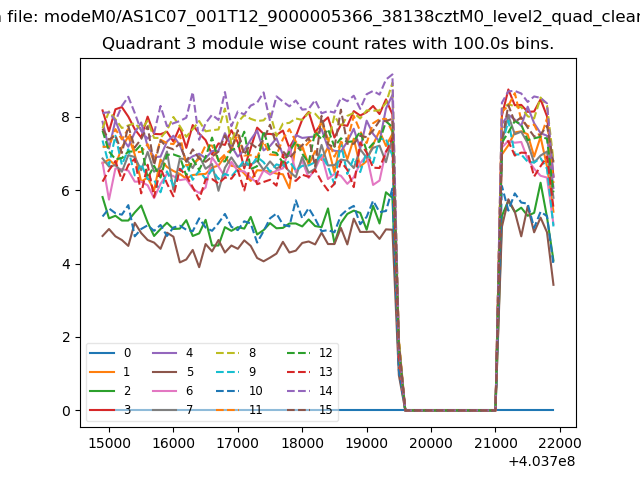
| Quadrant-wise count rates Data is divided into 100 sec bins |
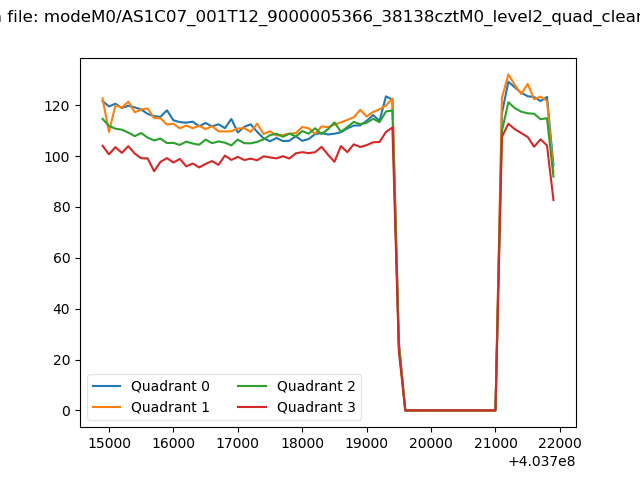 |
|
| Module-wise count rates for Quadrant A Data is divided into 100 sec bins |
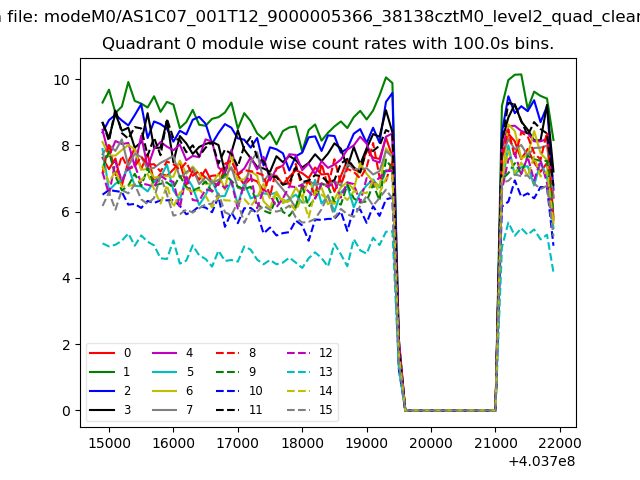 |
 |
| Module-wise count rates for Quadrant B Data is divided into 100 sec bins |
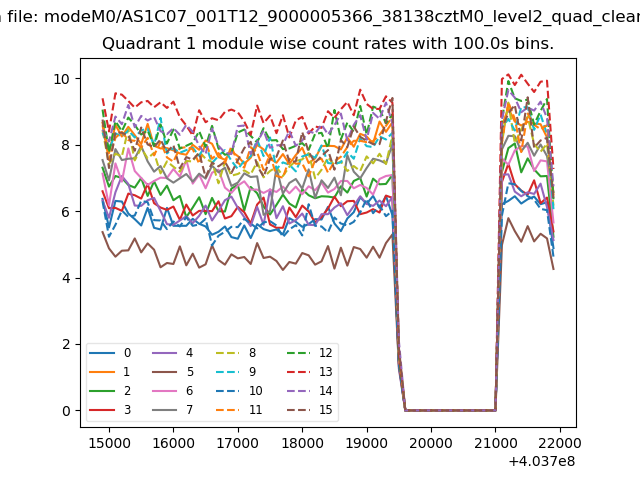 |
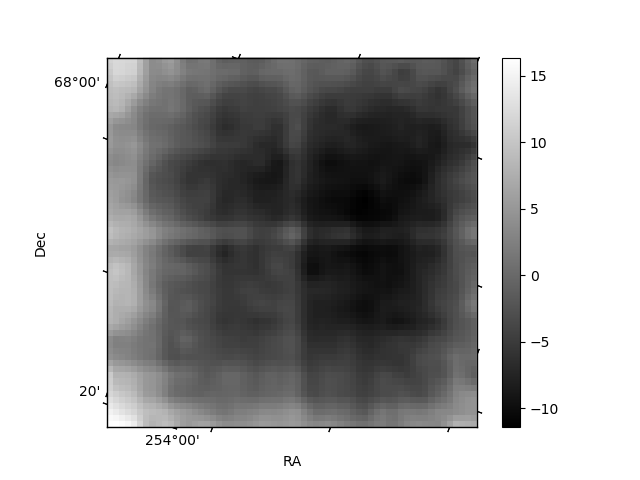 |
| Module-wise count rates for Quadrant C Data is divided into 100 sec bins |
 |
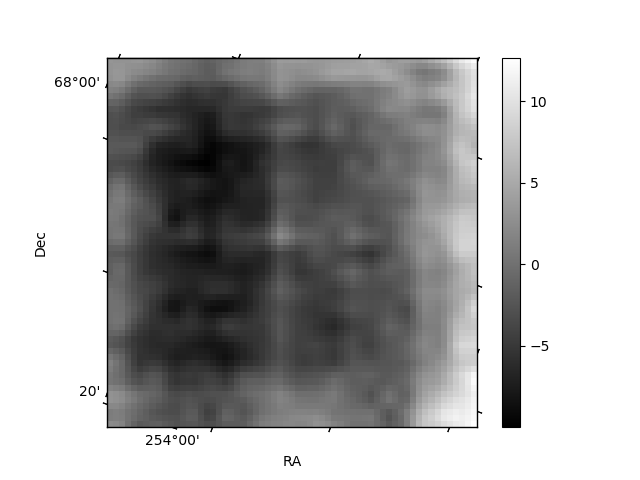 |
| Module-wise count rates for Quadrant D Data is divided into 100 sec bins |
 |
 |
| Parameter | Plot |
|---|---|
| CZT HV Monitor |  |
| D_VDD | 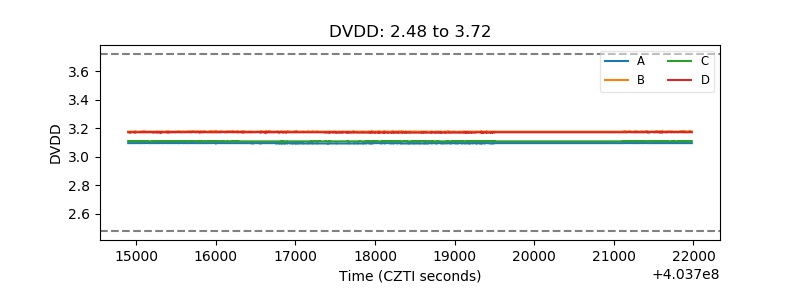 |
| Temperature 1 | 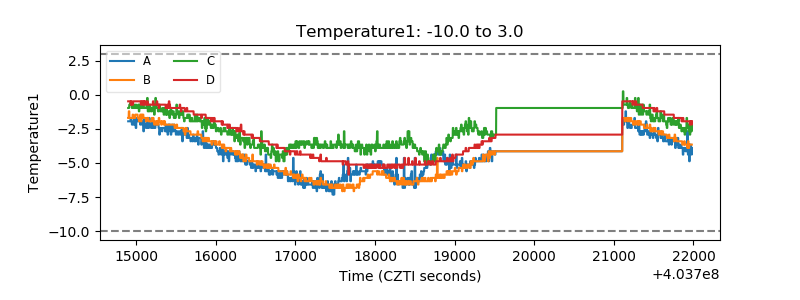 |
| Veto HV Monitor | 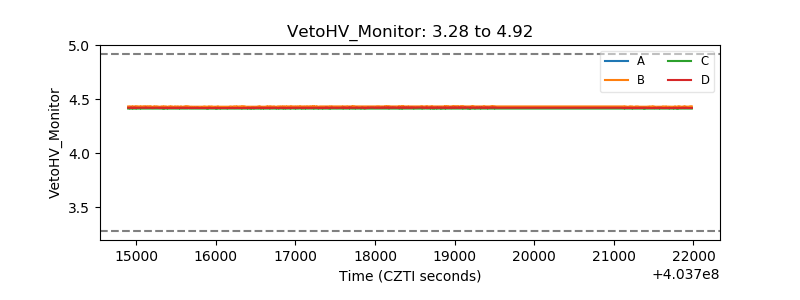 |
| Veto LLD | 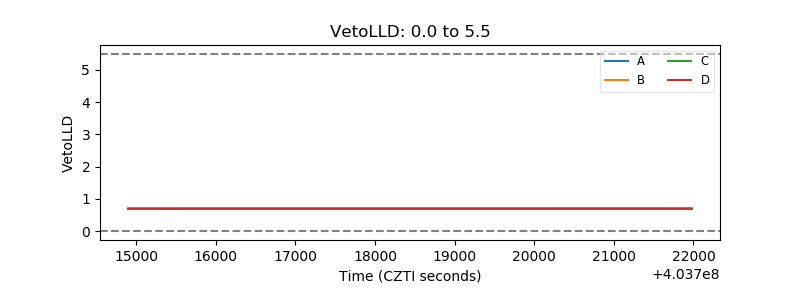 |
| Alpha Counter | 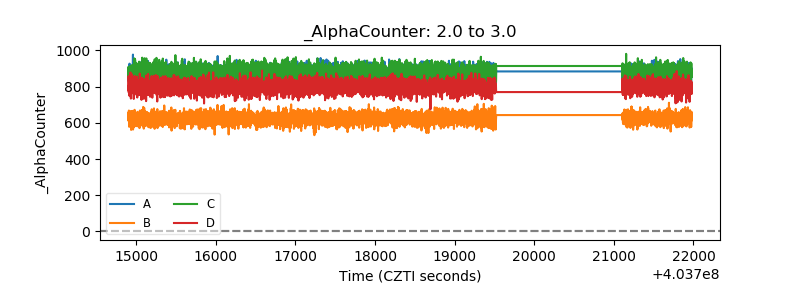 |
| _CPM_Rate | 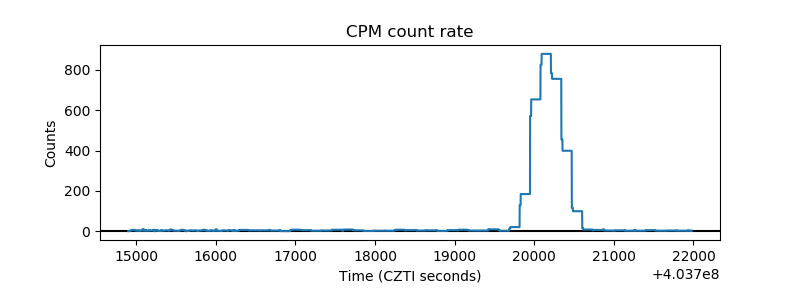 |
| CZT Counter | 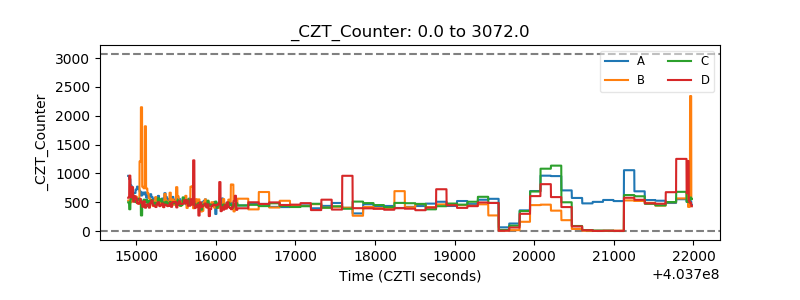 |
| +2.5 Volts monitor | 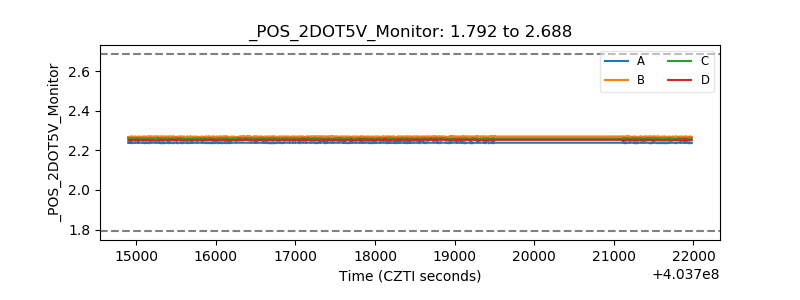 |
| +5 Volts monitor | 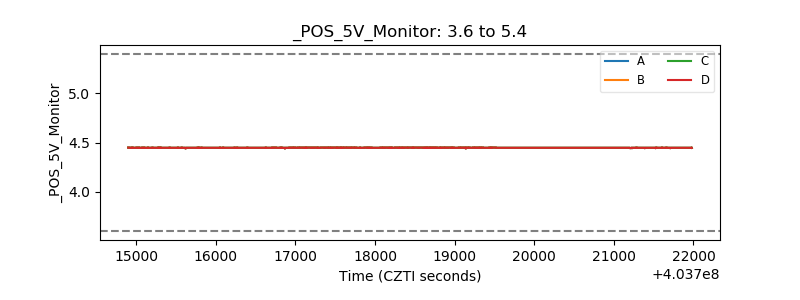 |
| _ROLL_ROT | 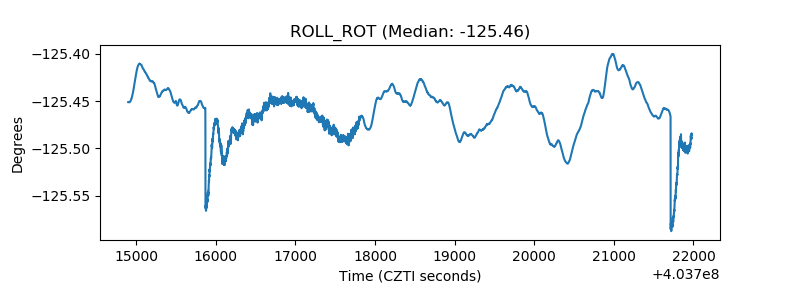 |
| _Roll_DEC | 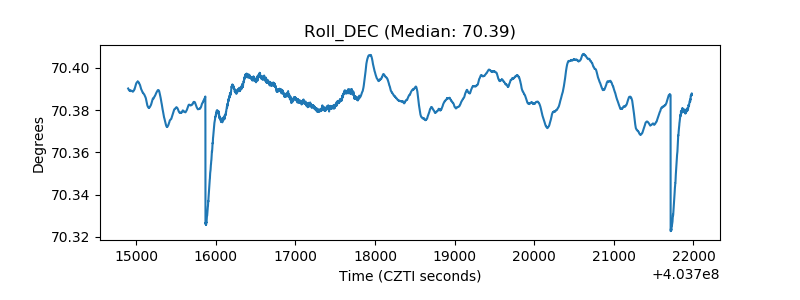 |
| _Roll_RA | 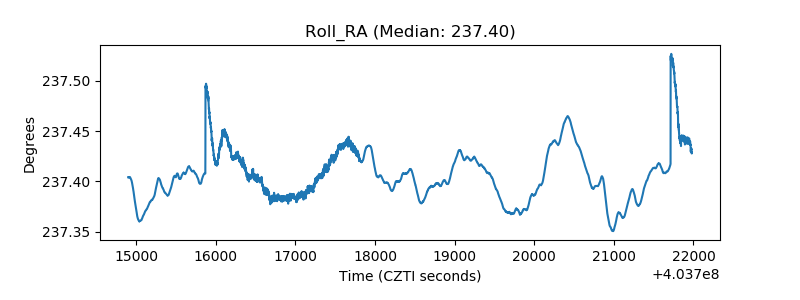 |
| Veto Counter | 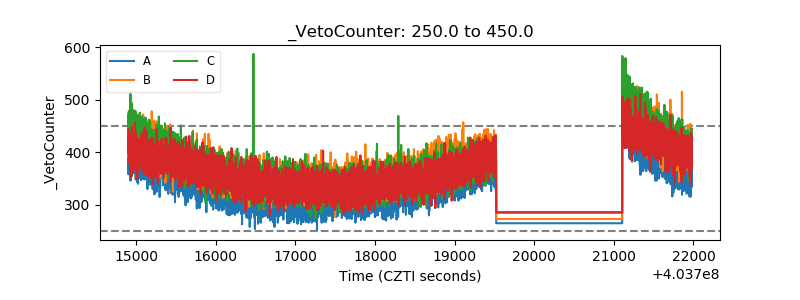 |