| Param | Original file | Final file |
|---|---|---|
| Filename | modeM0/AS1C07_001T12_9000005366_38140cztM0_level2.fits | modeM0/AS1C07_001T12_9000005366_38140cztM0_level2_quad_clean.evt |
| Size (bytes) | 304,476,480 | 91,632,960 |
| Size | 290.4 MB | 87.4 MB |
| Events in quadrant A | 2,752,604 | 620,686 |
| Events in quadrant B | 2,604,628 | 628,657 |
| Events in quadrant C | 2,575,910 | 603,433 |
| Events in quadrant D | 2,925,574 | 551,184 |
| Mode M0 | |||
|---|---|---|---|
| Quadrant | BADHDUFLAG | Total packets | Discarded packets |
| A | 0 | 11554 | 3 |
| B | 0 | 11362 | 2 |
| C | 0 | 10981 | 2 |
| D | 0 | 12440 | 2 |
| Mode M9 | |||
|---|---|---|---|
| Quadrant | BADHDUFLAG | Total packets | Discarded packets |
| A | 0 | 26 | 0 |
| B | 0 | 26 | 0 |
| C | 0 | 26 | 0 |
| D | 0 | 27 | 0 |
| Mode SS | |||
|---|---|---|---|
| Quadrant | BADHDUFLAG | Total packets | Discarded packets |
| A | 0 | 110 | 0 |
| B | 0 | 110 | 0 |
| C | 0 | 110 | 0 |
| D | 0 | 110 | 0 |
| Quadrant | Total seconds | Saturated seconds | Saturation percentage |
|---|---|---|---|
| A | 5283 | 17 | 0.321787% |
| B | 5283 | 38 | 0.719288% |
| C | 5283 | 11 | 0.208215% |
| D | 5283 | 88 | 1.665720% |
Noise dominated data is calculated using 1-second bins in cleaned event files. If a bin has >2000 counts, and if more than 50% of those come from <1% of pixels, then it is considered to be noise-dominated and hence unusable.
| Quadrant | # 1 sec bins | Bins with >0 counts | Bins with >2000 counts | High rate bins dominated by noise | Noise dominated (total time) | Noise dominated (detector-on time) | Marked lightcurve |
|---|---|---|---|---|---|---|---|
| A | 7016 | 5284 | 8 | 8 | 0.11% | 0.15% | 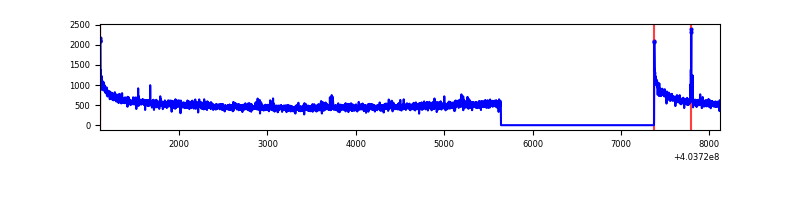 |
| B | 7016 | 5284 | 25 | 25 | 0.36% | 0.47% | 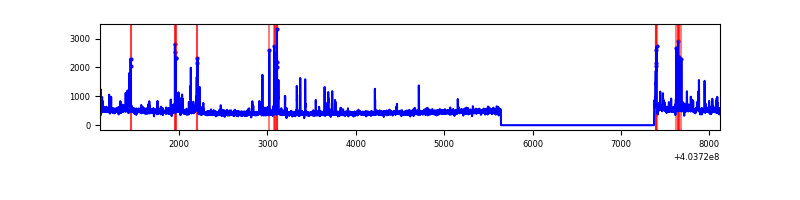 |
| C | 7016 | 5284 | 9 | 9 | 0.13% | 0.17% | 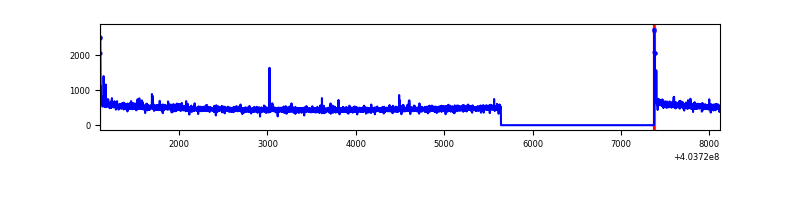 |
| D | 7016 | 5284 | 74 | 74 | 1.05% | 1.40% | 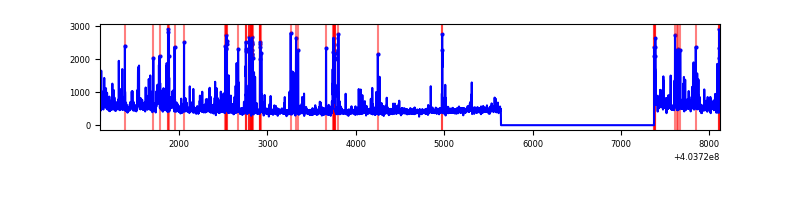 |
Top three noisy pixels from each quadrant. If the there are fewer than three noisy pixels in the level2.evt file, extra rows are filled as -1
| Pixel properties | Quadrant properties | ||||||
|---|---|---|---|---|---|---|---|
| Quadrant | DetID | PixID | Counts | Sigma | Mean | Median | Sigma |
| A | 10 | 83 | 381049 | 3222.2 | 592 | 582 | 118.1 |
| A | 12 | 189 | 39920 | 333.16 | 592 | 582 | 118.1 |
| A | 15 | 223 | 19648 | 161.47 | 592 | 582 | 118.1 |
| B | 0 | 229 | 96650 | 850.2 | 592 | 576 | 113.0 |
| B | 4 | 171 | 73007 | 640.97 | 592 | 576 | 113.0 |
| B | 15 | 35 | 34203 | 297.58 | 592 | 576 | 113.0 |
| C | 15 | 214 | 220649 | 1597.8 | 584 | 587 | 137.7 |
| C | 0 | 10 | 31125 | 221.73 | 584 | 587 | 137.7 |
| C | 3 | 233 | 20425 | 144.04 | 584 | 587 | 137.7 |
| D | 10 | 199 | 211507 | 1494.21 | 578 | 560 | 141.2 |
| D | 13 | 249 | 119291 | 841.01 | 578 | 560 | 141.2 |
| D | 12 | 233 | 103291 | 727.68 | 578 | 560 | 141.2 |
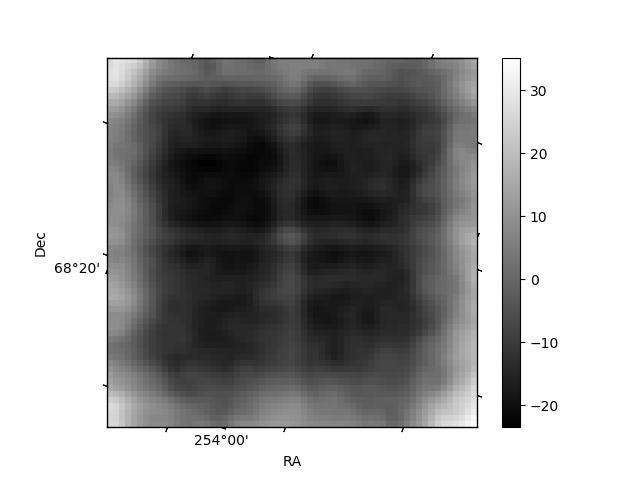
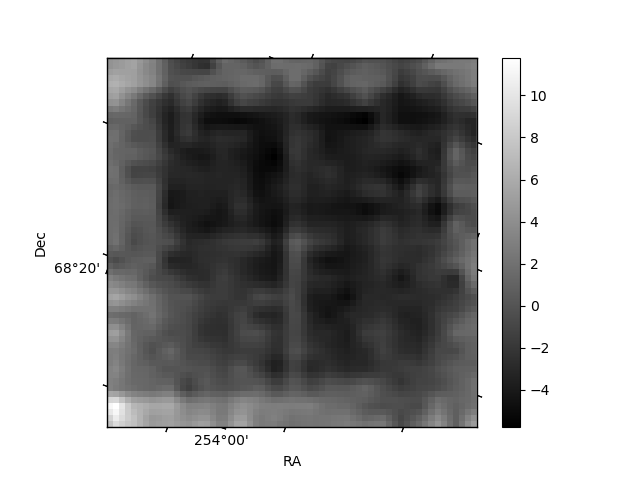
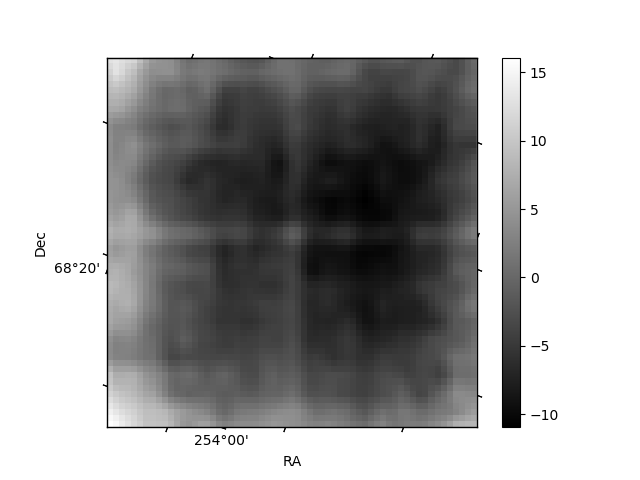
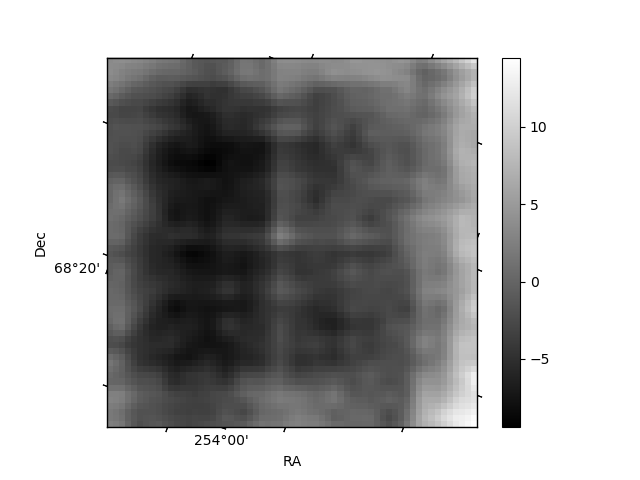
Histogram calculated using DETX and DETY for each event in the final _common_clean file
| Quadrant A | 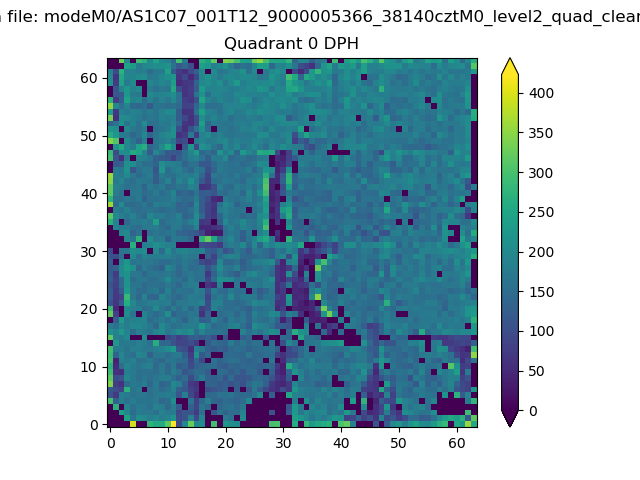 |
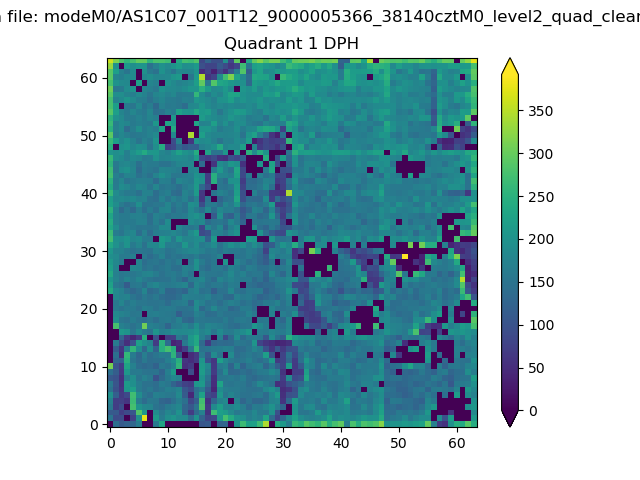 |
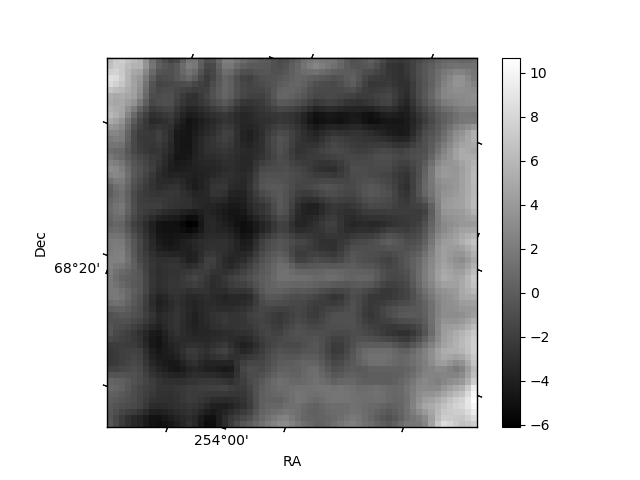
Quadrant B |
|---|---|---|---|
| Quadrant D | 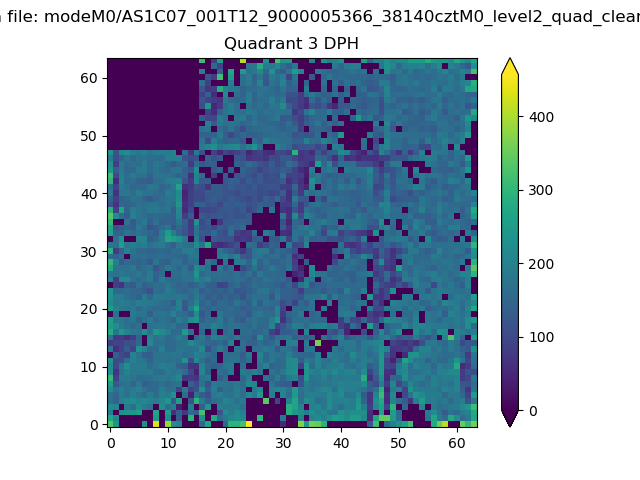 |
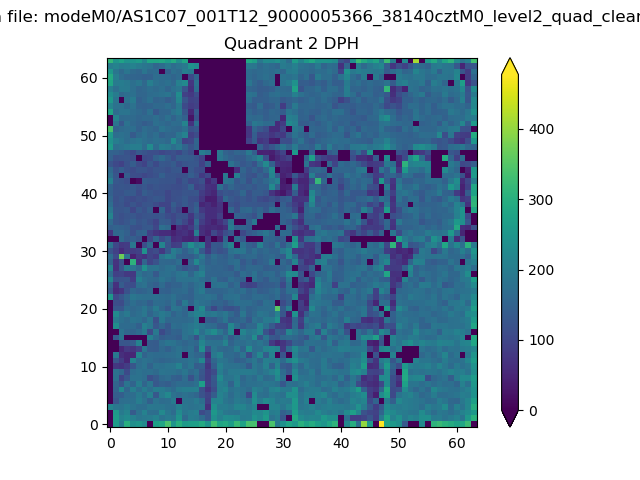 |
Quadrant C |
| Plot type | Count rate plots | Images |
|---|---|---|
| Comparison with Poisson distribution Blue bars denote a histogram of data divided into 1 sec bins. Red curve is a Poisson curve with rate = median count rate of data. |
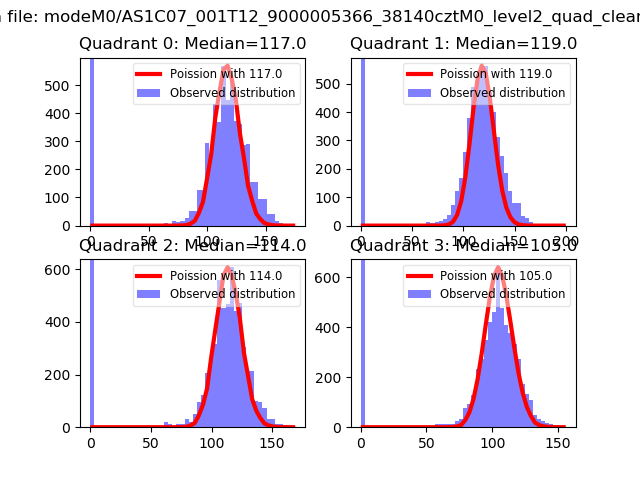 |
 |
| Quadrant-wise count rates Data is divided into 100 sec bins |
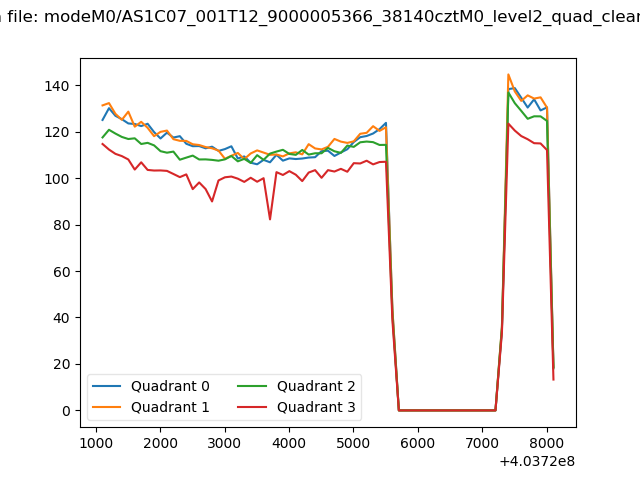 |
|
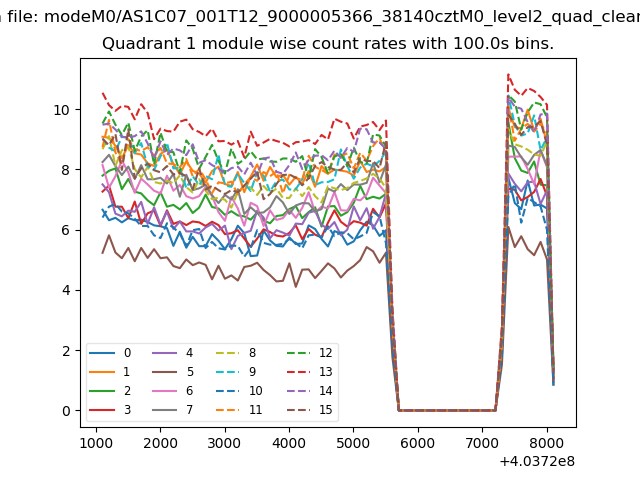
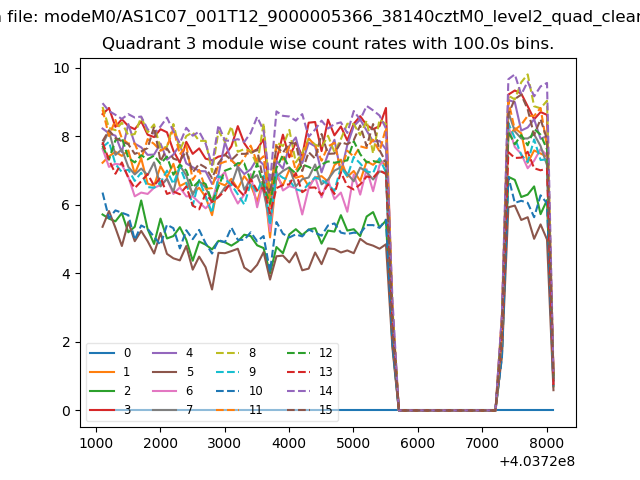
| Module-wise count rates for Quadrant A Data is divided into 100 sec bins |
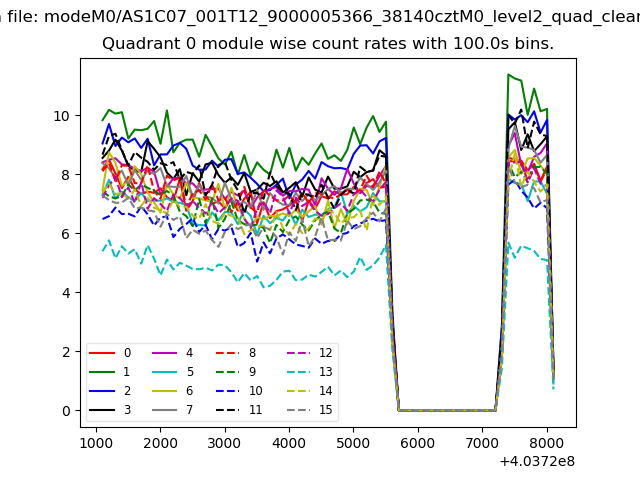 |
 |
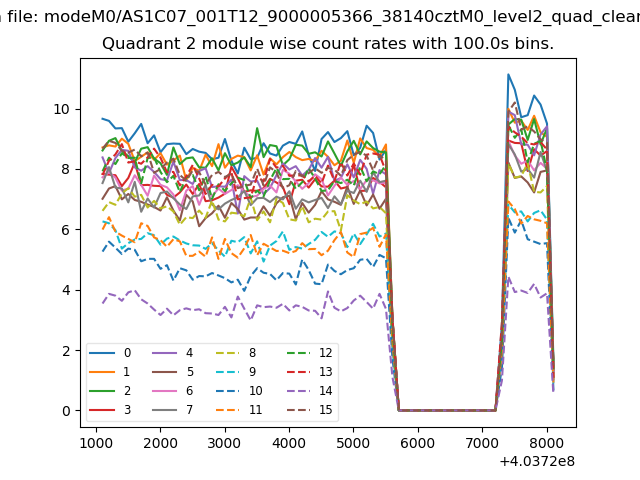
| Module-wise count rates for Quadrant B Data is divided into 100 sec bins |
 |
 |
| Module-wise count rates for Quadrant C Data is divided into 100 sec bins |
 |
 |
| Module-wise count rates for Quadrant D Data is divided into 100 sec bins |
 |
 |
| Parameter | Plot |
|---|---|
| CZT HV Monitor | 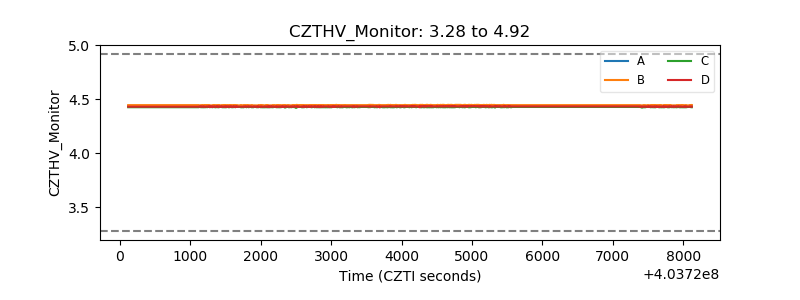 |
| D_VDD | 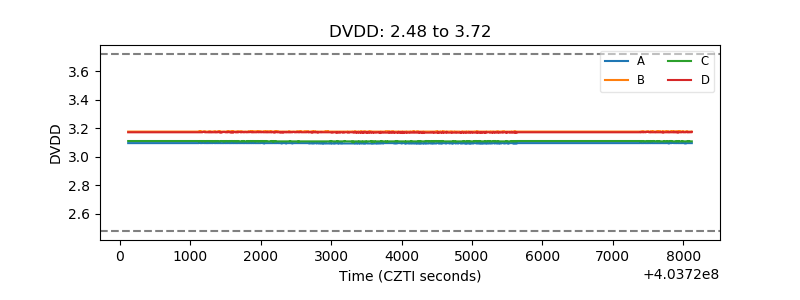 |
| Temperature 1 | 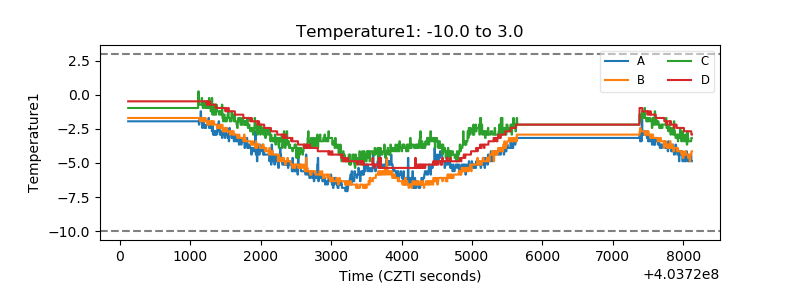 |
| Veto HV Monitor | 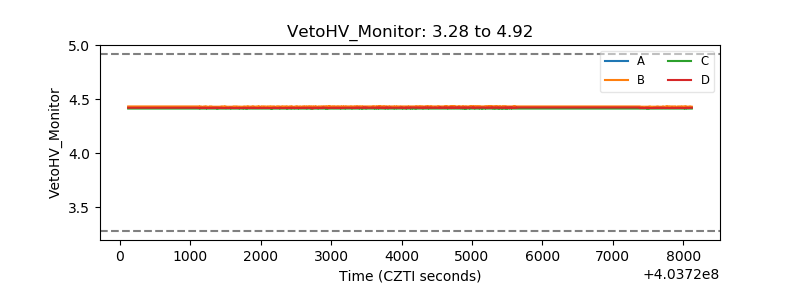 |
| Veto LLD | 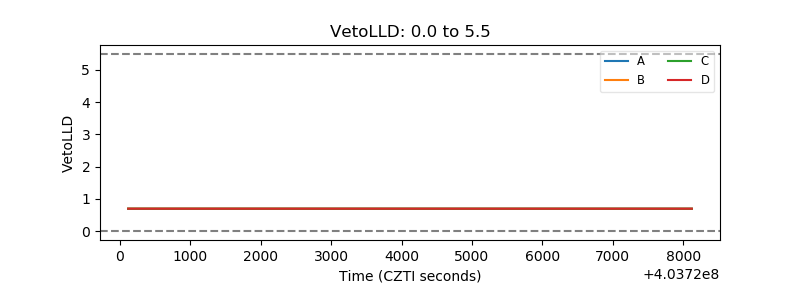 |
| Alpha Counter | 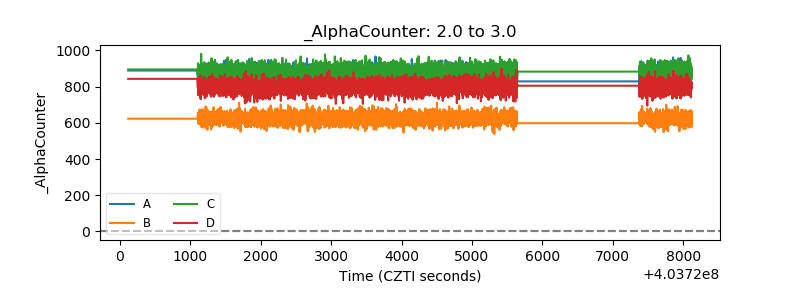 |
| _CPM_Rate | 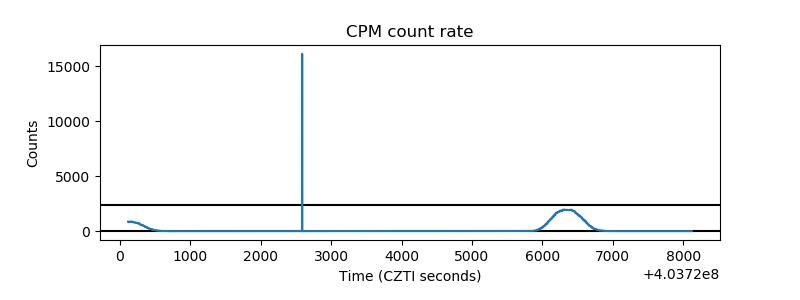 |
| CZT Counter | 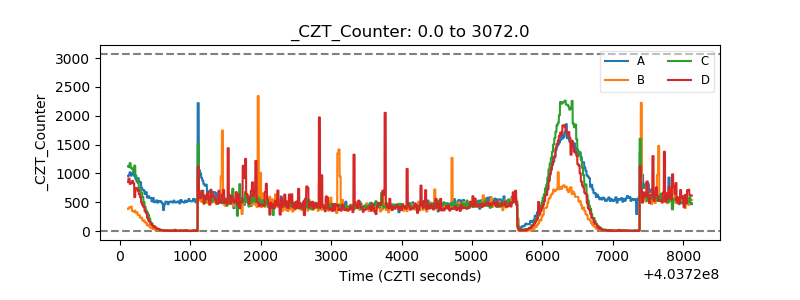 |
| +2.5 Volts monitor | 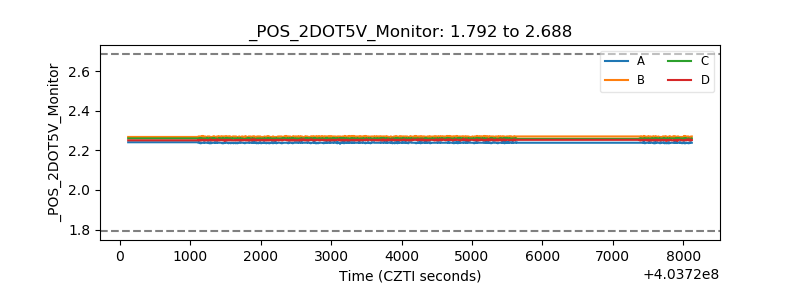 |
| +5 Volts monitor | 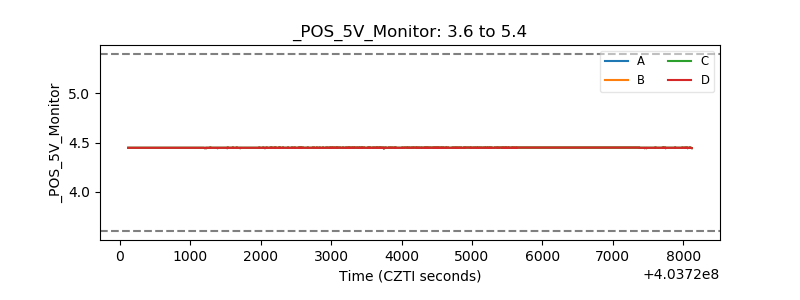 |
| _ROLL_ROT | 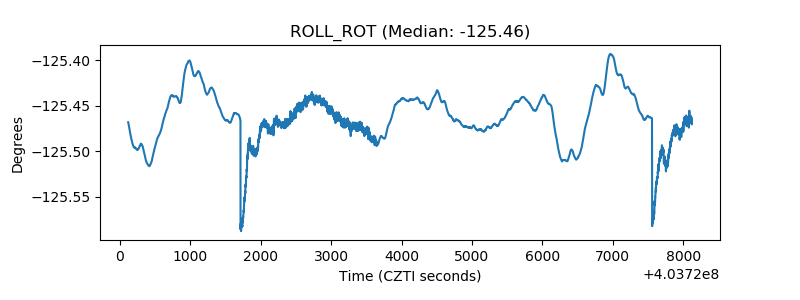 |
| _Roll_DEC | 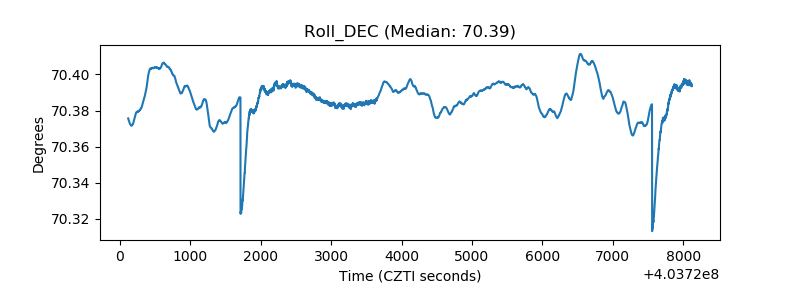 |
| _Roll_RA | 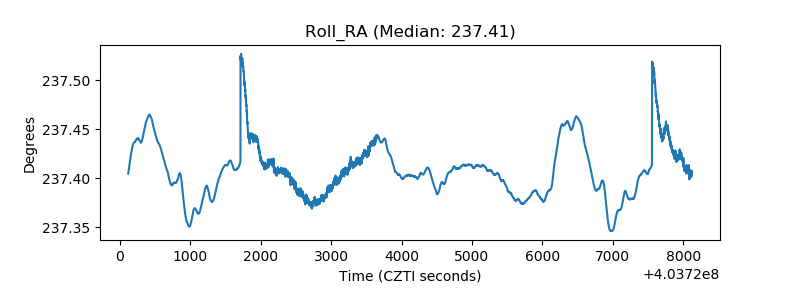 |
| Veto Counter | 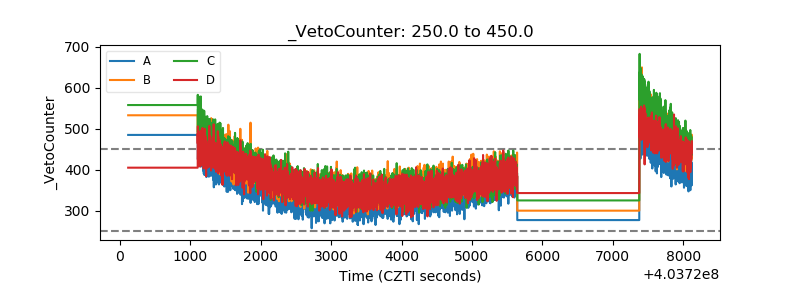 |