| Param | Original file | Final file |
|---|---|---|
| Filename | modeM0/AS1C07_001T12_9000005366_38141cztM0_level2.fits | modeM0/AS1C07_001T12_9000005366_38141cztM0_level2_quad_clean.evt |
| Size (bytes) | 309,147,840 | 95,382,720 |
| Size | 294.8 MB | 91.0 MB |
| Events in quadrant A | 2,756,458 | 644,790 |
| Events in quadrant B | 2,618,276 | 659,929 |
| Events in quadrant C | 2,626,963 | 636,282 |
| Events in quadrant D | 3,031,677 | 578,909 |
| Mode M0 | |||
|---|---|---|---|
| Quadrant | BADHDUFLAG | Total packets | Discarded packets |
| A | 0 | 11547 | 3 |
| B | 0 | 11344 | 2 |
| C | 0 | 11073 | 2 |
| D | 0 | 12791 | 2 |
| Mode M9 | |||
|---|---|---|---|
| Quadrant | BADHDUFLAG | Total packets | Discarded packets |
| A | 0 | 29 | 0 |
| B | 0 | 29 | 0 |
| C | 0 | 29 | 0 |
| D | 0 | 30 | 0 |
| Mode SS | |||
|---|---|---|---|
| Quadrant | BADHDUFLAG | Total packets | Discarded packets |
| A | 0 | 106 | 0 |
| B | 0 | 106 | 0 |
| C | 0 | 106 | 0 |
| D | 0 | 106 | 0 |
| Quadrant | Total seconds | Saturated seconds | Saturation percentage |
|---|---|---|---|
| A | 5265 | 19 | 0.360874% |
| B | 5265 | 36 | 0.683761% |
| C | 5265 | 12 | 0.227920% |
| D | 5265 | 58 | 1.101614% |
Noise dominated data is calculated using 1-second bins in cleaned event files. If a bin has >2000 counts, and if more than 50% of those come from <1% of pixels, then it is considered to be noise-dominated and hence unusable.
| Quadrant | # 1 sec bins | Bins with >0 counts | Bins with >2000 counts | High rate bins dominated by noise | Noise dominated (total time) | Noise dominated (detector-on time) | Marked lightcurve |
|---|---|---|---|---|---|---|---|
| A | 7118 | 5266 | 8 | 8 | 0.11% | 0.15% | 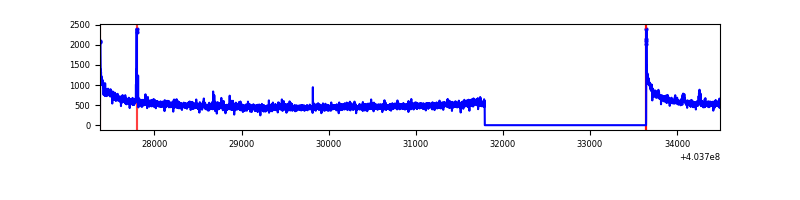 |
| B | 7118 | 5266 | 22 | 22 | 0.31% | 0.42% | 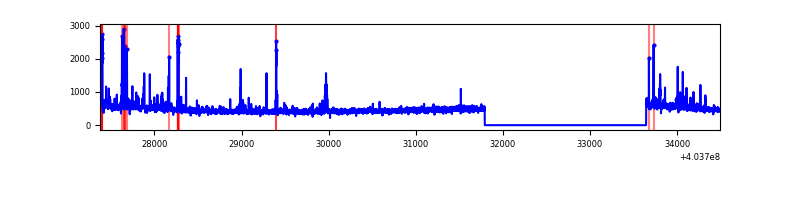 |
| C | 7118 | 5266 | 12 | 12 | 0.17% | 0.23% | 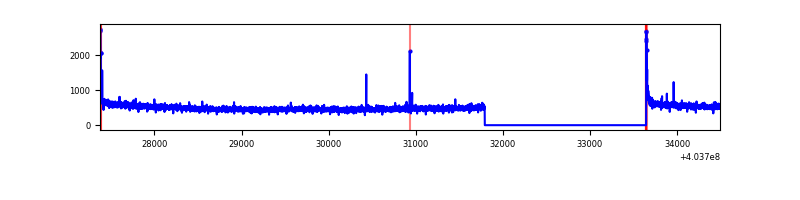 |
| D | 7118 | 5265 | 55 | 55 | 0.77% | 1.04% | 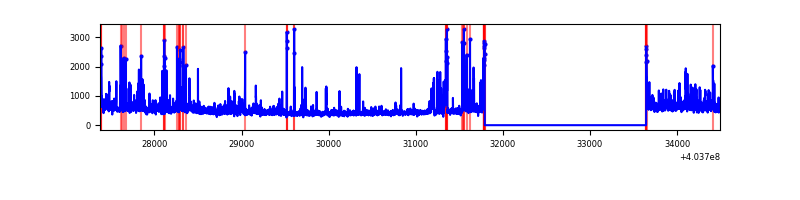 |
Top three noisy pixels from each quadrant. If the there are fewer than three noisy pixels in the level2.evt file, extra rows are filled as -1
| Pixel properties | Quadrant properties | ||||||
|---|---|---|---|---|---|---|---|
| Quadrant | DetID | PixID | Counts | Sigma | Mean | Median | Sigma |
| A | 10 | 83 | 367678 | 3048.17 | 597 | 585 | 120.4 |
| A | 12 | 189 | 41314 | 338.19 | 597 | 585 | 120.4 |
| A | 15 | 223 | 16856 | 135.11 | 597 | 585 | 120.4 |
| B | 0 | 229 | 137053 | 1199.93 | 601 | 585 | 113.7 |
| B | 4 | 171 | 60578 | 527.5 | 601 | 585 | 113.7 |
| B | 4 | 232 | 27159 | 233.66 | 601 | 585 | 113.7 |
| C | 15 | 214 | 220316 | 1590.76 | 595 | 600 | 138.1 |
| C | 0 | 10 | 40975 | 292.32 | 595 | 600 | 138.1 |
| C | 3 | 233 | 29956 | 212.54 | 595 | 600 | 138.1 |
| D | 12 | 227 | 185894 | 1307.05 | 587 | 571 | 141.8 |
| D | 10 | 199 | 125247 | 879.32 | 587 | 571 | 141.8 |
| D | 1 | 52 | 104601 | 733.71 | 587 | 571 | 141.8 |
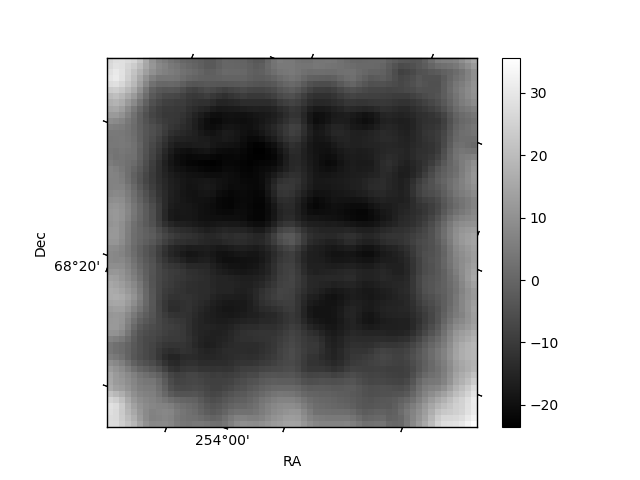
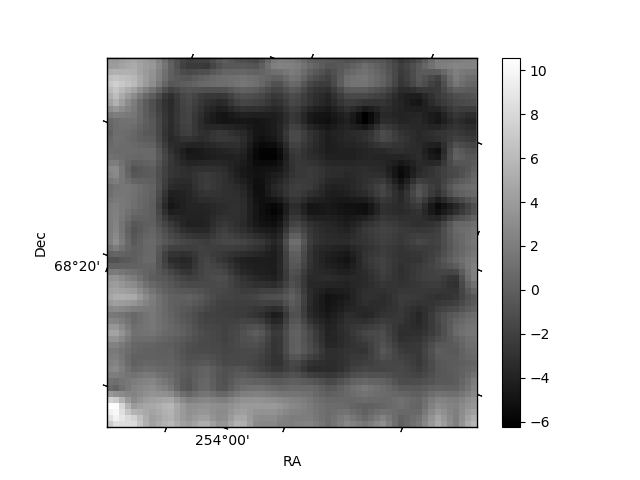
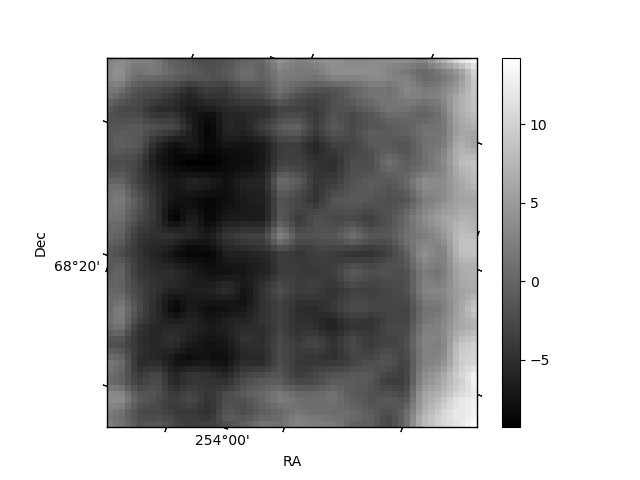
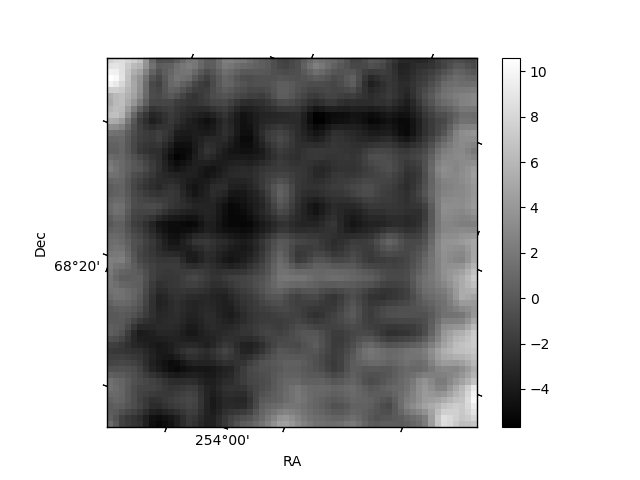
Histogram calculated using DETX and DETY for each event in the final _common_clean file
| Quadrant A | 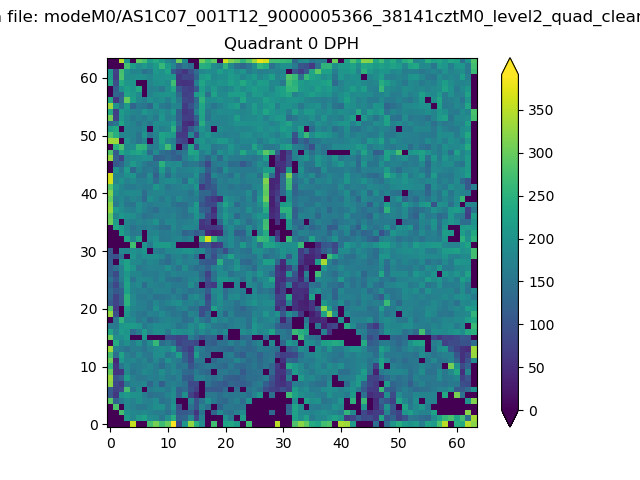 |
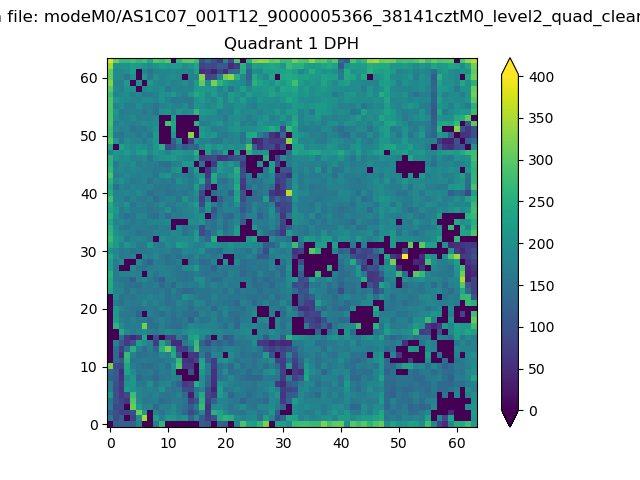 |
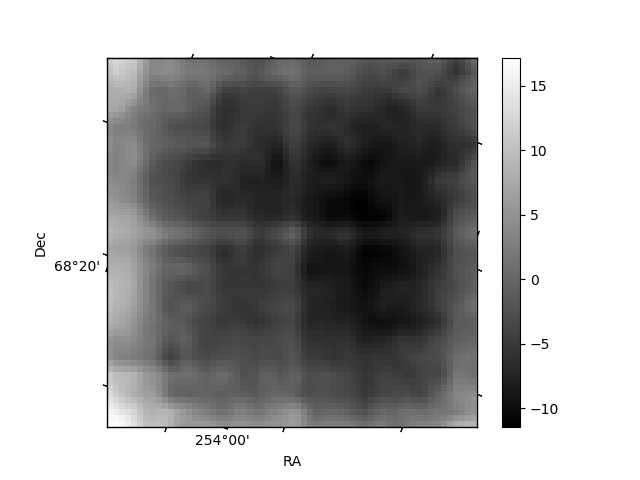
Quadrant B |
|---|---|---|---|
| Quadrant D | 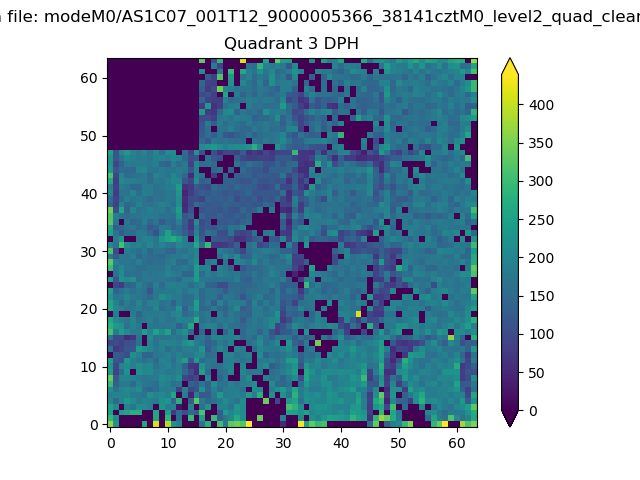 |
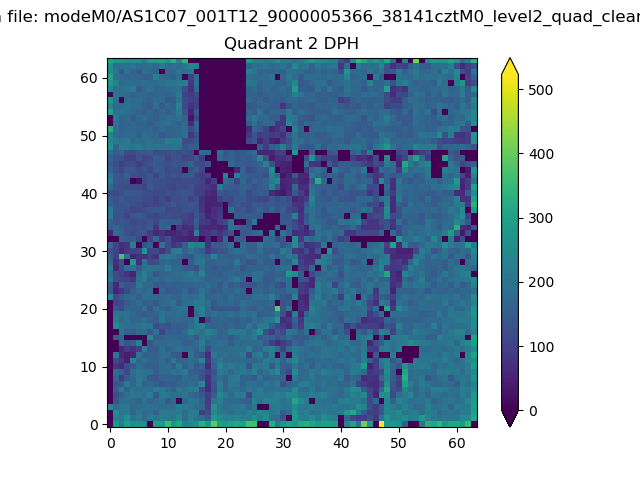 |
Quadrant C |
| Plot type | Count rate plots | Images |
|---|---|---|
| Comparison with Poisson distribution Blue bars denote a histogram of data divided into 1 sec bins. Red curve is a Poisson curve with rate = median count rate of data. |
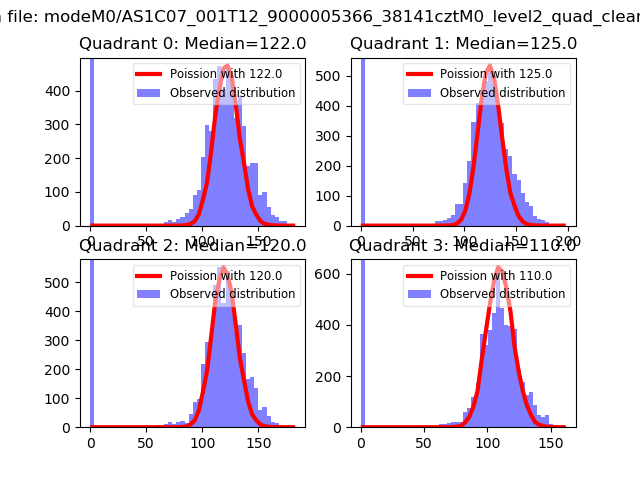 |
 |
| Quadrant-wise count rates Data is divided into 100 sec bins |
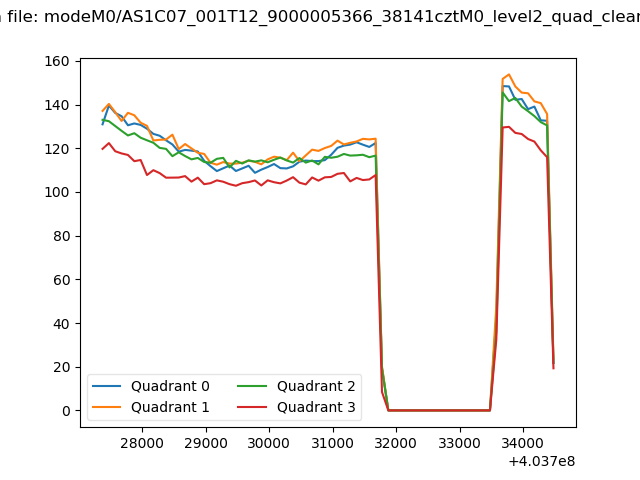 |
|
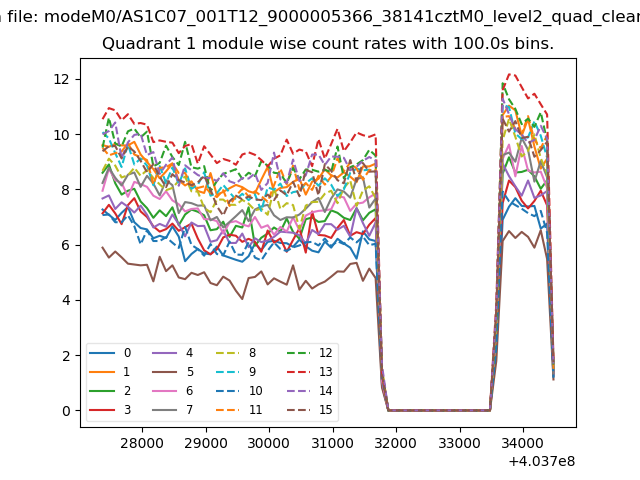
| Module-wise count rates for Quadrant A Data is divided into 100 sec bins |
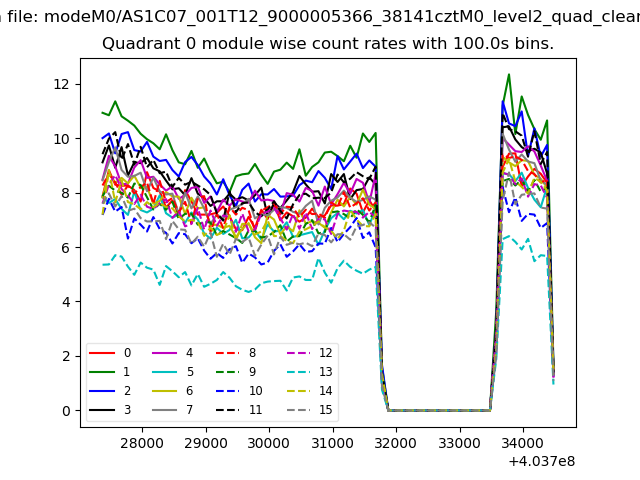 |
 |
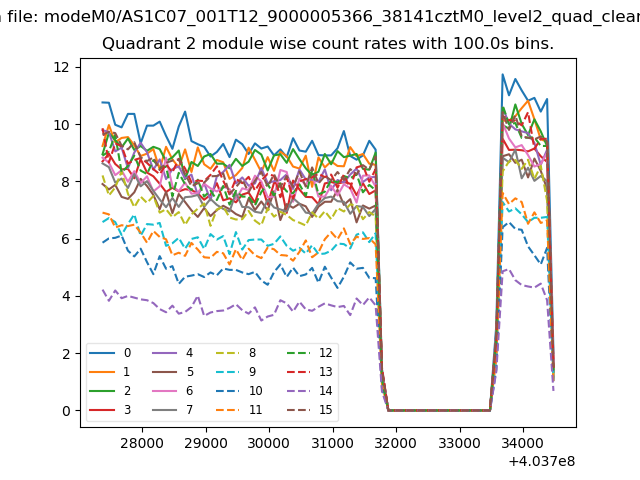
| Module-wise count rates for Quadrant B Data is divided into 100 sec bins |
 |
 |
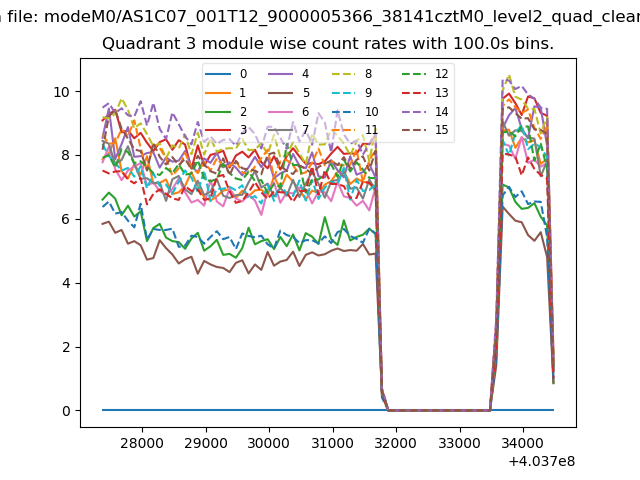
| Module-wise count rates for Quadrant C Data is divided into 100 sec bins |
 |
 |
| Module-wise count rates for Quadrant D Data is divided into 100 sec bins |
 |
 |
| Parameter | Plot |
|---|---|
| CZT HV Monitor | 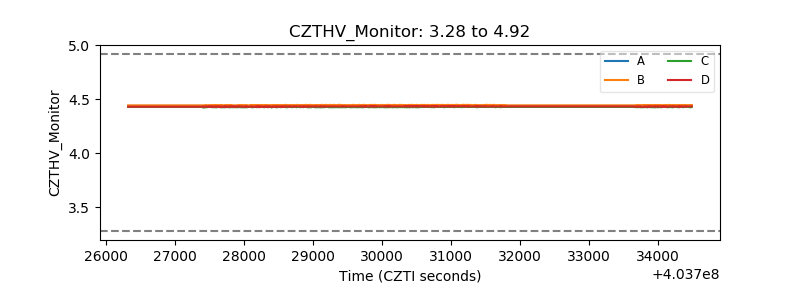 |
| D_VDD | 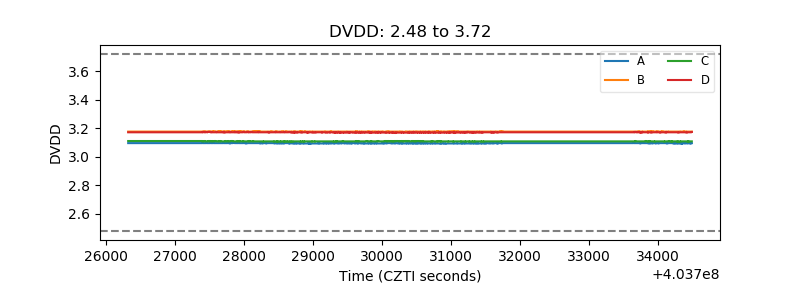 |
| Temperature 1 | 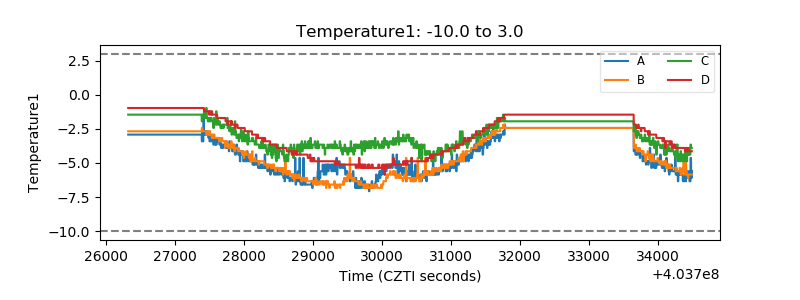 |
| Veto HV Monitor | 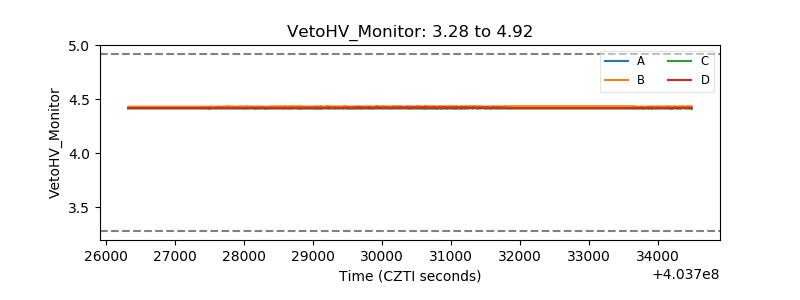 |
| Veto LLD | 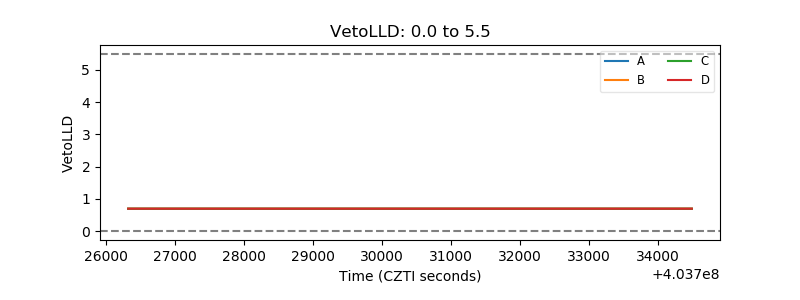 |
| Alpha Counter | 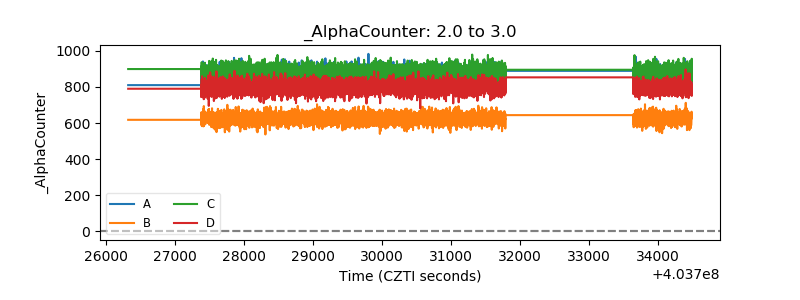 |
| _CPM_Rate | 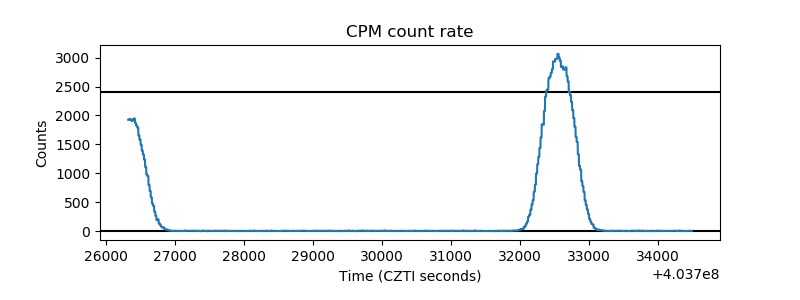 |
| CZT Counter | 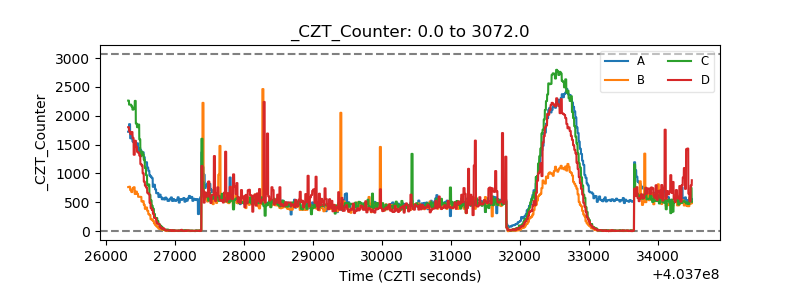 |
| +2.5 Volts monitor | 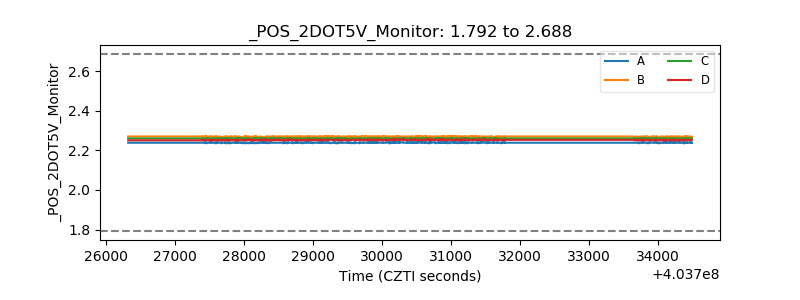 |
| +5 Volts monitor | 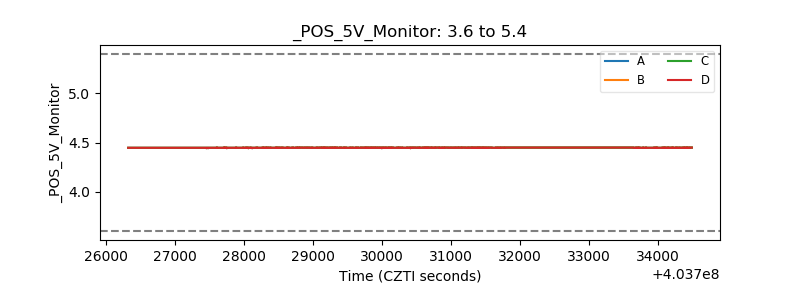 |
| _ROLL_ROT | 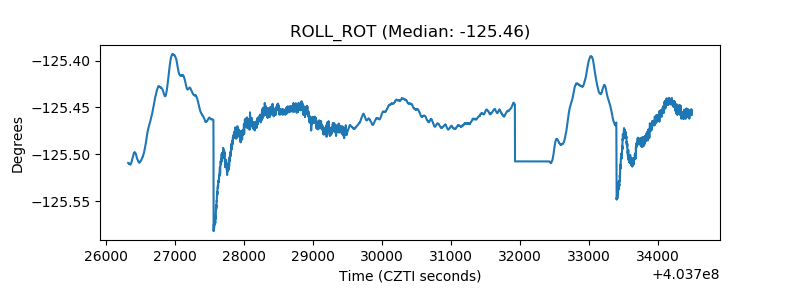 |
| _Roll_DEC | 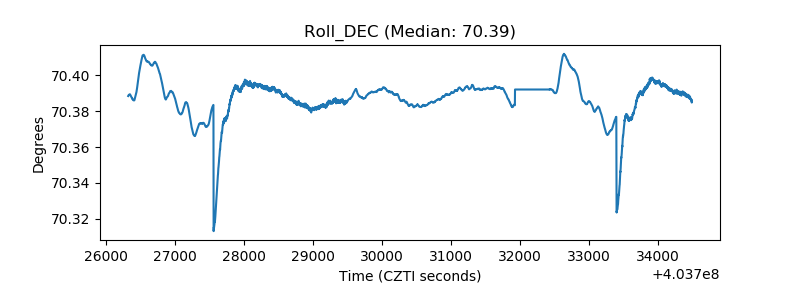 |
| _Roll_RA | 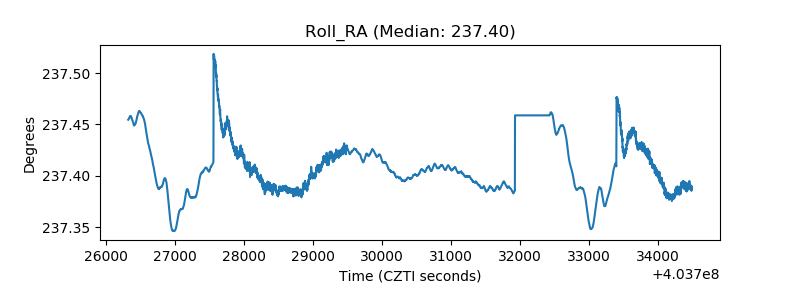 |
| Veto Counter | 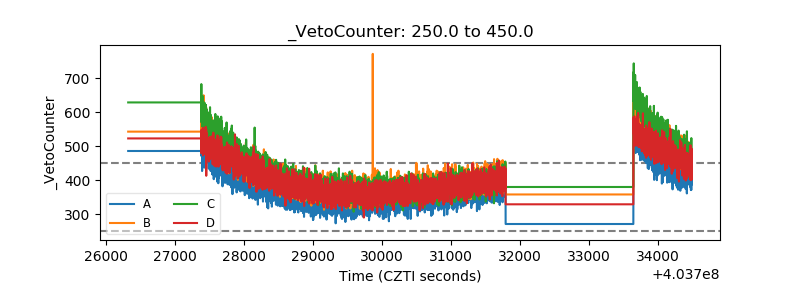 |