| Param | Original file | Final file |
|---|---|---|
| Filename | modeM0/AS1C07_001T12_9000005366_38142cztM0_level2.fits | modeM0/AS1C07_001T12_9000005366_38142cztM0_level2_quad_clean.evt |
| Size (bytes) | 315,247,680 | 96,514,560 |
| Size | 300.6 MB | 92.0 MB |
| Events in quadrant A | 2,862,561 | 651,836 |
| Events in quadrant B | 2,554,119 | 676,474 |
| Events in quadrant C | 2,749,944 | 648,811 |
| Events in quadrant D | 3,101,810 | 584,666 |
| Mode M0 | |||
|---|---|---|---|
| Quadrant | BADHDUFLAG | Total packets | Discarded packets |
| A | 0 | 11674 | 3 |
| B | 0 | 10938 | 2 |
| C | 0 | 11307 | 2 |
| D | 0 | 12733 | 2 |
| Mode M9 | |||
|---|---|---|---|
| Quadrant | BADHDUFLAG | Total packets | Discarded packets |
| A | 0 | 30 | 0 |
| B | 0 | 30 | 0 |
| C | 0 | 30 | 0 |
| D | 0 | 31 | 0 |
| Mode SS | |||
|---|---|---|---|
| Quadrant | BADHDUFLAG | Total packets | Discarded packets |
| A | 0 | 106 | 0 |
| B | 0 | 106 | 0 |
| C | 0 | 106 | 0 |
| D | 0 | 106 | 0 |
| Quadrant | Total seconds | Saturated seconds | Saturation percentage |
|---|---|---|---|
| A | 5148 | 27 | 0.524476% |
| B | 5148 | 21 | 0.407925% |
| C | 5148 | 24 | 0.466200% |
| D | 5148 | 71 | 1.379176% |
Noise dominated data is calculated using 1-second bins in cleaned event files. If a bin has >2000 counts, and if more than 50% of those come from <1% of pixels, then it is considered to be noise-dominated and hence unusable.
| Quadrant | # 1 sec bins | Bins with >0 counts | Bins with >2000 counts | High rate bins dominated by noise | Noise dominated (total time) | Noise dominated (detector-on time) | Marked lightcurve |
|---|---|---|---|---|---|---|---|
| A | 7120 | 5149 | 20 | 20 | 0.28% | 0.39% | 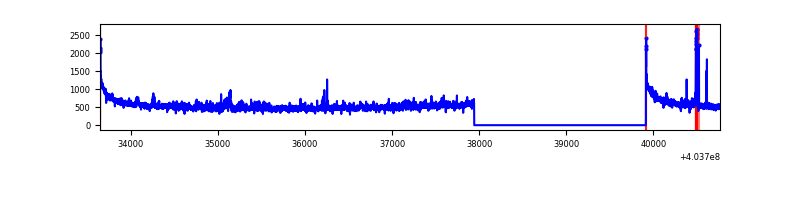 |
| B | 7120 | 5149 | 10 | 10 | 0.14% | 0.19% | 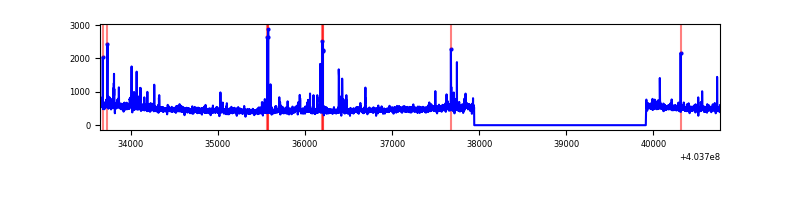 |
| C | 7120 | 5149 | 18 | 18 | 0.25% | 0.35% | 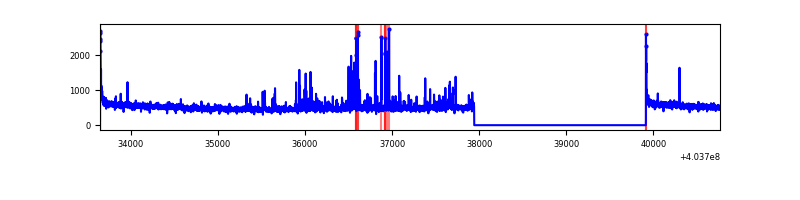 |
| D | 7120 | 5149 | 69 | 69 | 0.97% | 1.34% | 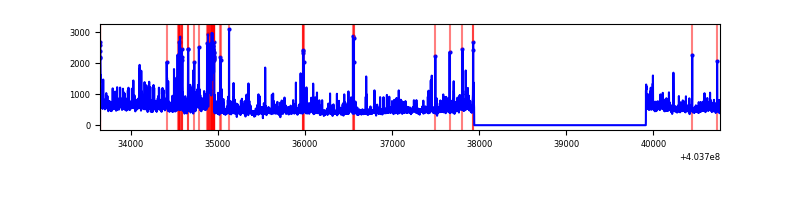 |
Top three noisy pixels from each quadrant. If the there are fewer than three noisy pixels in the level2.evt file, extra rows are filled as -1
| Pixel properties | Quadrant properties | ||||||
|---|---|---|---|---|---|---|---|
| Quadrant | DetID | PixID | Counts | Sigma | Mean | Median | Sigma |
| A | 10 | 83 | 358558 | 3003.79 | 594 | 584 | 119.2 |
| A | 12 | 16 | 91837 | 765.71 | 594 | 584 | 119.2 |
| A | 9 | 143 | 50642 | 420.04 | 594 | 584 | 119.2 |
| B | 4 | 171 | 71587 | 635.79 | 599 | 584 | 111.7 |
| B | 0 | 229 | 61748 | 547.69 | 599 | 584 | 111.7 |
| B | 5 | 172 | 38749 | 341.75 | 599 | 584 | 111.7 |
| C | 15 | 214 | 216241 | 1581.17 | 592 | 596 | 136.4 |
| C | 2 | 16 | 148725 | 1086.12 | 592 | 596 | 136.4 |
| C | 0 | 10 | 35595 | 256.62 | 592 | 596 | 136.4 |
| D | 1 | 52 | 301051 | 2163.53 | 579 | 563 | 138.9 |
| D | 7 | 38 | 196509 | 1410.82 | 579 | 563 | 138.9 |
| D | 13 | 249 | 113892 | 815.98 | 579 | 563 | 138.9 |
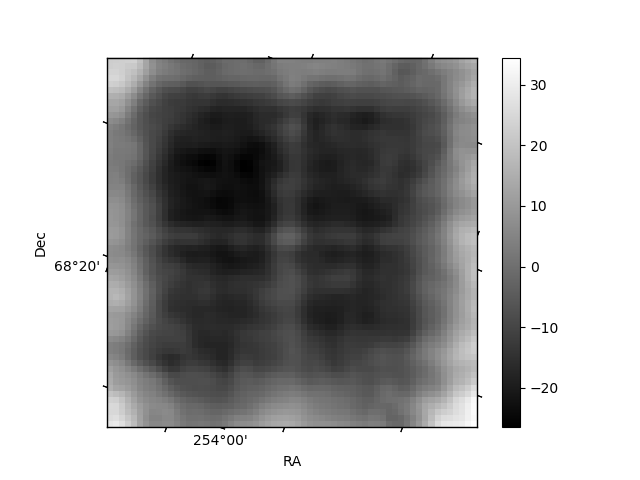
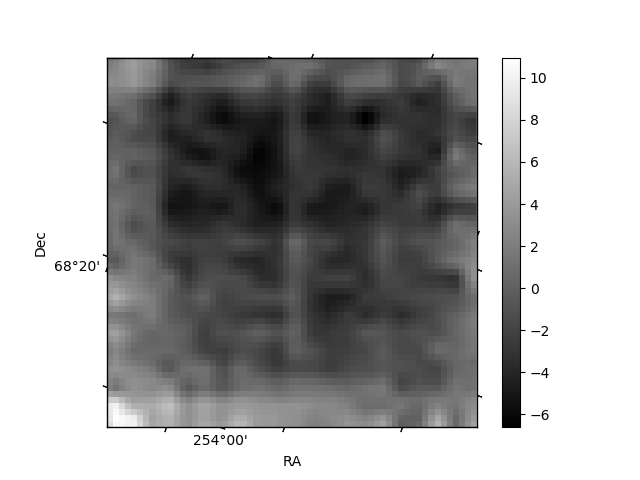
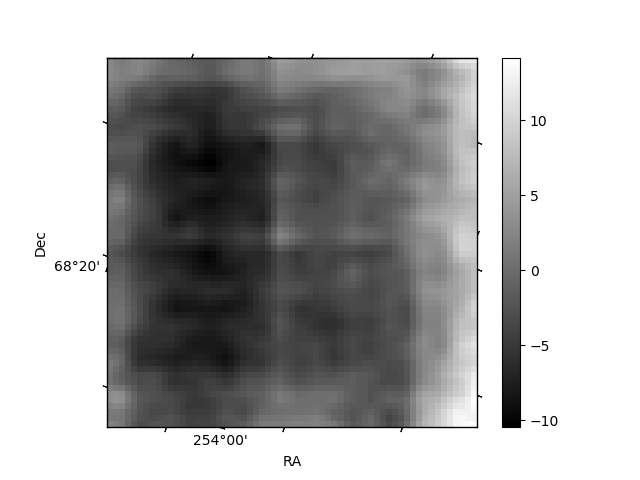
Histogram calculated using DETX and DETY for each event in the final _common_clean file
| Quadrant A | 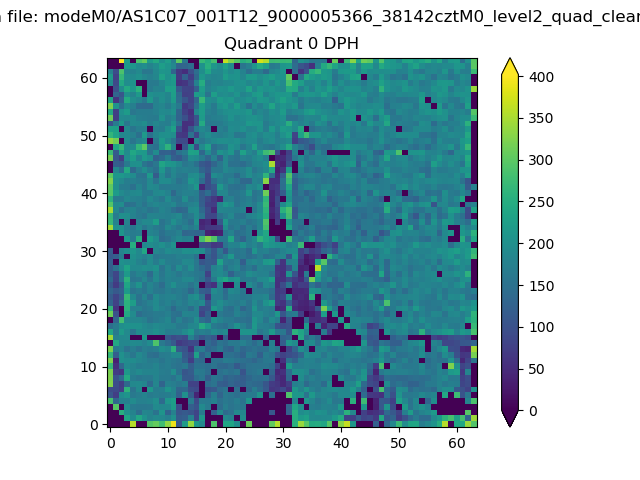 |
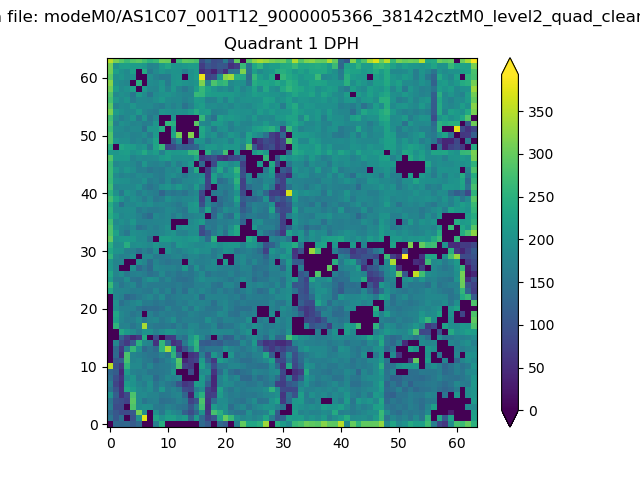 |
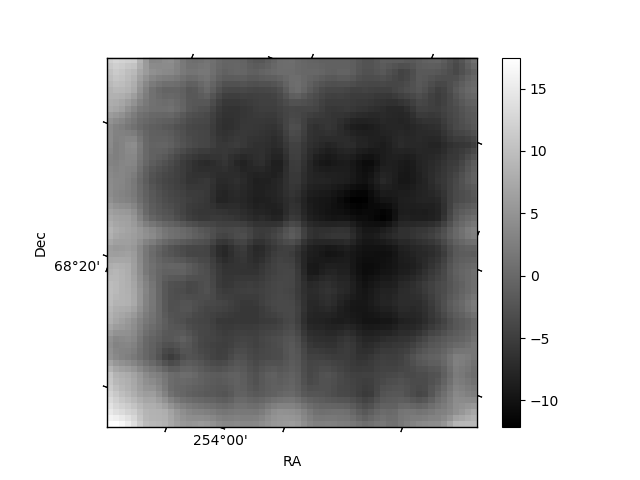
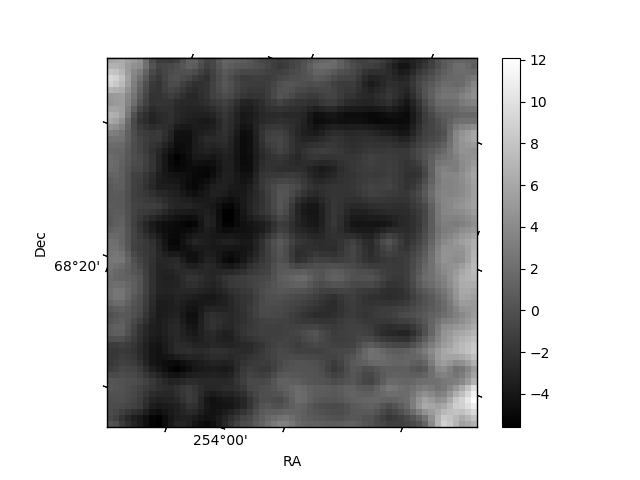
Quadrant B |
|---|---|---|---|
| Quadrant D | 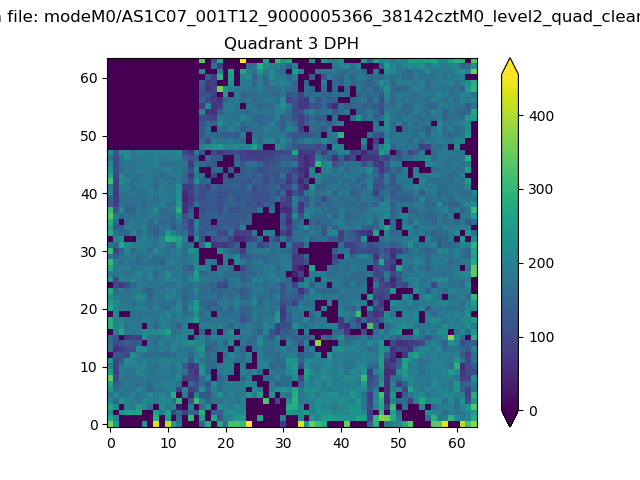 |
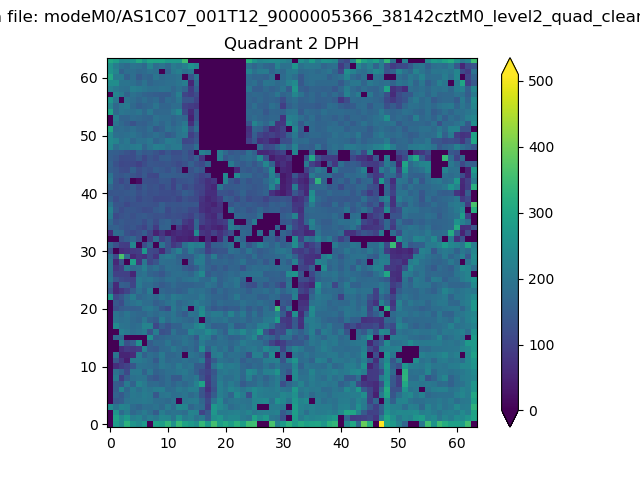 |
Quadrant C |
| Plot type | Count rate plots | Images |
|---|---|---|
| Comparison with Poisson distribution Blue bars denote a histogram of data divided into 1 sec bins. Red curve is a Poisson curve with rate = median count rate of data. |
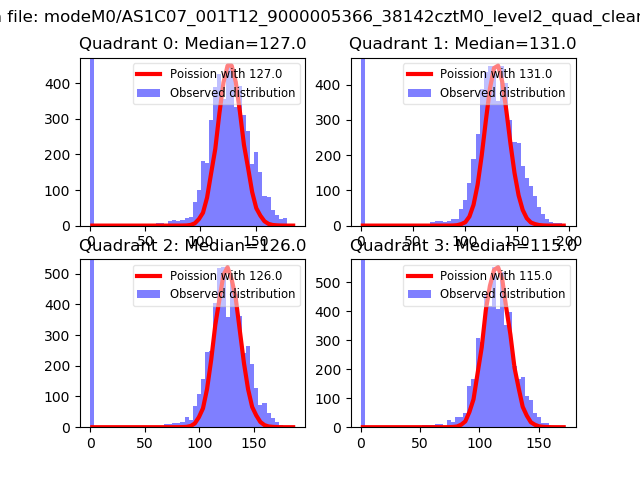 |
 |
| Quadrant-wise count rates Data is divided into 100 sec bins |
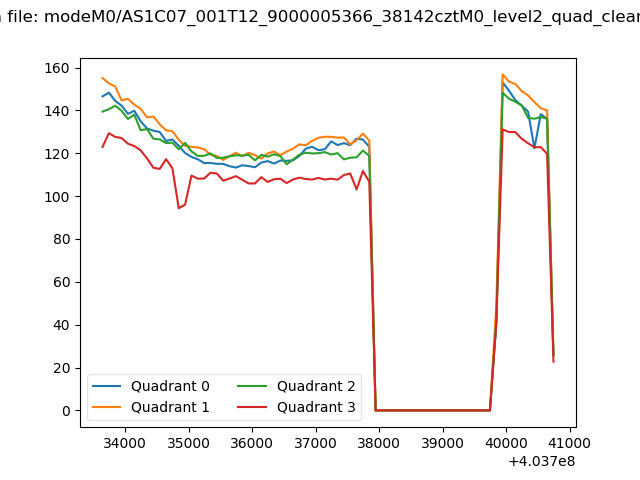 |
|
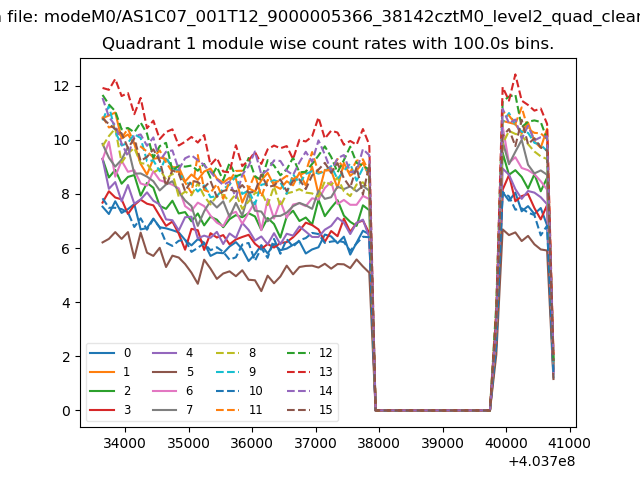
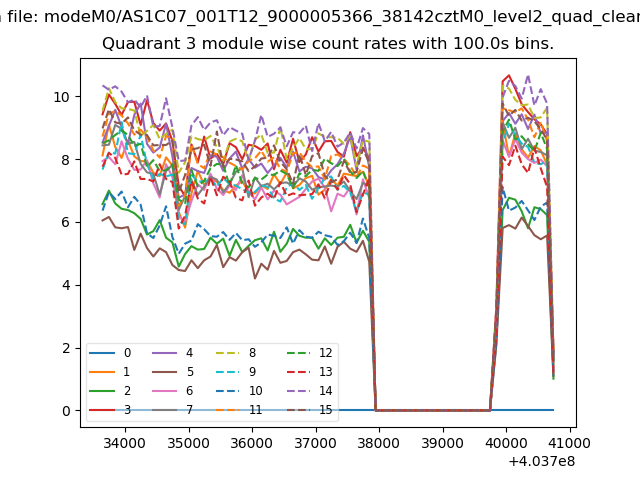
| Module-wise count rates for Quadrant A Data is divided into 100 sec bins |
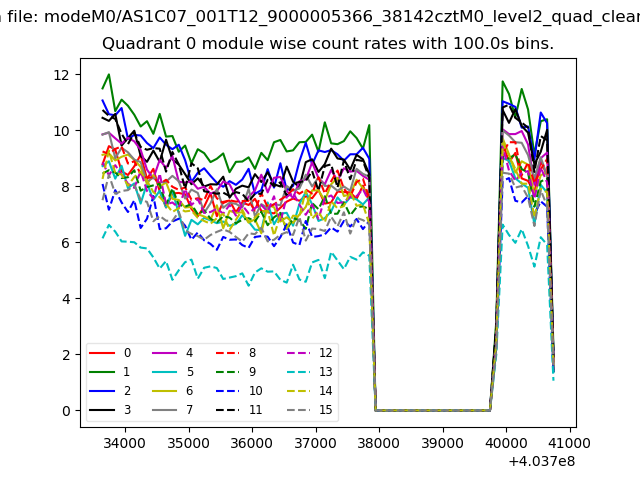 |
 |
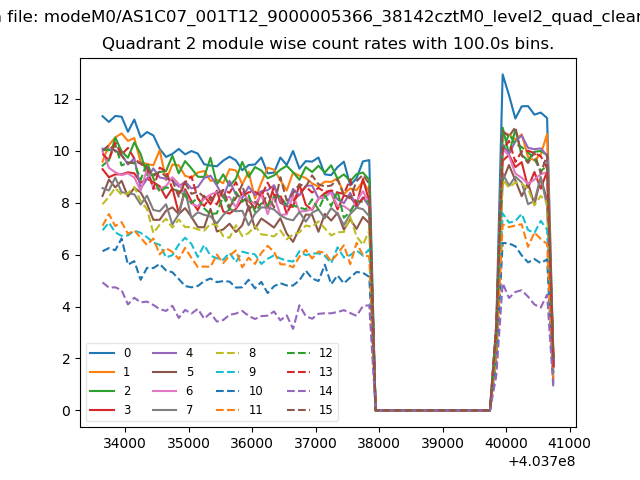
| Module-wise count rates for Quadrant B Data is divided into 100 sec bins |
 |
 |
| Module-wise count rates for Quadrant C Data is divided into 100 sec bins |
 |
 |
| Module-wise count rates for Quadrant D Data is divided into 100 sec bins |
 |
 |
| Parameter | Plot |
|---|---|
| CZT HV Monitor | 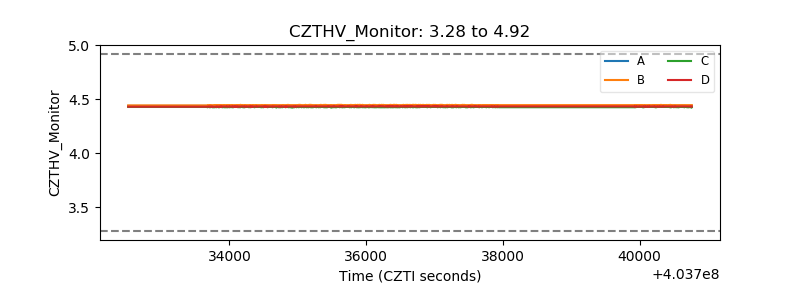 |
| D_VDD | 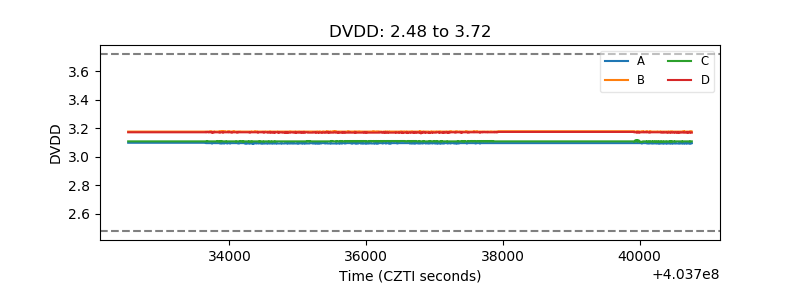 |
| Temperature 1 | 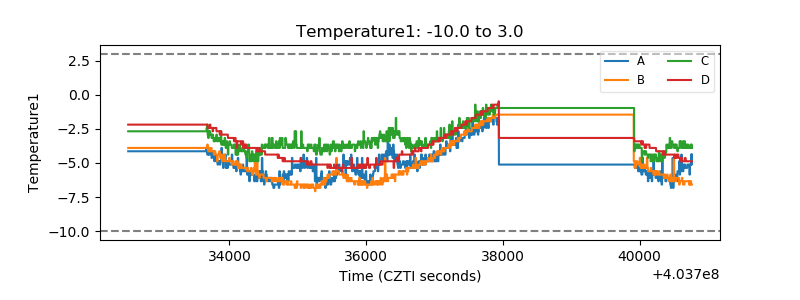 |
| Veto HV Monitor | 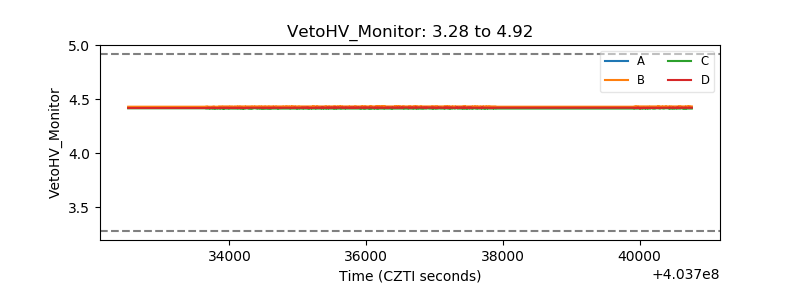 |
| Veto LLD | 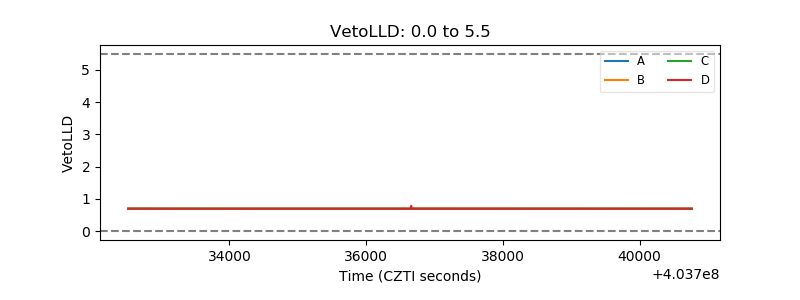 |
| Alpha Counter | 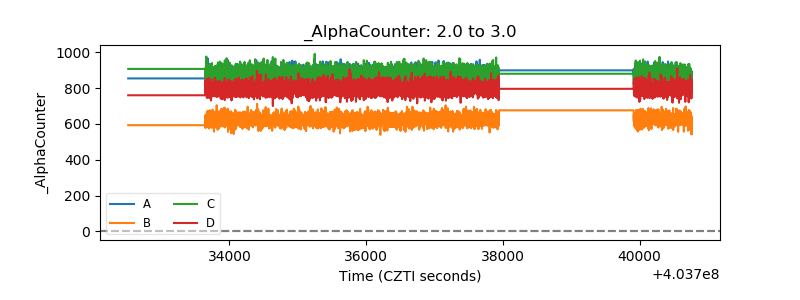 |
| _CPM_Rate | 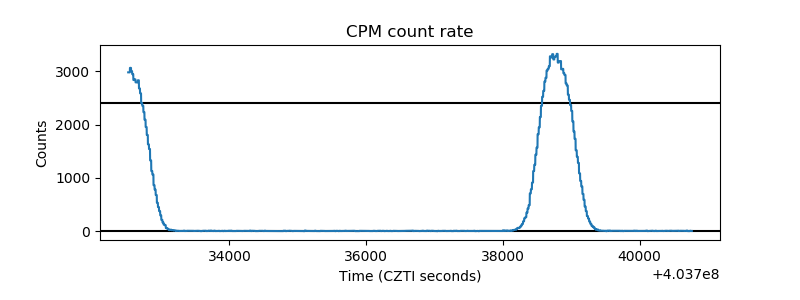 |
| CZT Counter | 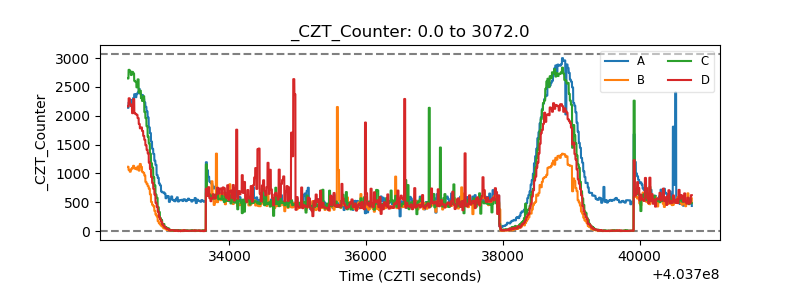 |
| +2.5 Volts monitor | 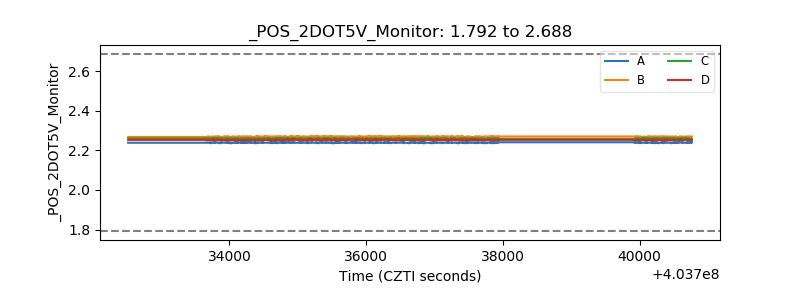 |
| +5 Volts monitor | 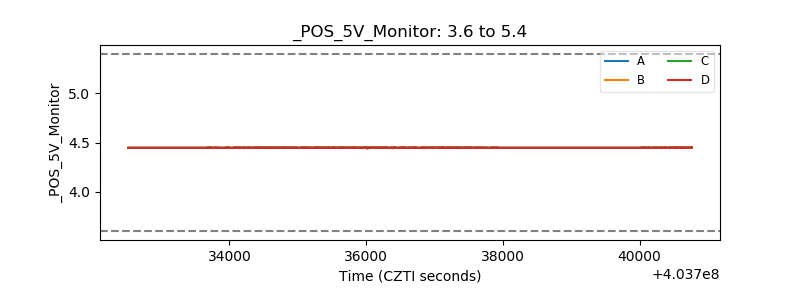 |
| _ROLL_ROT | 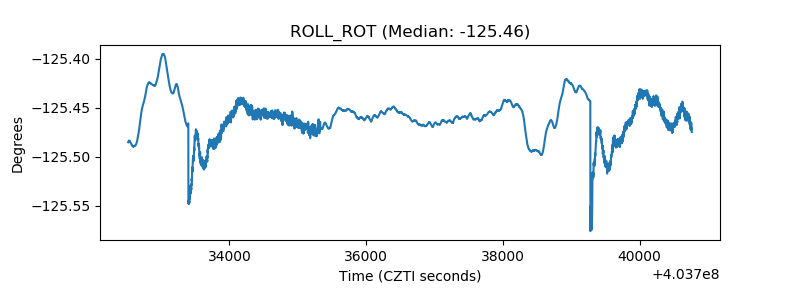 |
| _Roll_DEC | 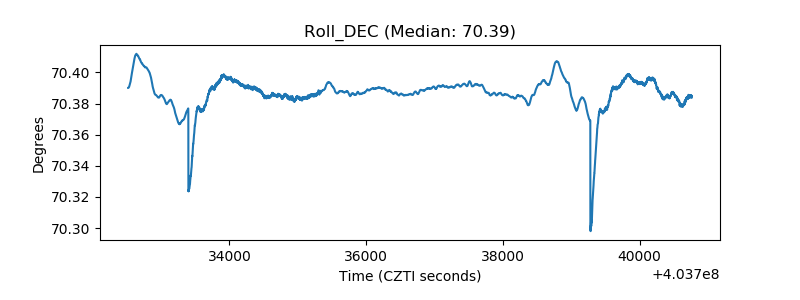 |
| _Roll_RA | 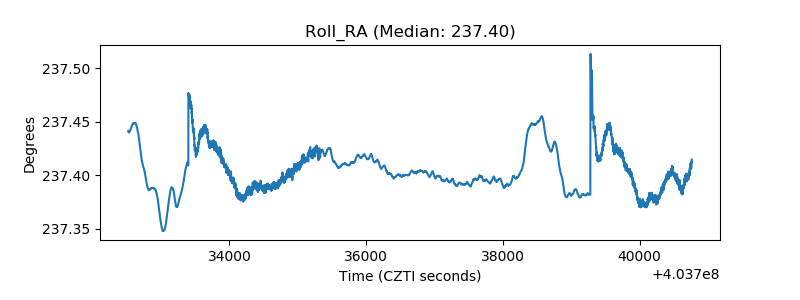 |
| Veto Counter | 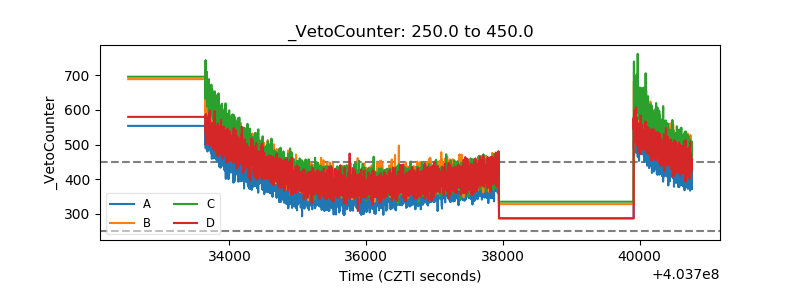 |