| Param | Original file | Final file |
|---|---|---|
| Filename | modeM0/AS1C07_001T12_9000005366_38144cztM0_level2.fits | modeM0/AS1C07_001T12_9000005366_38144cztM0_level2_quad_clean.evt |
| Size (bytes) | 538,240,320 | 172,834,560 |
| Size | 513.3 MB | 164.8 MB |
| Events in quadrant A | 4,977,273 | 1,170,130 |
| Events in quadrant B | 4,609,204 | 1,206,429 |
| Events in quadrant C | 4,582,182 | 1,160,849 |
| Events in quadrant D | 5,029,248 | 1,048,035 |
| Mode M0 | |||
|---|---|---|---|
| Quadrant | BADHDUFLAG | Total packets | Discarded packets |
| A | 0 | 20557 | 4 |
| B | 0 | 19789 | 3 |
| C | 0 | 19280 | 3 |
| D | 0 | 21454 | 3 |
| Mode M9 | |||
|---|---|---|---|
| Quadrant | BADHDUFLAG | Total packets | Discarded packets |
| A | 0 | 54 | 0 |
| B | 0 | 54 | 0 |
| C | 0 | 54 | 0 |
| D | 0 | 55 | 0 |
| Mode SS | |||
|---|---|---|---|
| Quadrant | BADHDUFLAG | Total packets | Discarded packets |
| A | 0 | 192 | 0 |
| B | 0 | 192 | 0 |
| C | 0 | 192 | 0 |
| D | 0 | 192 | 0 |
| Quadrant | Total seconds | Saturated seconds | Saturation percentage |
|---|---|---|---|
| A | 9350 | 31 | 0.331551% |
| B | 9350 | 60 | 0.641711% |
| C | 9350 | 17 | 0.181818% |
| D | 9350 | 123 | 1.315508% |
Noise dominated data is calculated using 1-second bins in cleaned event files. If a bin has >2000 counts, and if more than 50% of those come from <1% of pixels, then it is considered to be noise-dominated and hence unusable.
| Quadrant | # 1 sec bins | Bins with >0 counts | Bins with >2000 counts | High rate bins dominated by noise | Noise dominated (total time) | Noise dominated (detector-on time) | Marked lightcurve |
|---|---|---|---|---|---|---|---|
| A | 13567 | 9352 | 19 | 19 | 0.14% | 0.20% | 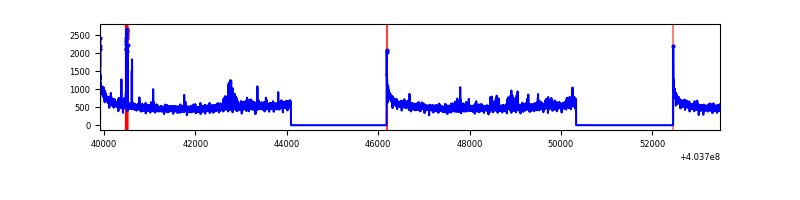 |
| B | 13567 | 9352 | 39 | 39 | 0.29% | 0.42% | 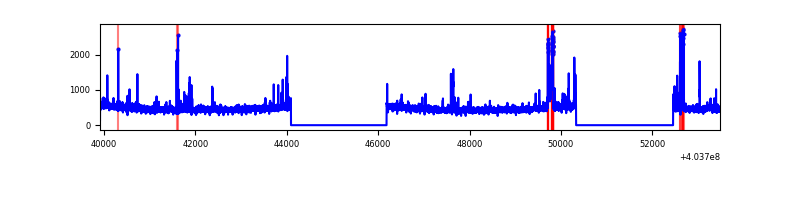 |
| C | 13567 | 9352 | 8 | 8 | 0.06% | 0.09% | 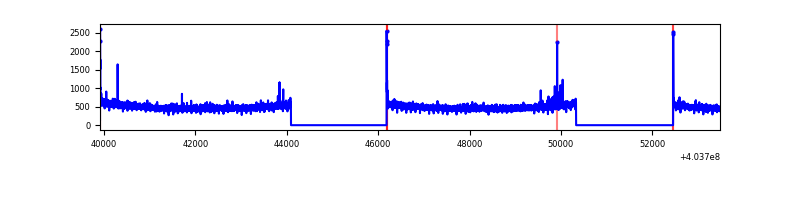 |
| D | 13567 | 9352 | 105 | 105 | 0.77% | 1.12% | 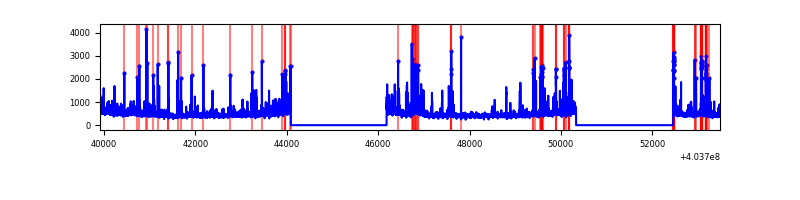 |
Top three noisy pixels from each quadrant. If the there are fewer than three noisy pixels in the level2.evt file, extra rows are filled as -1
| Pixel properties | Quadrant properties | ||||||
|---|---|---|---|---|---|---|---|
| Quadrant | DetID | PixID | Counts | Sigma | Mean | Median | Sigma |
| A | 10 | 83 | 592984 | 2784.14 | 1071 | 1053 | 212.6 |
| A | 12 | 16 | 141695 | 661.51 | 1071 | 1053 | 212.6 |
| A | 9 | 143 | 54365 | 250.75 | 1071 | 1053 | 212.6 |
| B | 4 | 171 | 188321 | 947.14 | 1073 | 1049 | 197.7 |
| B | 5 | 172 | 106540 | 533.53 | 1073 | 1049 | 197.7 |
| B | 0 | 229 | 50097 | 248.06 | 1073 | 1049 | 197.7 |
| C | 15 | 214 | 388477 | 1616.26 | 1048 | 1059 | 239.7 |
| C | 0 | 10 | 39654 | 161.01 | 1048 | 1059 | 239.7 |
| C | 3 | 233 | 28377 | 113.97 | 1048 | 1059 | 239.7 |
| D | 13 | 249 | 468449 | 1907.92 | 1027 | 1001 | 245.0 |
| D | 1 | 52 | 229197 | 931.4 | 1027 | 1001 | 245.0 |
| D | 7 | 55 | 145406 | 589.4 | 1027 | 1001 | 245.0 |
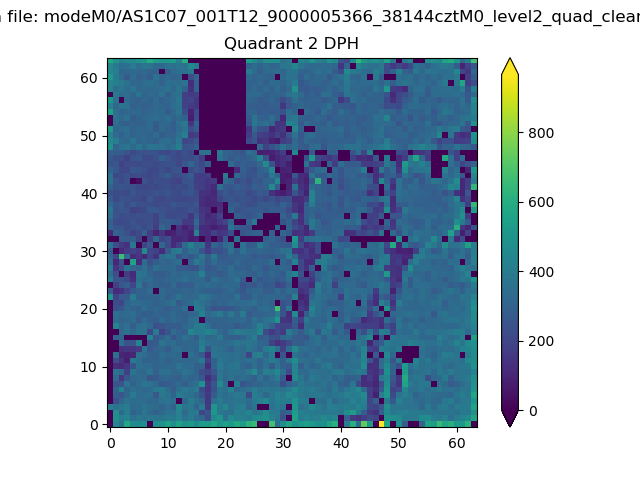
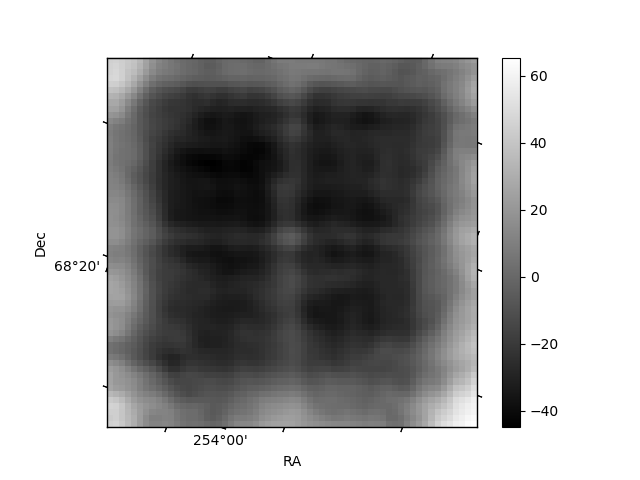
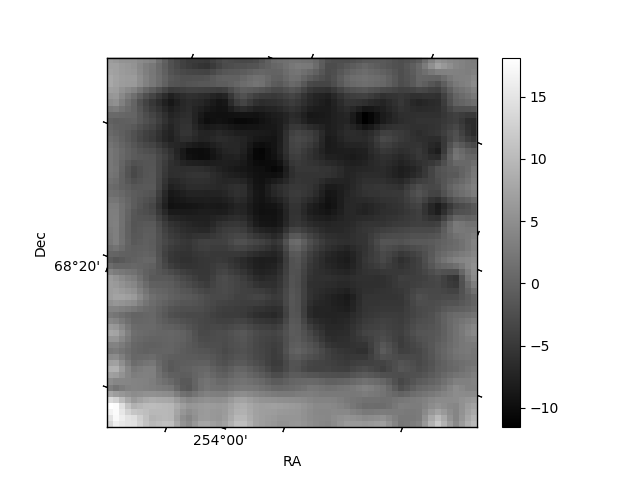
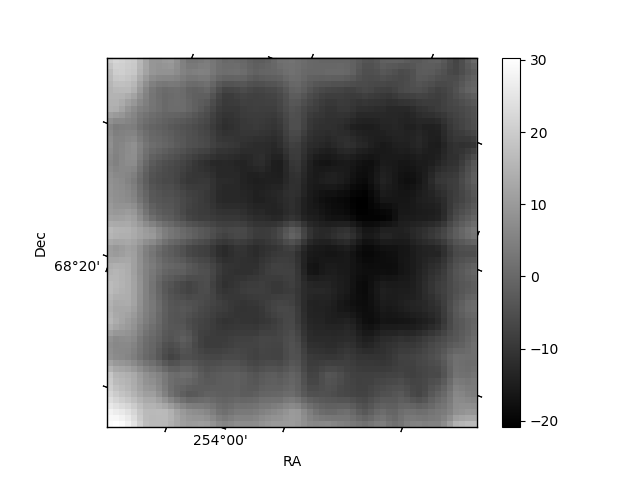
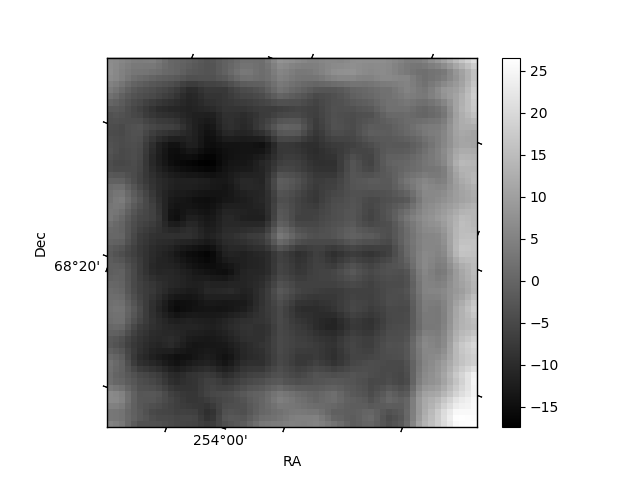
Histogram calculated using DETX and DETY for each event in the final _common_clean file
| Quadrant A | 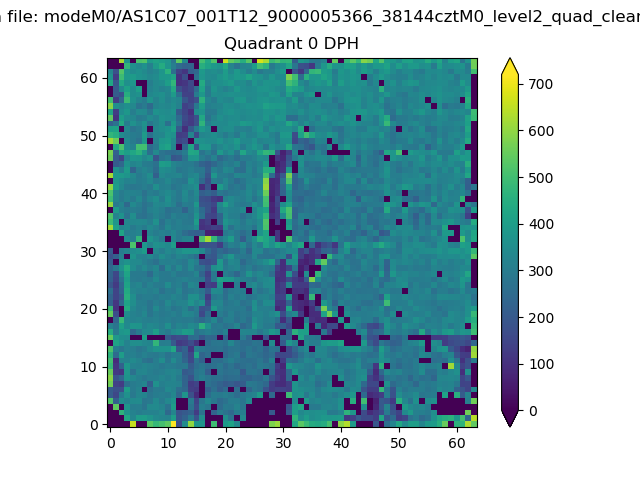 |
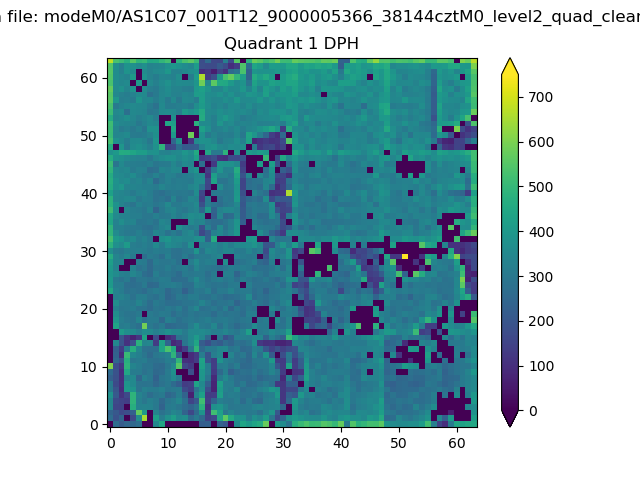 |
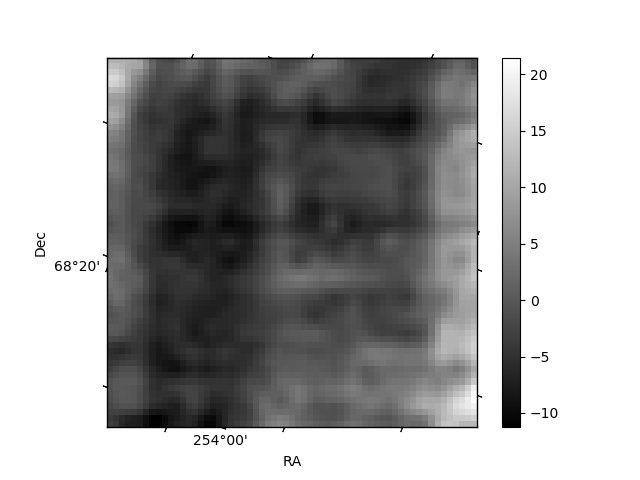
Quadrant B |
|---|---|---|---|
| Quadrant D | 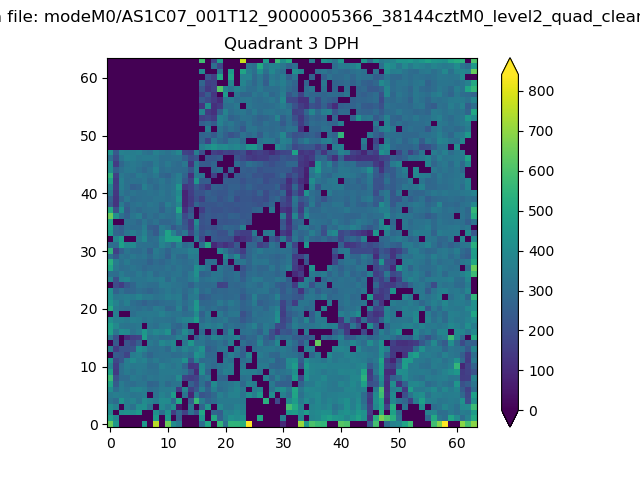 |
 |
Quadrant C |
| Plot type | Count rate plots | Images |
|---|---|---|
| Comparison with Poisson distribution Blue bars denote a histogram of data divided into 1 sec bins. Red curve is a Poisson curve with rate = median count rate of data. |
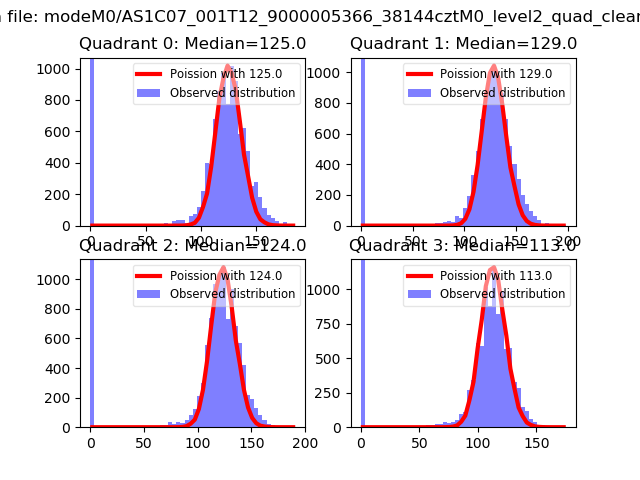 |
 |
| Quadrant-wise count rates Data is divided into 100 sec bins |
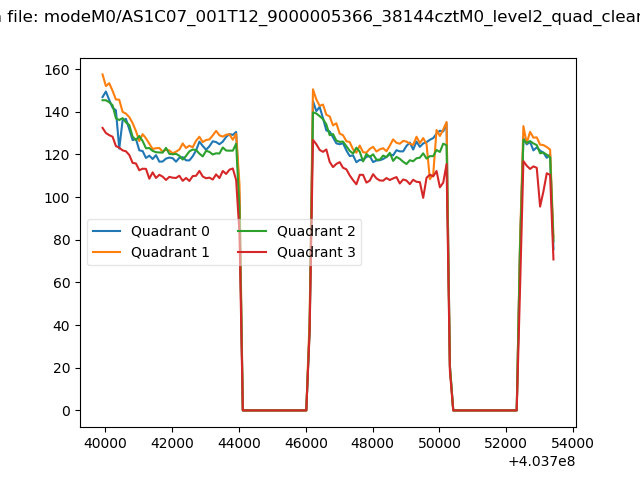 |
|
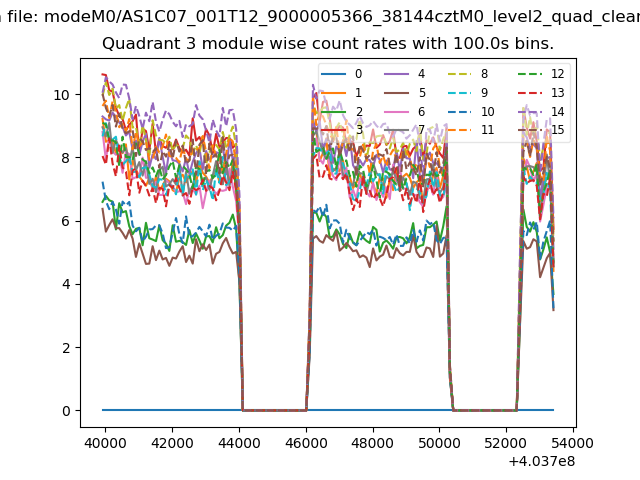
| Module-wise count rates for Quadrant A Data is divided into 100 sec bins |
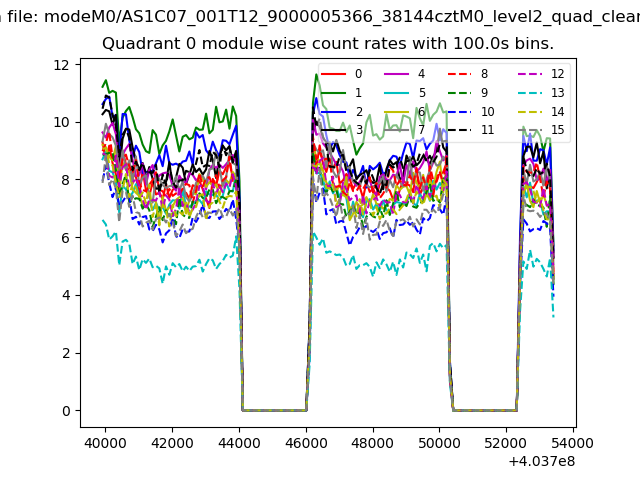 |
 |
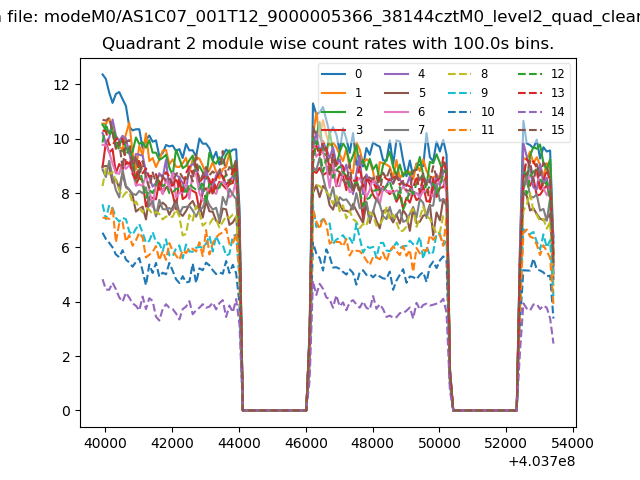
| Module-wise count rates for Quadrant B Data is divided into 100 sec bins |
 |
 |
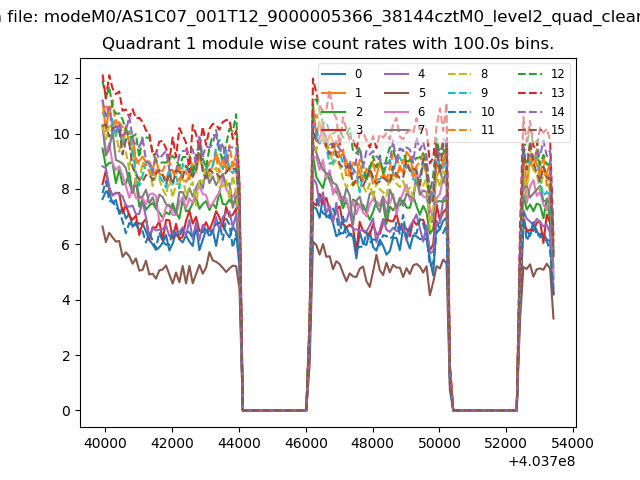
| Module-wise count rates for Quadrant C Data is divided into 100 sec bins |
 |
 |
| Module-wise count rates for Quadrant D Data is divided into 100 sec bins |
 |
 |
| Parameter | Plot |
|---|---|
| CZT HV Monitor | 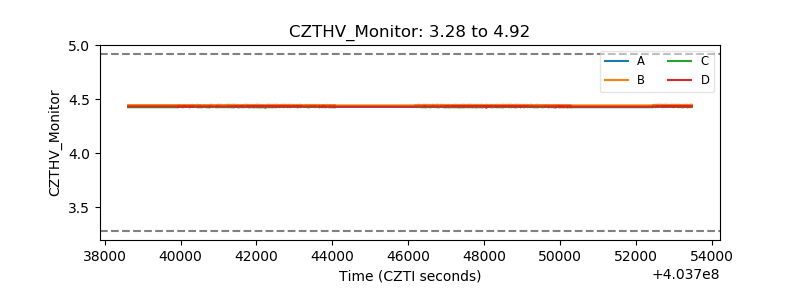 |
| D_VDD | 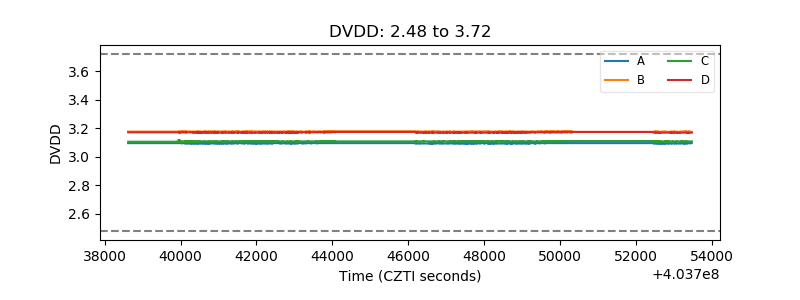 |
| Temperature 1 | 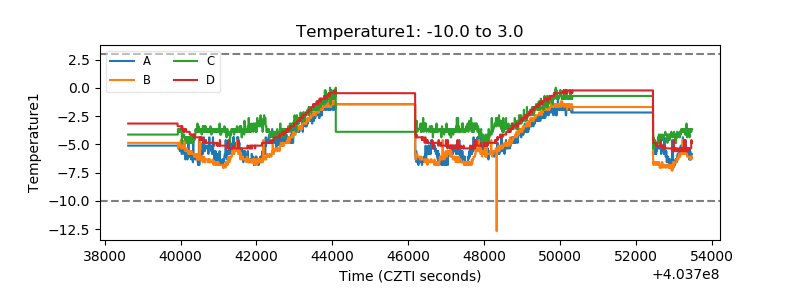 |
| Veto HV Monitor | 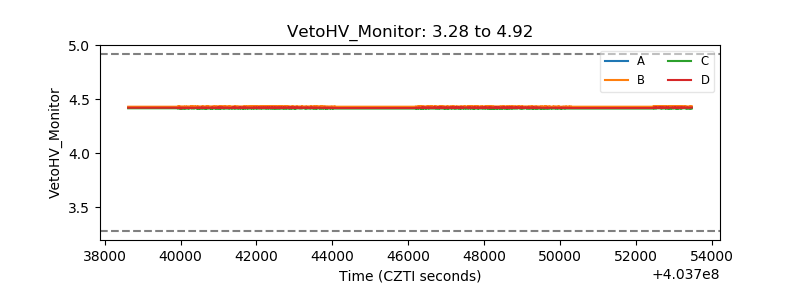 |
| Veto LLD | 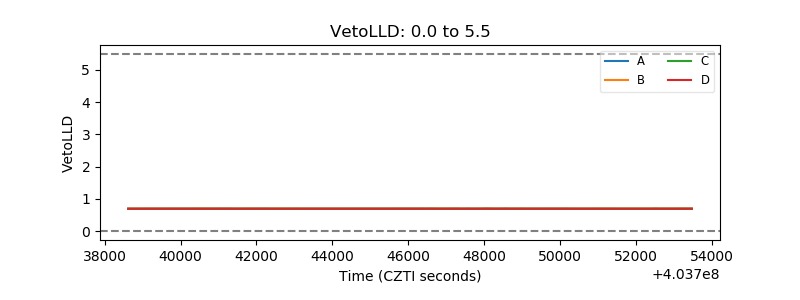 |
| Alpha Counter | 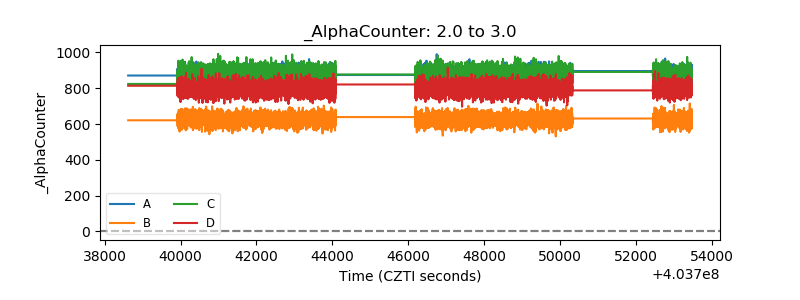 |
| _CPM_Rate | 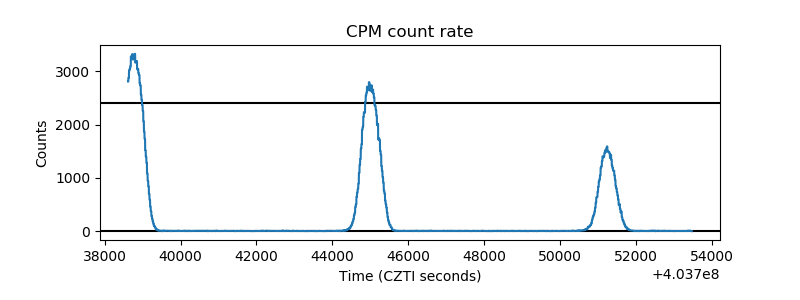 |
| CZT Counter | 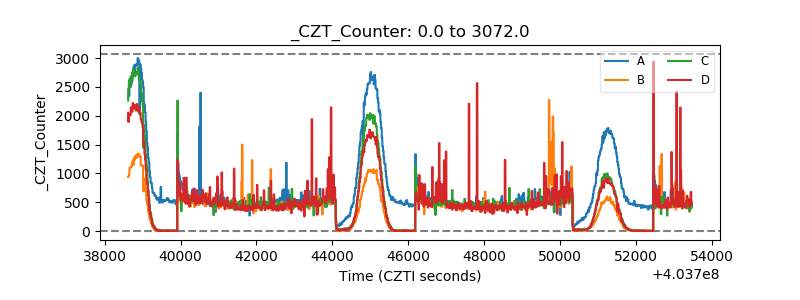 |
| +2.5 Volts monitor | 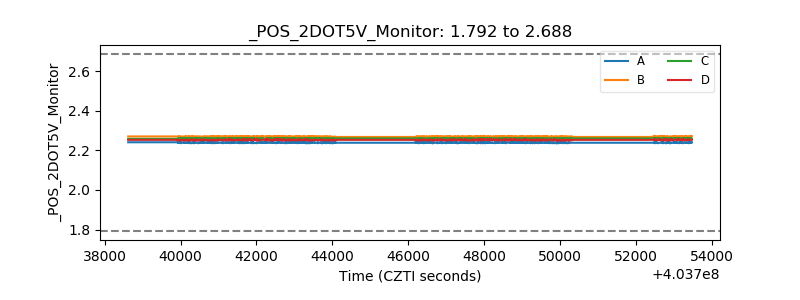 |
| +5 Volts monitor | 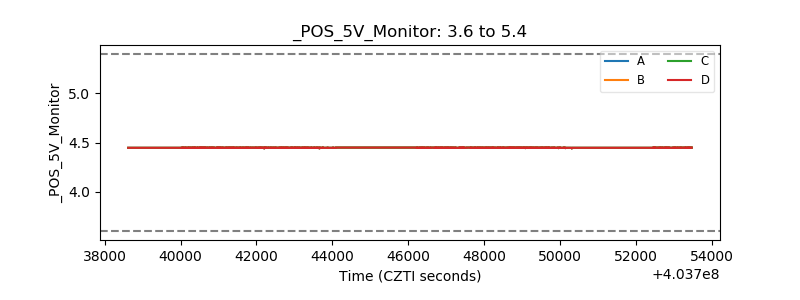 |
| _ROLL_ROT | 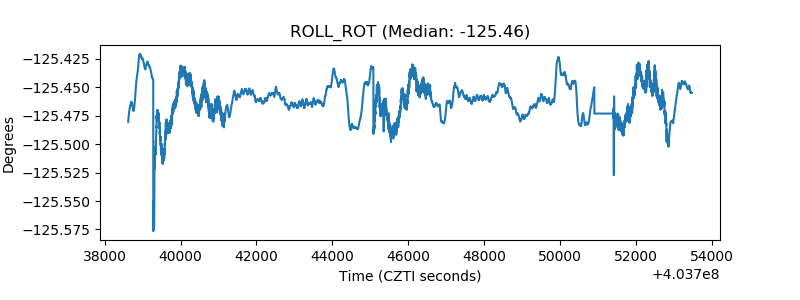 |
| _Roll_DEC | 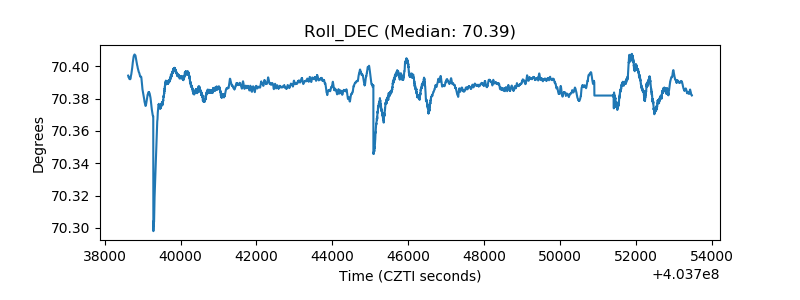 |
| _Roll_RA | 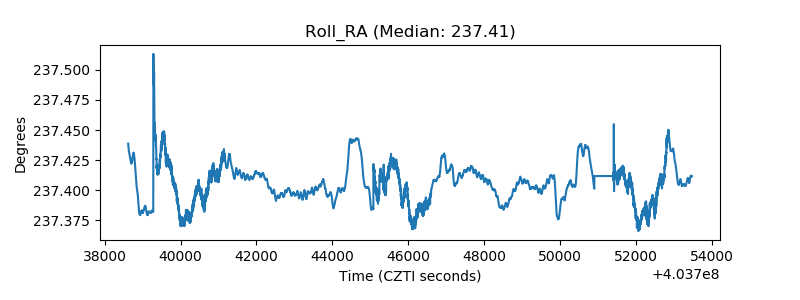 |
| Veto Counter | 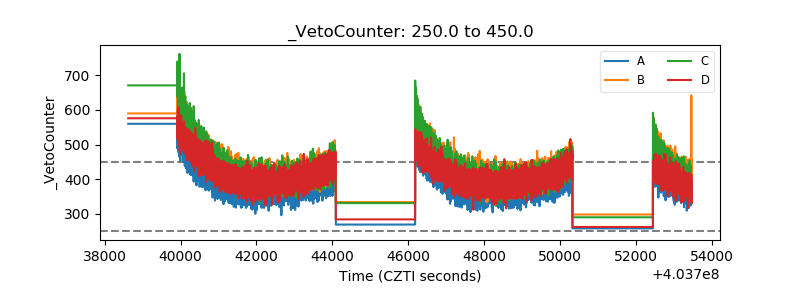 |