| Param | Original file | Final file |
|---|---|---|
| Filename | modeM0/AS1C07_001T12_9000005366_38145cztM0_level2.fits | modeM0/AS1C07_001T12_9000005366_38145cztM0_level2_quad_clean.evt |
| Size (bytes) | 742,596,480 | 237,150,720 |
| Size | 708.2 MB | 226.2 MB |
| Events in quadrant A | 6,796,205 | 1,606,680 |
| Events in quadrant B | 6,387,065 | 1,653,656 |
| Events in quadrant C | 6,319,573 | 1,585,420 |
| Events in quadrant D | 6,965,805 | 1,427,411 |
| Mode M0 | |||
|---|---|---|---|
| Quadrant | BADHDUFLAG | Total packets | Discarded packets |
| A | 0 | 28236 | 4 |
| B | 0 | 27615 | 3 |
| C | 0 | 26830 | 3 |
| D | 0 | 29892 | 3 |
| Mode M9 | |||
|---|---|---|---|
| Quadrant | BADHDUFLAG | Total packets | Discarded packets |
| A | 0 | 64 | 0 |
| B | 0 | 64 | 0 |
| C | 0 | 64 | 0 |
| D | 0 | 64 | 0 |
| Mode SS | |||
|---|---|---|---|
| Quadrant | BADHDUFLAG | Total packets | Discarded packets |
| A | 0 | 268 | 0 |
| B | 0 | 268 | 0 |
| C | 0 | 268 | 0 |
| D | 0 | 268 | 0 |
| Quadrant | Total seconds | Saturated seconds | Saturation percentage |
|---|---|---|---|
| A | 13150 | 33 | 0.250951% |
| B | 13150 | 68 | 0.517110% |
| C | 13150 | 18 | 0.136882% |
| D | 13150 | 164 | 1.247148% |
Noise dominated data is calculated using 1-second bins in cleaned event files. If a bin has >2000 counts, and if more than 50% of those come from <1% of pixels, then it is considered to be noise-dominated and hence unusable.
| Quadrant | # 1 sec bins | Bins with >0 counts | Bins with >2000 counts | High rate bins dominated by noise | Noise dominated (total time) | Noise dominated (detector-on time) | Marked lightcurve |
|---|---|---|---|---|---|---|---|
| A | 19490 | 13153 | 19 | 19 | 0.10% | 0.14% | 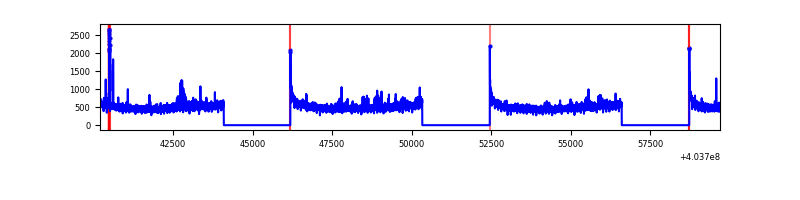 |
| B | 19490 | 13153 | 41 | 41 | 0.21% | 0.31% | 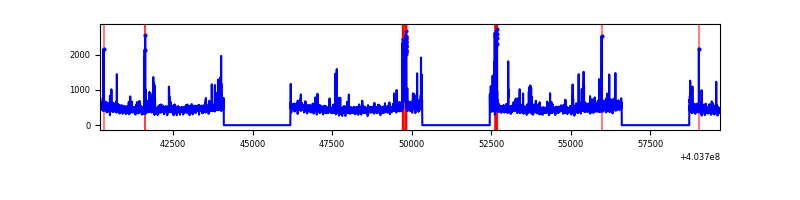 |
| C | 19490 | 13153 | 10 | 10 | 0.05% | 0.08% | 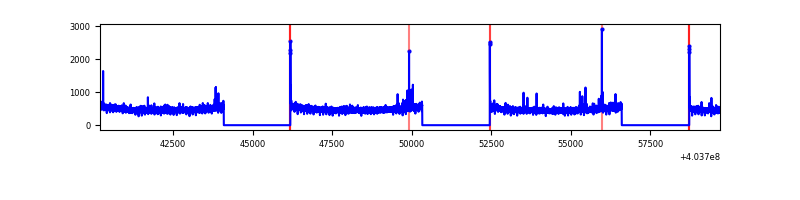 |
| D | 19490 | 13153 | 141 | 141 | 0.72% | 1.07% | 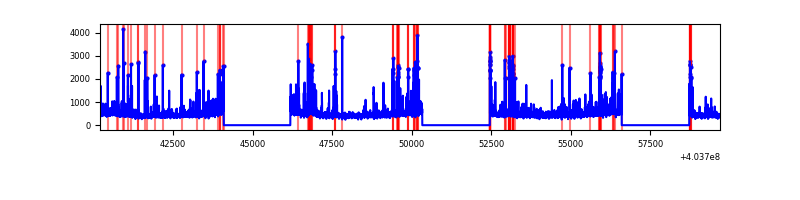 |
Top three noisy pixels from each quadrant. If the there are fewer than three noisy pixels in the level2.evt file, extra rows are filled as -1
| Pixel properties | Quadrant properties | ||||||
|---|---|---|---|---|---|---|---|
| Quadrant | DetID | PixID | Counts | Sigma | Mean | Median | Sigma |
| A | 10 | 83 | 760460 | 2576.32 | 1488 | 1465 | 294.6 |
| A | 12 | 16 | 165769 | 557.71 | 1488 | 1465 | 294.6 |
| A | 9 | 143 | 52982 | 174.87 | 1488 | 1465 | 294.6 |
| B | 4 | 171 | 221385 | 800.08 | 1486 | 1450 | 274.9 |
| B | 5 | 172 | 116685 | 419.2 | 1486 | 1450 | 274.9 |
| B | 0 | 229 | 89525 | 320.4 | 1486 | 1450 | 274.9 |
| C | 15 | 214 | 540418 | 1624.6 | 1448 | 1461 | 331.7 |
| C | 3 | 233 | 46685 | 136.32 | 1448 | 1461 | 331.7 |
| C | 0 | 10 | 35172 | 101.61 | 1448 | 1461 | 331.7 |
| D | 13 | 249 | 640980 | 1887.47 | 1424 | 1387 | 338.9 |
| D | 1 | 52 | 218832 | 641.69 | 1424 | 1387 | 338.9 |
| D | 7 | 223 | 207968 | 609.63 | 1424 | 1387 | 338.9 |
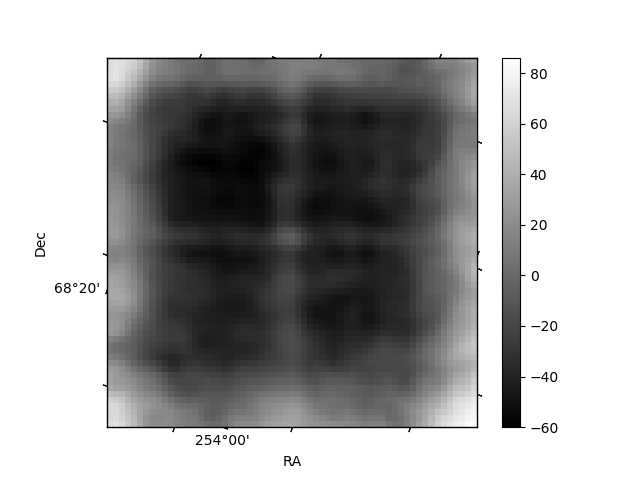
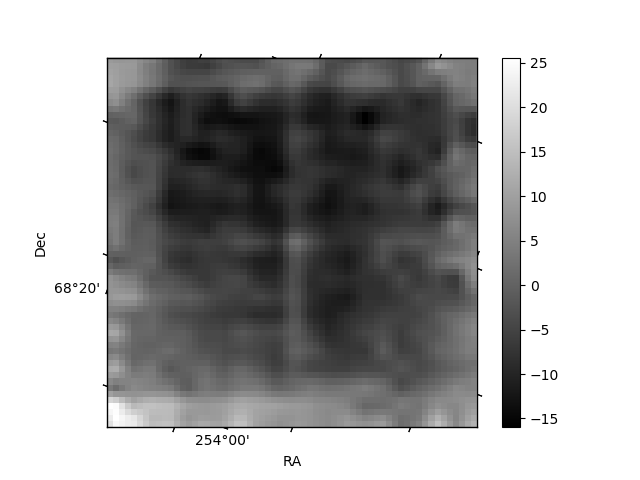
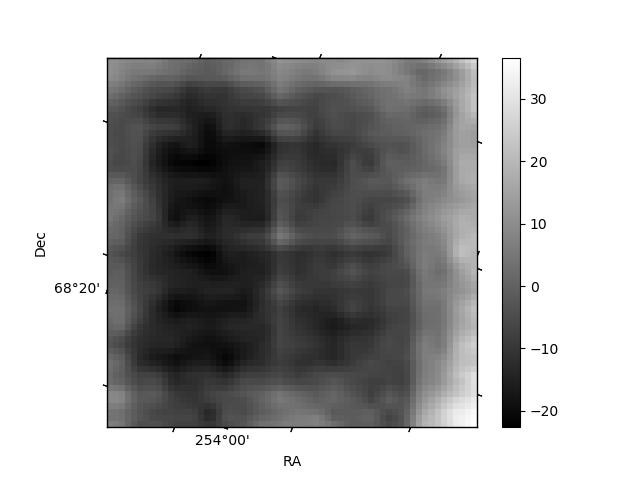
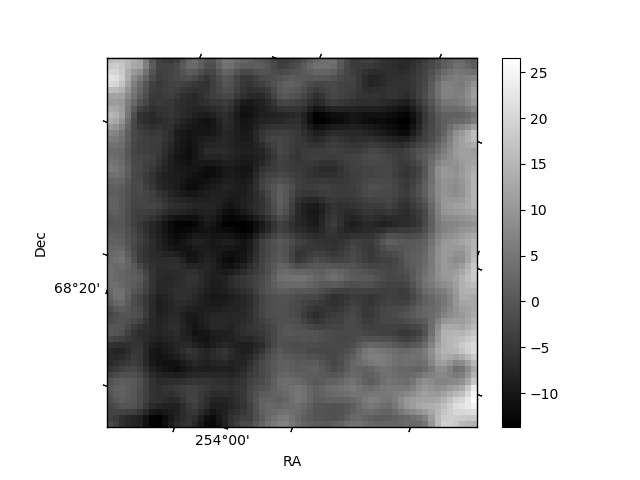
Histogram calculated using DETX and DETY for each event in the final _common_clean file
| Quadrant A | 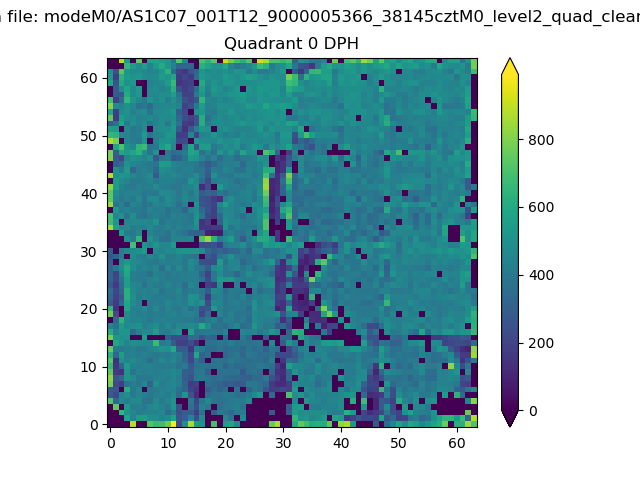 |
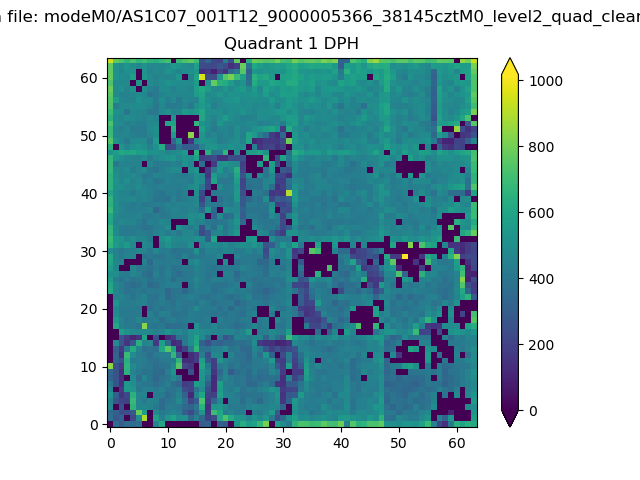 |
Quadrant B |
|---|---|---|---|
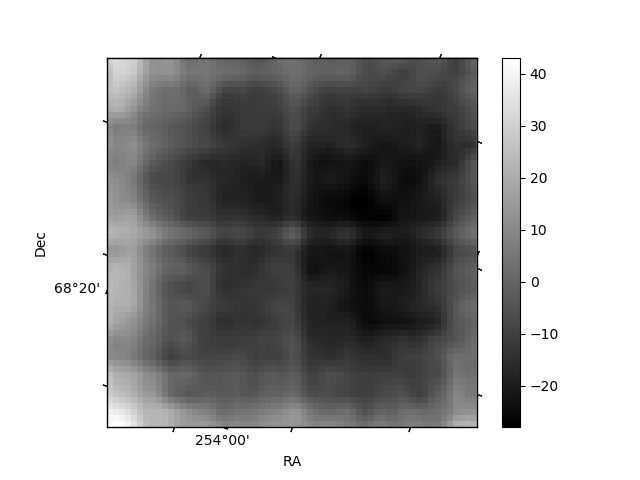
| Quadrant D | 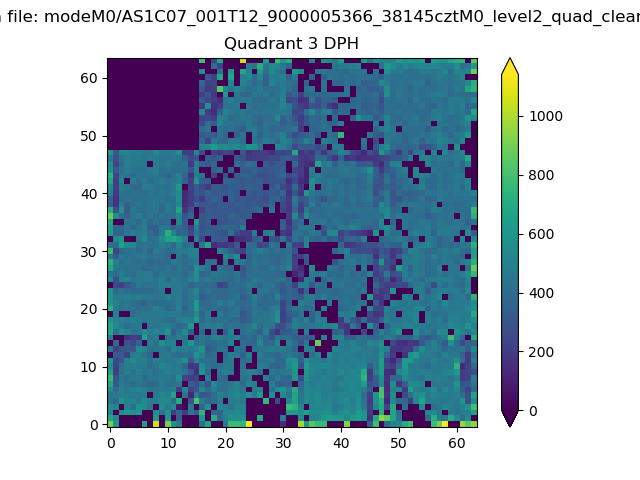 |
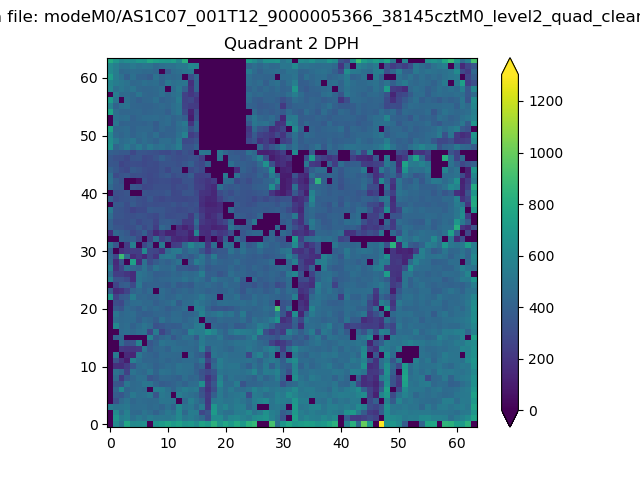 |
Quadrant C |
| Plot type | Count rate plots | Images |
|---|---|---|
| Comparison with Poisson distribution Blue bars denote a histogram of data divided into 1 sec bins. Red curve is a Poisson curve with rate = median count rate of data. |
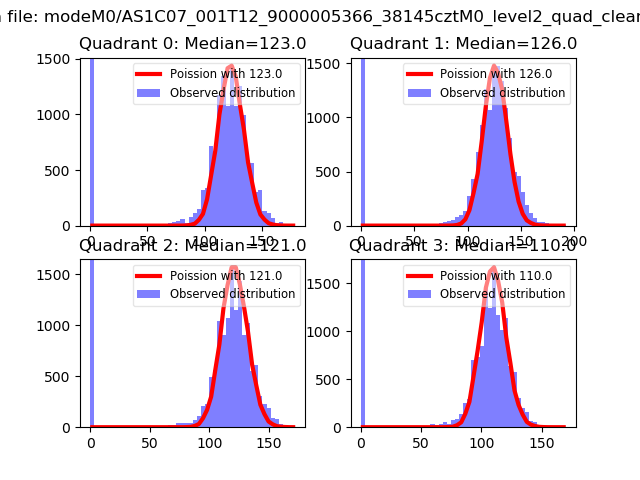 |
 |
| Quadrant-wise count rates Data is divided into 100 sec bins |
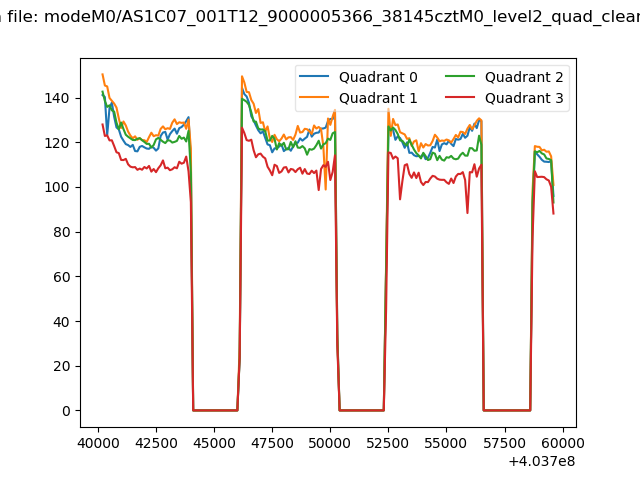 |
|
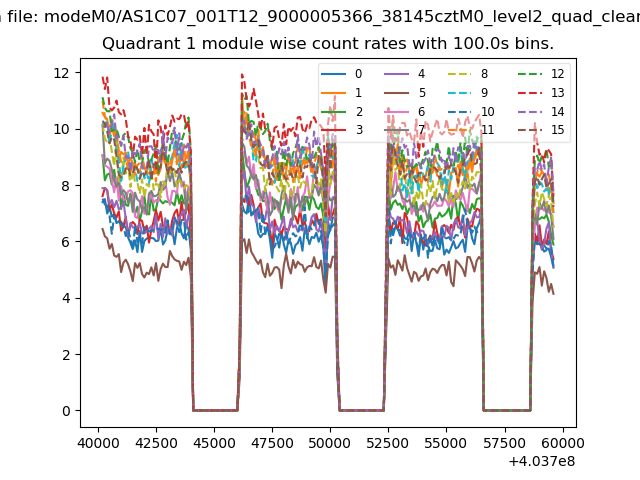
| Module-wise count rates for Quadrant A Data is divided into 100 sec bins |
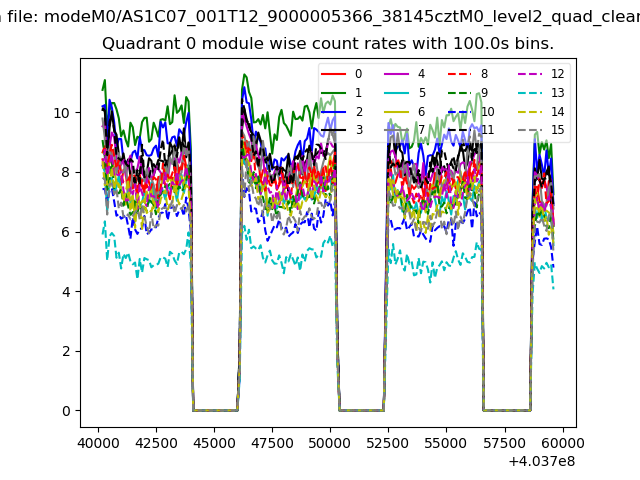 |
 |
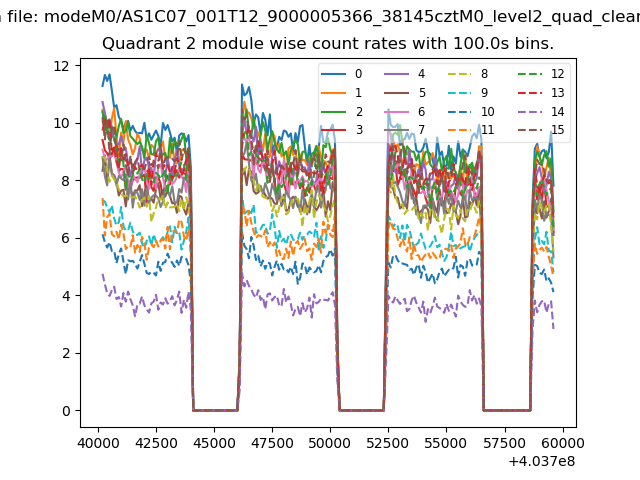
| Module-wise count rates for Quadrant B Data is divided into 100 sec bins |
 |
 |
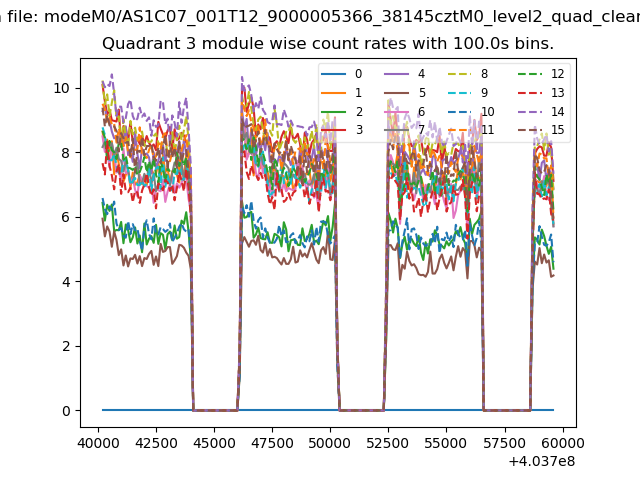
| Module-wise count rates for Quadrant C Data is divided into 100 sec bins |
 |
 |
| Module-wise count rates for Quadrant D Data is divided into 100 sec bins |
 |
 |
| Parameter | Plot |
|---|---|
| CZT HV Monitor | 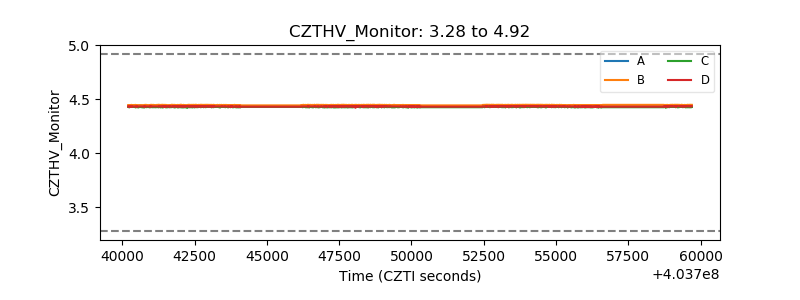 |
| D_VDD | 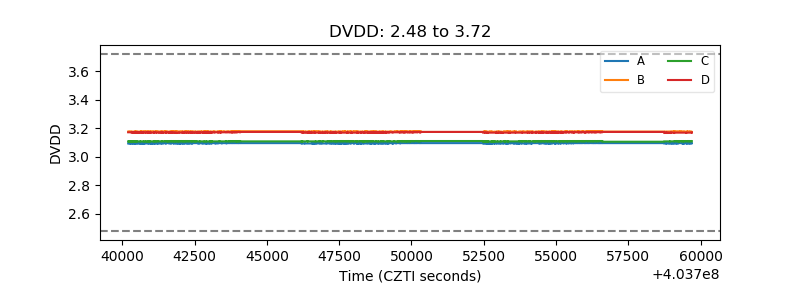 |
| Temperature 1 | 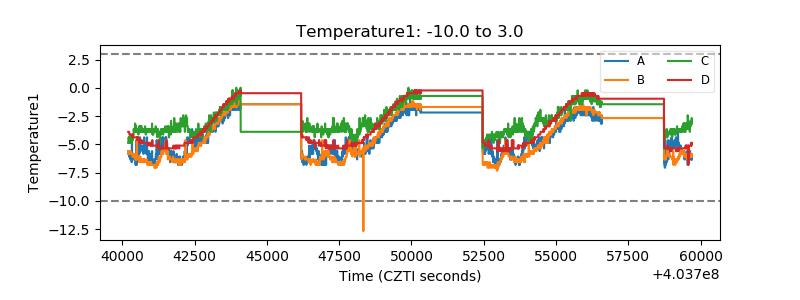 |
| Veto HV Monitor | 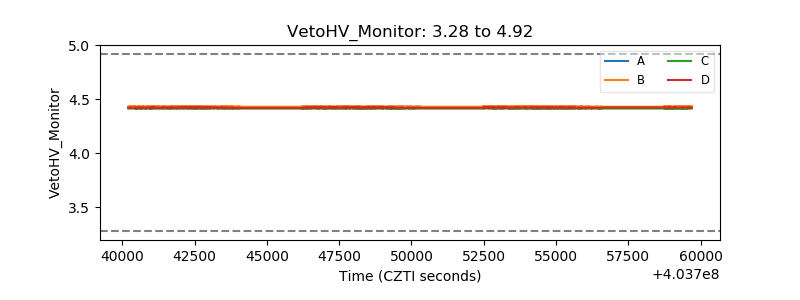 |
| Veto LLD | 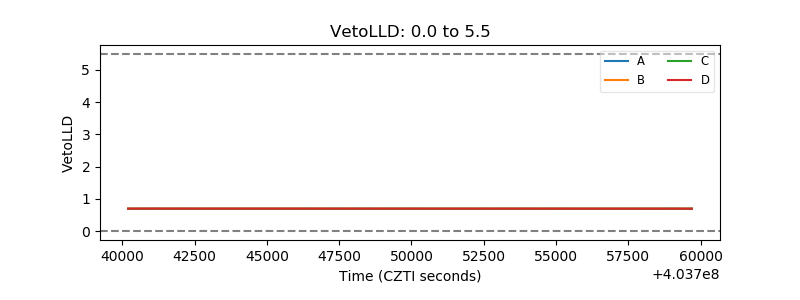 |
| Alpha Counter | 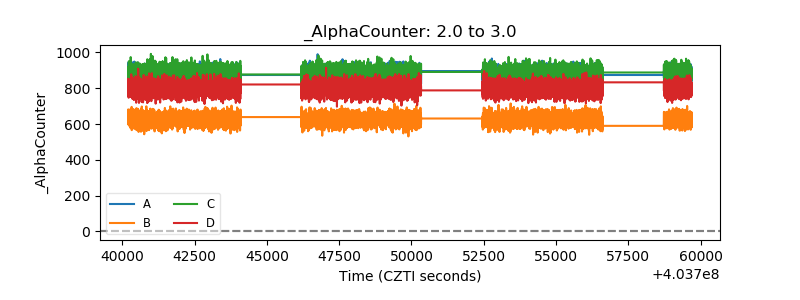 |
| _CPM_Rate | 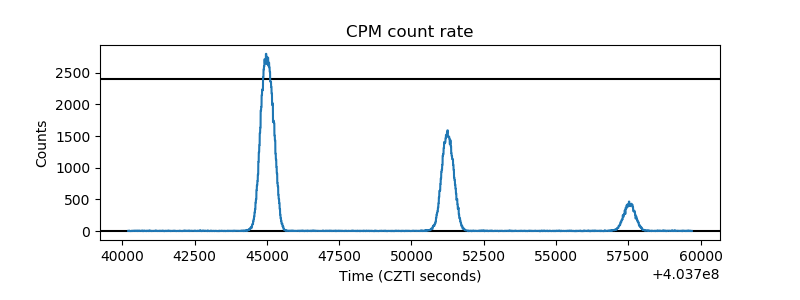 |
| CZT Counter | 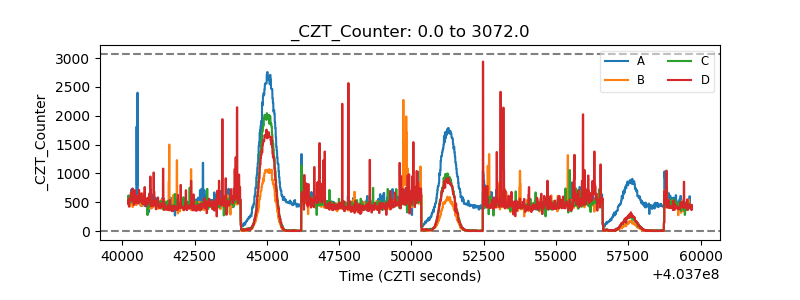 |
| +2.5 Volts monitor | 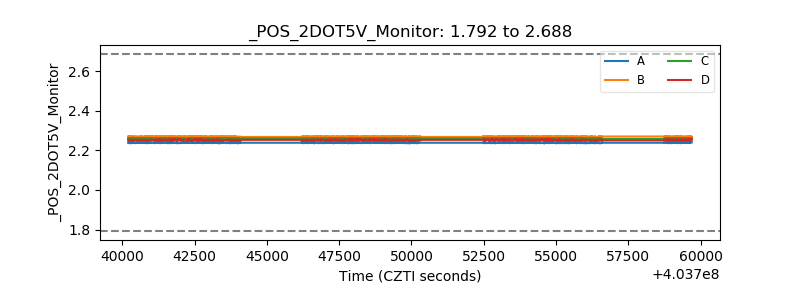 |
| +5 Volts monitor | 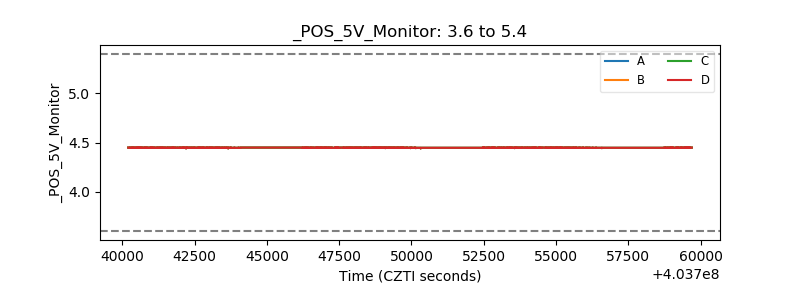 |
| _ROLL_ROT | 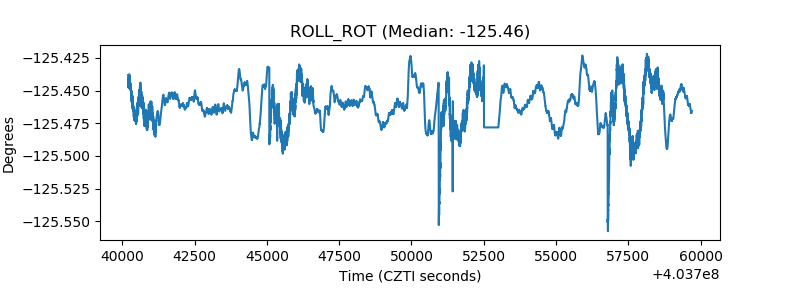 |
| _Roll_DEC | 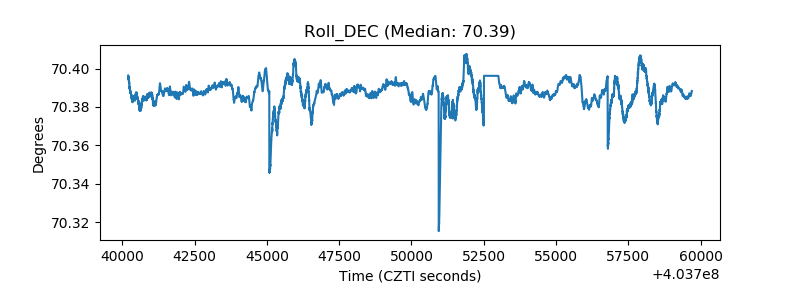 |
| _Roll_RA | 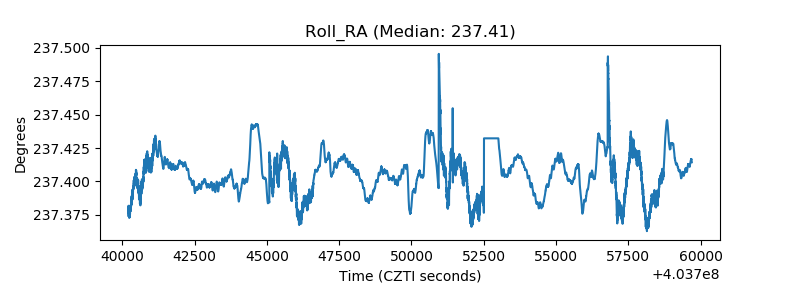 |
| Veto Counter | 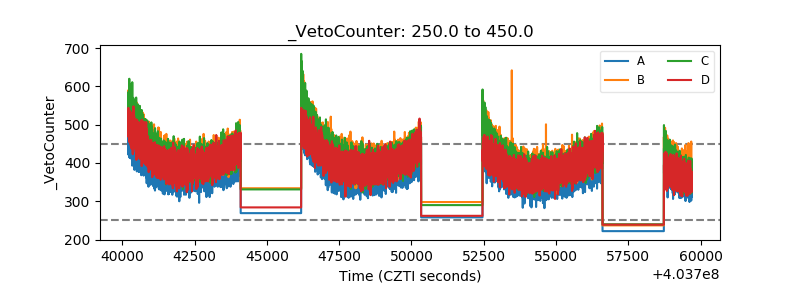 |