| Param | Original file | Final file |
|---|---|---|
| Filename | modeM0/AS1C07_001T12_9000005366_38148cztM0_level2.fits | modeM0/AS1C07_001T12_9000005366_38148cztM0_level2_quad_clean.evt |
| Size (bytes) | 147,317,760 | 49,798,080 |
| Size | 140.5 MB | 47.5 MB |
| Events in quadrant A | 1,358,277 | 334,492 |
| Events in quadrant B | 1,265,603 | 342,546 |
| Events in quadrant C | 1,290,985 | 324,595 |
| Events in quadrant D | 1,308,025 | 297,212 |
| Mode M0 | |||
|---|---|---|---|
| Quadrant | BADHDUFLAG | Total packets | Discarded packets |
| A | 0 | 5886 | 0 |
| B | 0 | 5921 | 0 |
| C | 0 | 5875 | 0 |
| D | 0 | 6077 | 0 |
| Mode SS | |||
|---|---|---|---|
| Quadrant | BADHDUFLAG | Total packets | Discarded packets |
| A | 0 | 60 | 0 |
| B | 0 | 60 | 0 |
| C | 0 | 60 | 0 |
| D | 0 | 60 | 0 |
| Quadrant | Total seconds | Saturated seconds | Saturation percentage |
|---|---|---|---|
| A | 2927 | 3 | 0.102494% |
| B | 2927 | 5 | 0.170823% |
| C | 2927 | 0 | 0.000000% |
| D | 2927 | 10 | 0.341647% |
Noise dominated data is calculated using 1-second bins in cleaned event files. If a bin has >2000 counts, and if more than 50% of those come from <1% of pixels, then it is considered to be noise-dominated and hence unusable.
| Quadrant | # 1 sec bins | Bins with >0 counts | Bins with >2000 counts | High rate bins dominated by noise | Noise dominated (total time) | Noise dominated (detector-on time) | Marked lightcurve |
|---|---|---|---|---|---|---|---|
| A | 2927 | 2927 | 0 | 0 | 0.00% | 0.00% | 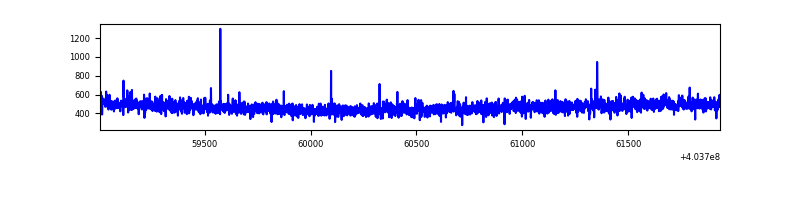 |
| B | 2927 | 2927 | 1 | 1 | 0.03% | 0.03% | 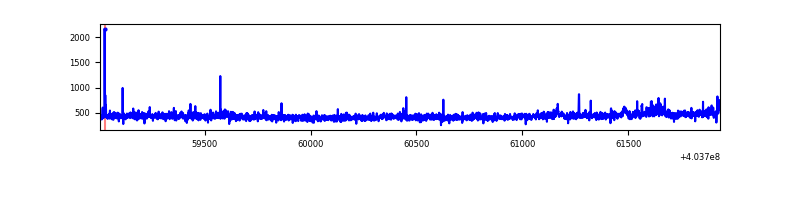 |
| C | 2927 | 2927 | 0 | 0 | 0.00% | 0.00% | 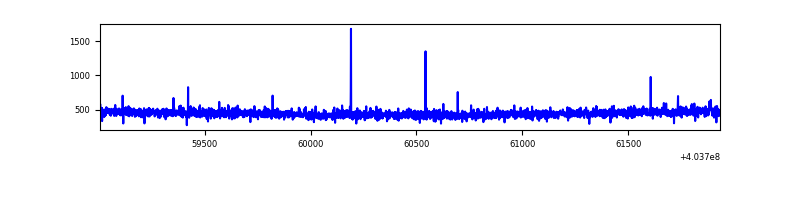 |
| D | 2927 | 2927 | 7 | 7 | 0.24% | 0.24% | 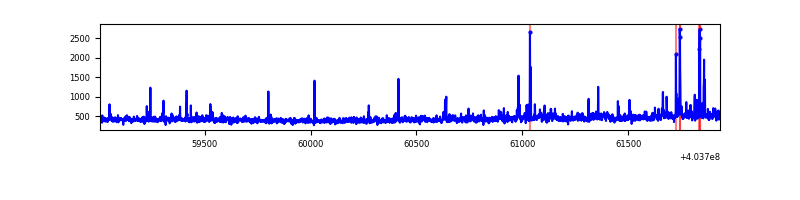 |
Top three noisy pixels from each quadrant. If the there are fewer than three noisy pixels in the level2.evt file, extra rows are filled as -1
| Pixel properties | Quadrant properties | ||||||
|---|---|---|---|---|---|---|---|
| Quadrant | DetID | PixID | Counts | Sigma | Mean | Median | Sigma |
| A | 10 | 83 | 131175 | 2038.94 | 311 | 305 | 64.2 |
| A | 12 | 189 | 10914 | 165.29 | 311 | 305 | 64.2 |
| A | 13 | 6 | 8143 | 122.12 | 311 | 305 | 64.2 |
| B | 7 | 202 | 22825 | 373.04 | 308 | 300 | 60.4 |
| B | 0 | 229 | 11438 | 184.46 | 308 | 300 | 60.4 |
| B | 12 | 111 | 7254 | 115.17 | 308 | 300 | 60.4 |
| C | 15 | 214 | 117895 | 1689.72 | 297 | 299 | 69.6 |
| C | 1 | 23 | 8432 | 116.86 | 297 | 299 | 69.6 |
| C | 3 | 233 | 6482 | 88.84 | 297 | 299 | 69.6 |
| D | 13 | 249 | 58064 | 811.82 | 296 | 288 | 71.2 |
| D | 12 | 235 | 41017 | 572.29 | 296 | 288 | 71.2 |
| D | 2 | 234 | 13905 | 191.33 | 296 | 288 | 71.2 |
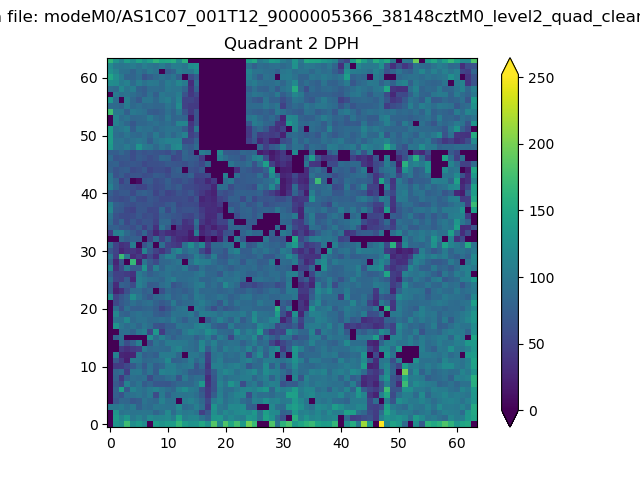
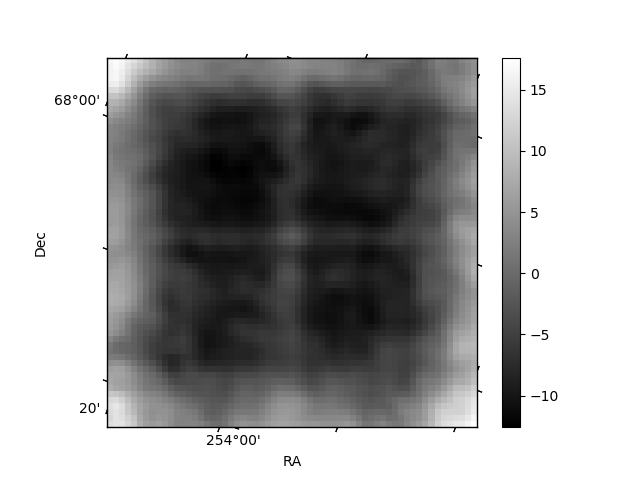
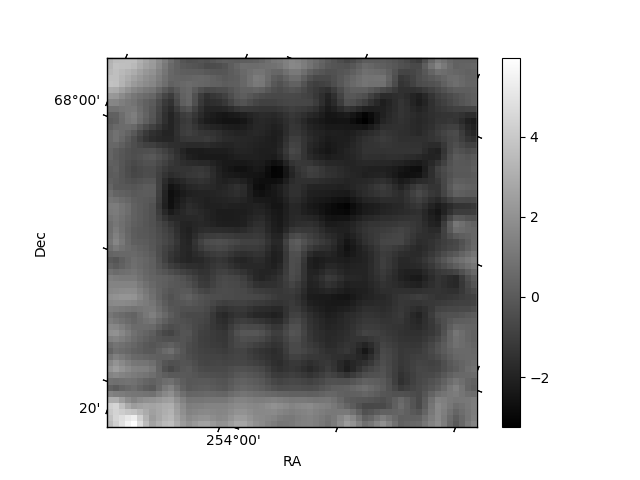
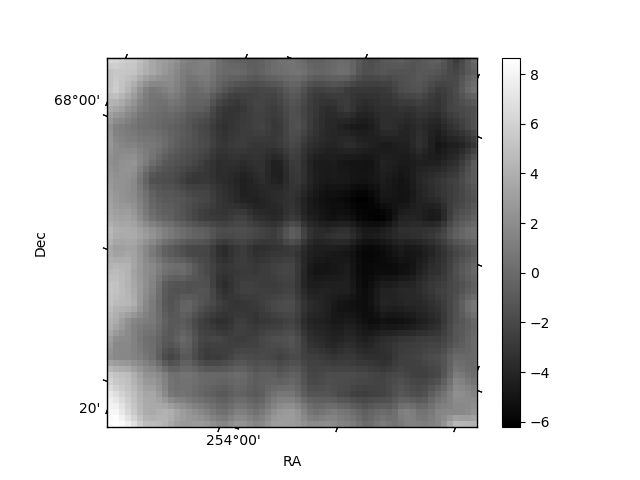
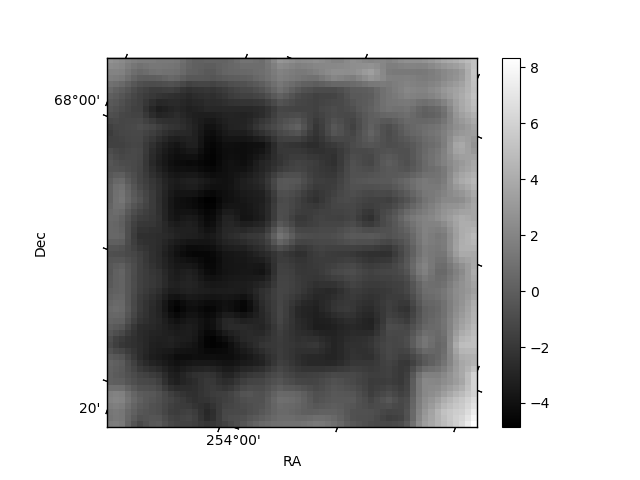
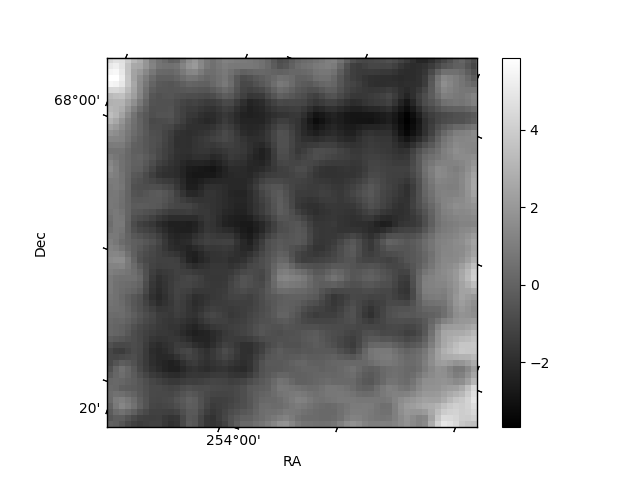
Histogram calculated using DETX and DETY for each event in the final _common_clean file
| Quadrant A | 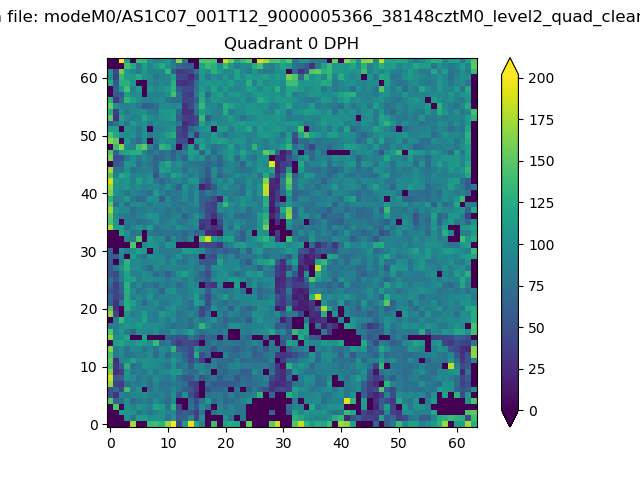 |
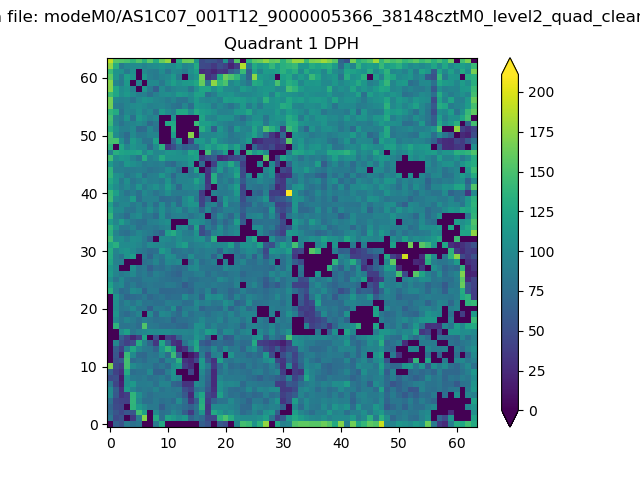 |
Quadrant B |
|---|---|---|---|
| Quadrant D | 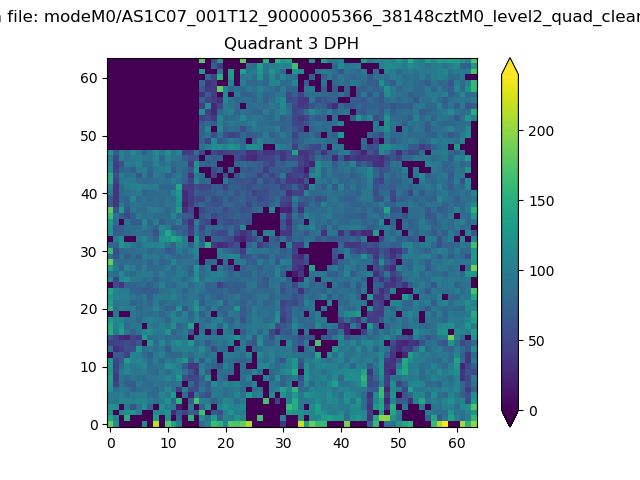 |
 |
Quadrant C |
| Plot type | Count rate plots | Images |
|---|---|---|
| Comparison with Poisson distribution Blue bars denote a histogram of data divided into 1 sec bins. Red curve is a Poisson curve with rate = median count rate of data. |
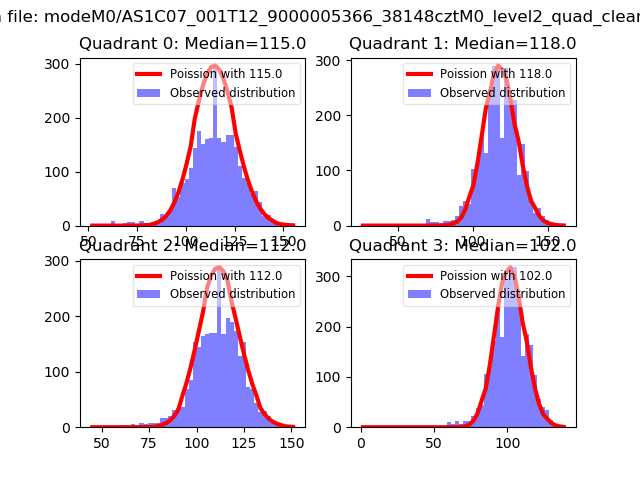 |
 |
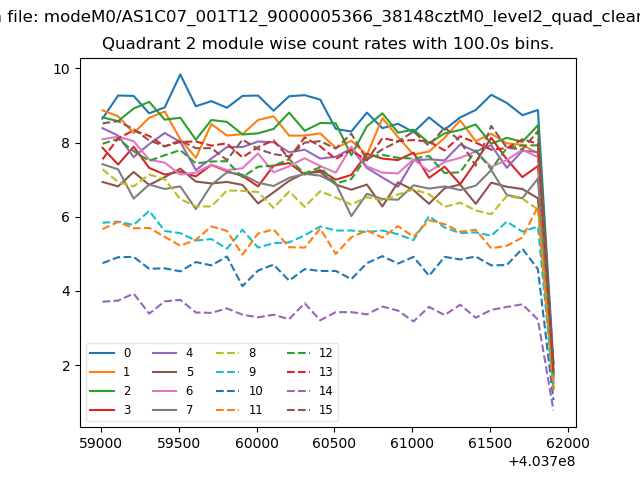
| Quadrant-wise count rates Data is divided into 100 sec bins |
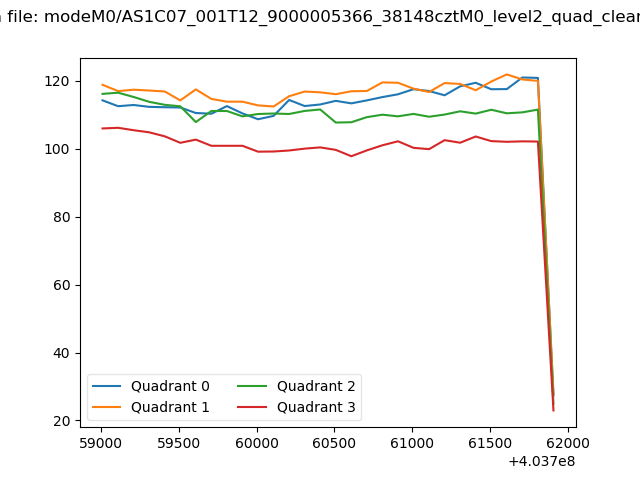 |
|
| Module-wise count rates for Quadrant A Data is divided into 100 sec bins |
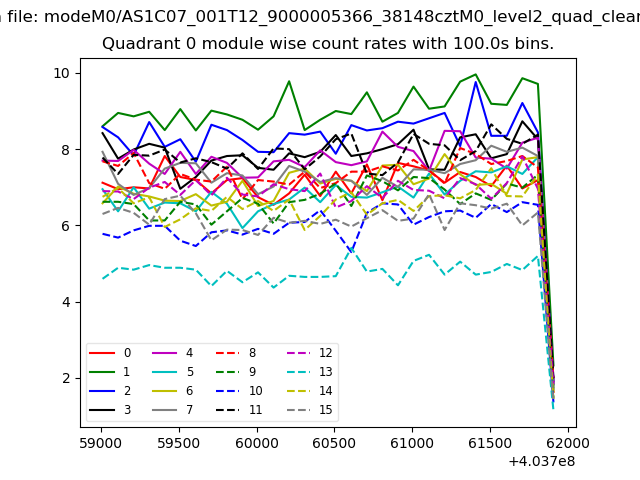 |
 |
| Module-wise count rates for Quadrant B Data is divided into 100 sec bins |
 |
 |
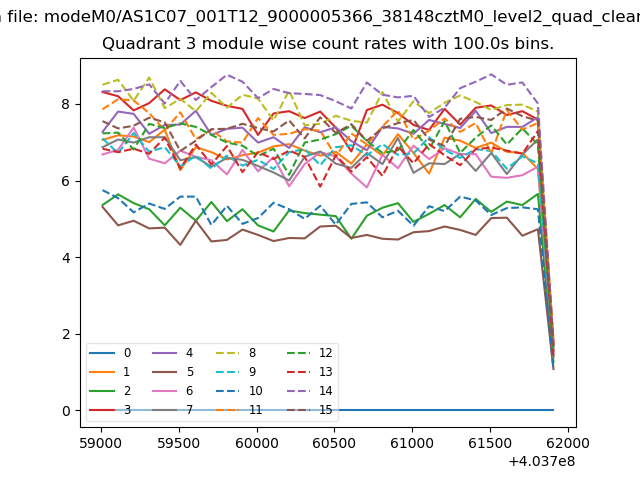
| Module-wise count rates for Quadrant C Data is divided into 100 sec bins |
 |
 |
| Module-wise count rates for Quadrant D Data is divided into 100 sec bins |
 |
 |
| Parameter | Plot |
|---|---|
| CZT HV Monitor |  |
| D_VDD | 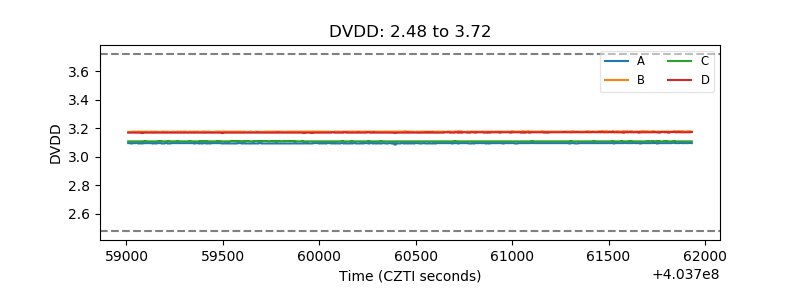 |
| Temperature 1 | 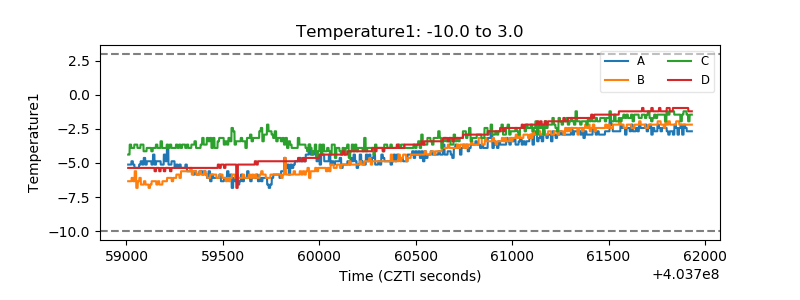 |
| Veto HV Monitor | 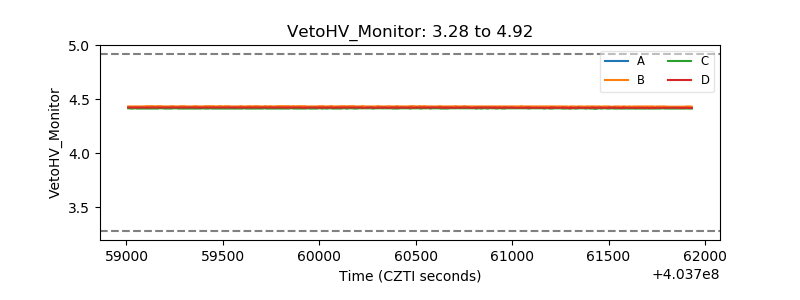 |
| Veto LLD | 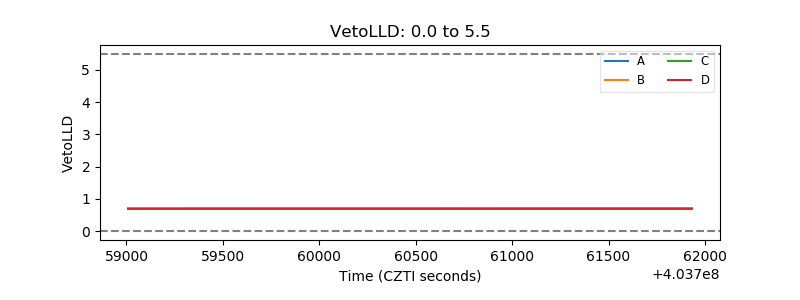 |
| Alpha Counter | 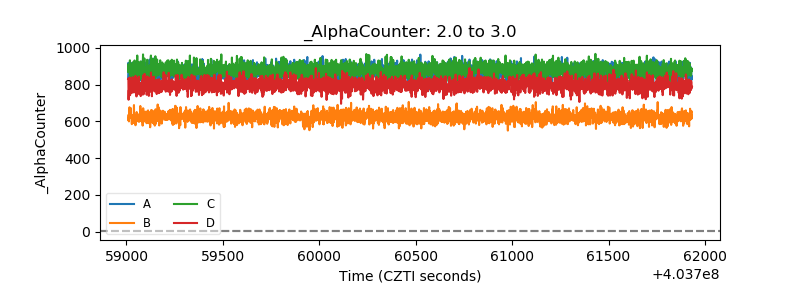 |
| _CPM_Rate | 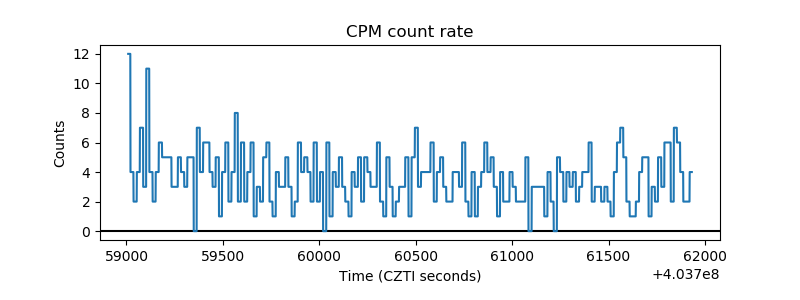 |
| CZT Counter | 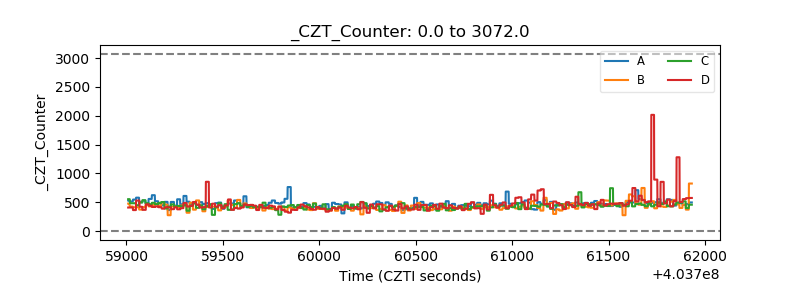 |
| +2.5 Volts monitor | 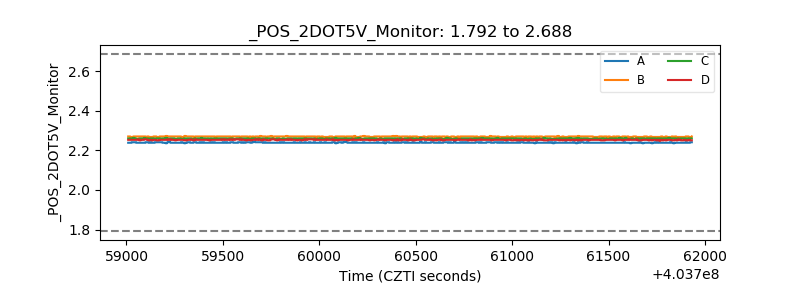 |
| +5 Volts monitor | 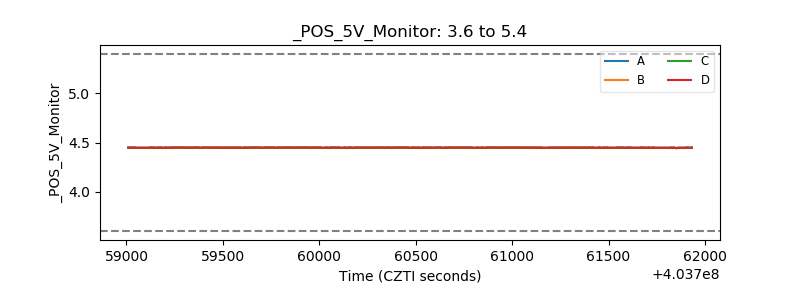 |
| _ROLL_ROT | 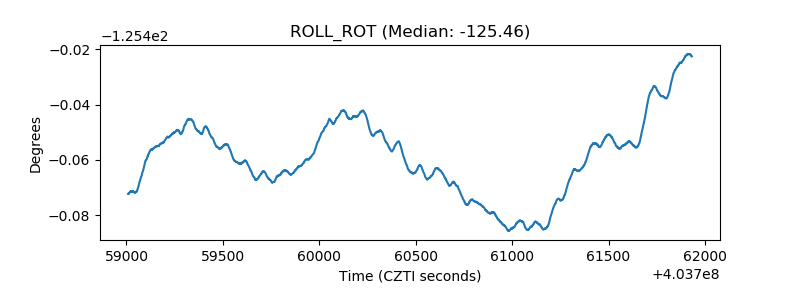 |
| _Roll_DEC | 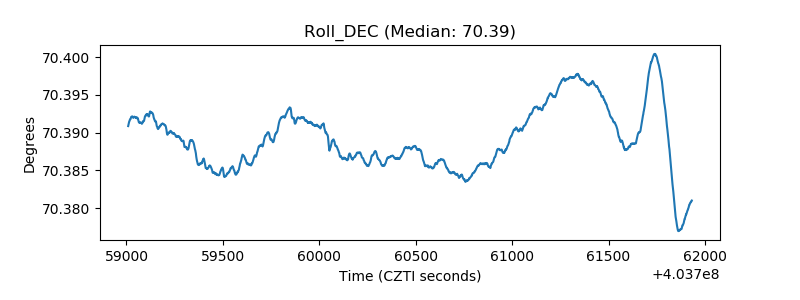 |
| _Roll_RA | 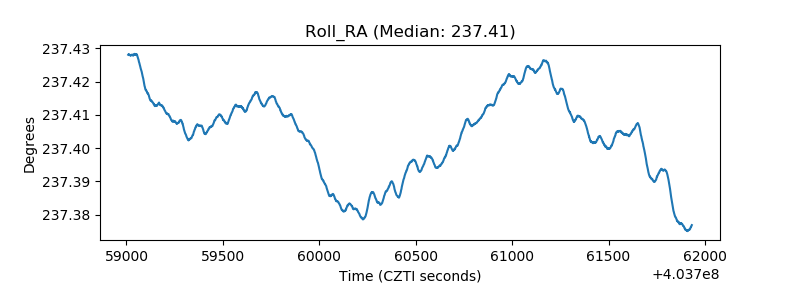 |
| Veto Counter | 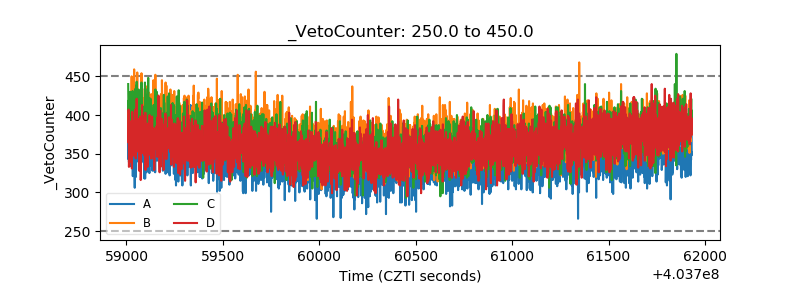 |