| Param | Original file | Final file |
|---|---|---|
| Filename | modeM0/AS1A07_093T02_9000005368_38147cztM0_level2.fits | modeM0/AS1A07_093T02_9000005368_38147cztM0_level2_quad_clean.evt |
| Size (bytes) | 318,248,640 | 93,873,600 |
| Size | 303.5 MB | 89.5 MB |
| Events in quadrant A | 2,835,393 | 633,769 |
| Events in quadrant B | 2,557,107 | 642,790 |
| Events in quadrant C | 2,669,975 | 615,937 |
| Events in quadrant D | 3,284,132 | 560,232 |
| Mode SS | |||
|---|---|---|---|
| Quadrant | BADHDUFLAG | Total packets | Discarded packets |
| A | 0 | 114 | 0 |
| B | 0 | 114 | 0 |
| C | 0 | 114 | 0 |
| D | 0 | 114 | 0 |
| Mode M9 | |||
|---|---|---|---|
| Quadrant | BADHDUFLAG | Total packets | Discarded packets |
| A | 0 | 30 | 0 |
| B | 0 | 30 | 0 |
| C | 0 | 30 | 0 |
| D | 0 | 31 | 0 |
| Mode M0 | |||
|---|---|---|---|
| Quadrant | BADHDUFLAG | Total packets | Discarded packets |
| A | 0 | 11753 | 3 |
| B | 0 | 11481 | 2 |
| C | 0 | 11312 | 2 |
| D | 0 | 13586 | 2 |
| Quadrant | Total seconds | Saturated seconds | Saturation percentage |
|---|---|---|---|
| A | 5569 | 9 | 0.161609% |
| B | 5569 | 22 | 0.395044% |
| C | 5569 | 3 | 0.053870% |
| D | 5569 | 82 | 1.472437% |
Noise dominated data is calculated using 1-second bins in cleaned event files. If a bin has >2000 counts, and if more than 50% of those come from <1% of pixels, then it is considered to be noise-dominated and hence unusable.
| Quadrant | # 1 sec bins | Bins with >0 counts | Bins with >2000 counts | High rate bins dominated by noise | Noise dominated (total time) | Noise dominated (detector-on time) | Marked lightcurve |
|---|---|---|---|---|---|---|---|
| A | 7152 | 5570 | 4 | 4 | 0.06% | 0.07% | 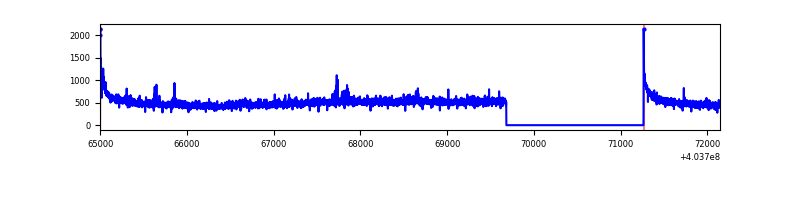 |
| B | 7152 | 5570 | 9 | 9 | 0.13% | 0.16% | 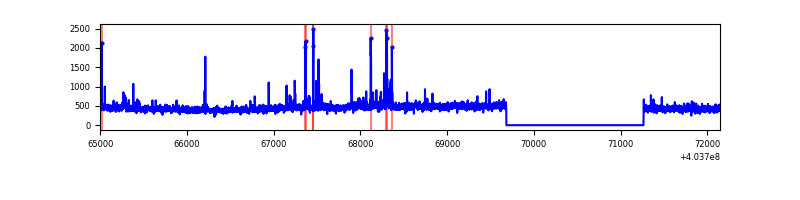 |
| C | 7152 | 5570 | 4 | 4 | 0.06% | 0.07% | 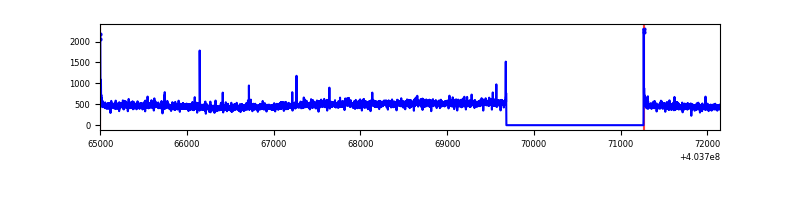 |
| D | 7152 | 5570 | 81 | 81 | 1.13% | 1.45% |  |
Top three noisy pixels from each quadrant. If the there are fewer than three noisy pixels in the level2.evt file, extra rows are filled as -1
| Pixel properties | Quadrant properties | ||||||
|---|---|---|---|---|---|---|---|
| Quadrant | DetID | PixID | Counts | Sigma | Mean | Median | Sigma |
| A | 10 | 83 | 382649 | 3059.45 | 611 | 597 | 124.9 |
| A | 12 | 16 | 40806 | 321.99 | 611 | 597 | 124.9 |
| A | 12 | 189 | 30151 | 236.67 | 611 | 597 | 124.9 |
| B | 4 | 171 | 51886 | 437.64 | 606 | 590 | 117.2 |
| B | 0 | 229 | 42571 | 358.17 | 606 | 590 | 117.2 |
| B | 0 | 186 | 32928 | 275.9 | 606 | 590 | 117.2 |
| C | 15 | 214 | 235101 | 1707.48 | 593 | 595 | 137.3 |
| C | 3 | 233 | 79190 | 572.26 | 593 | 595 | 137.3 |
| C | 0 | 10 | 20226 | 142.94 | 593 | 595 | 137.3 |
| D | 1 | 47 | 185909 | 1307.4 | 588 | 572 | 141.8 |
| D | 13 | 249 | 181451 | 1275.95 | 588 | 572 | 141.8 |
| D | 7 | 223 | 134575 | 945.28 | 588 | 572 | 141.8 |
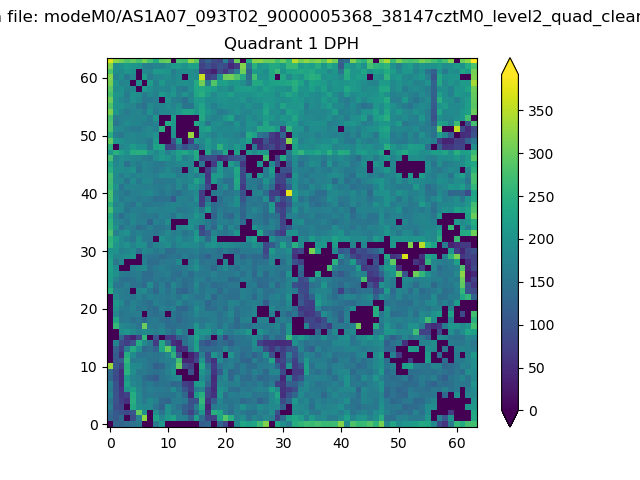
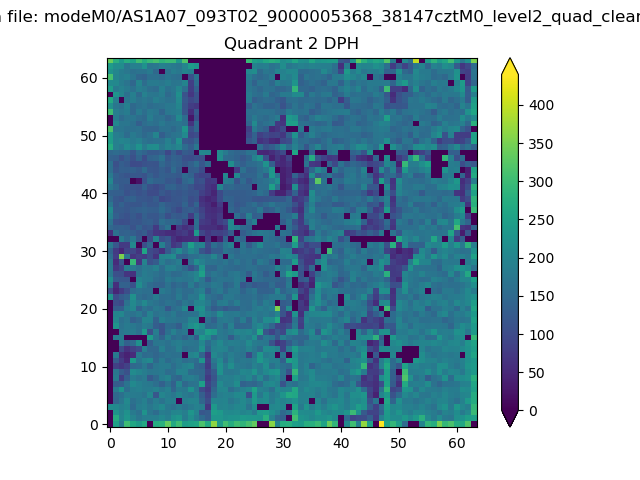
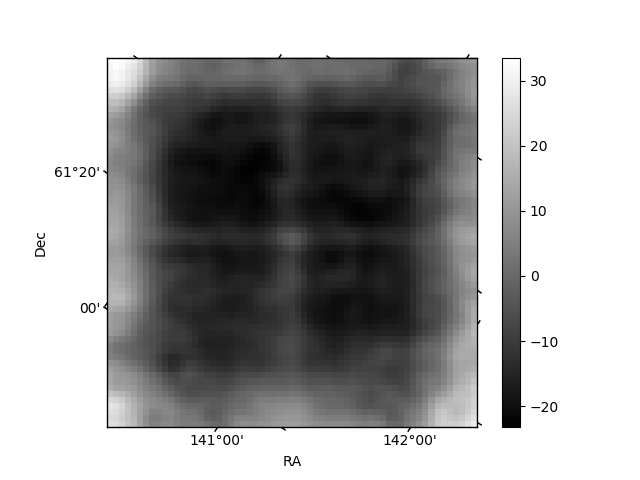
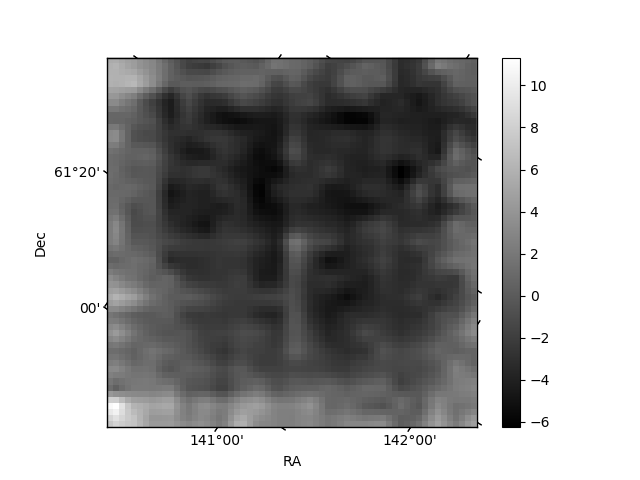
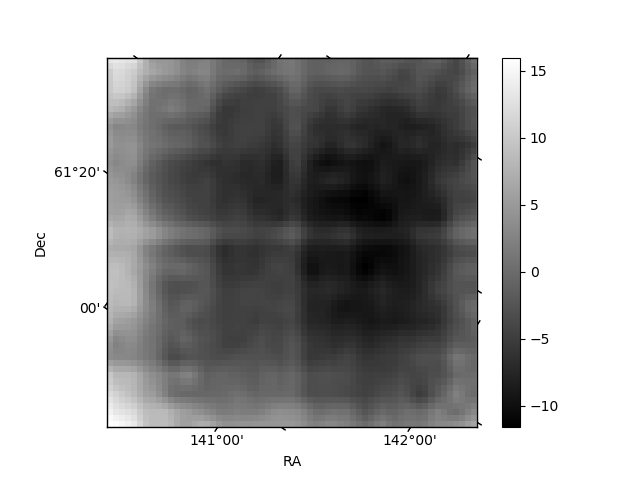
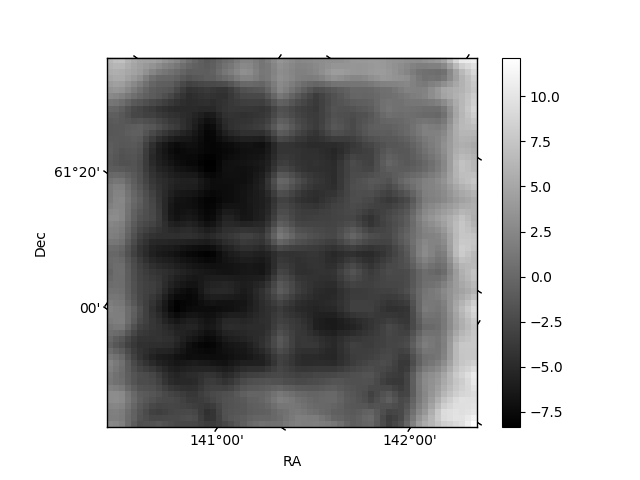
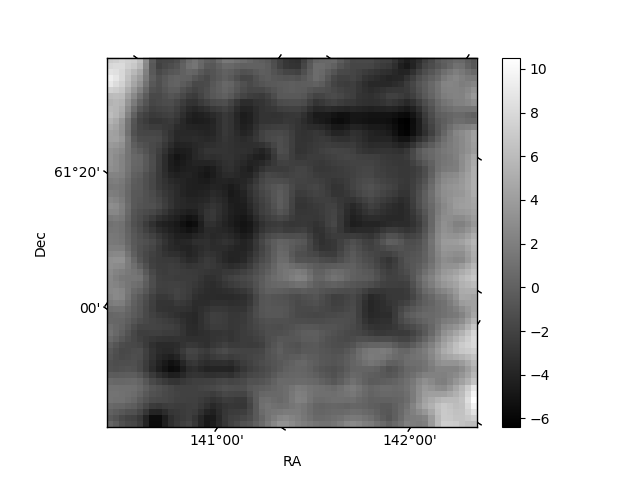
Histogram calculated using DETX and DETY for each event in the final _common_clean file
| Quadrant A | 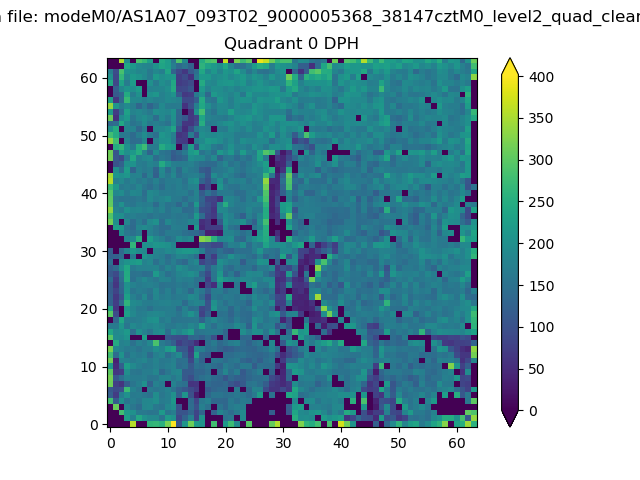 |
 |
Quadrant B |
|---|---|---|---|
| Quadrant D | 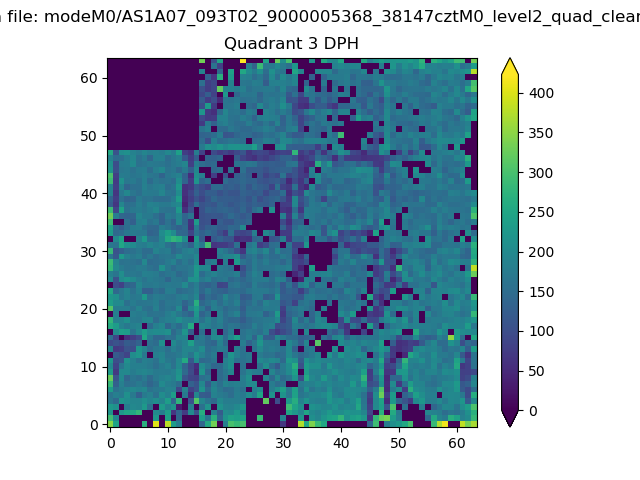 |
 |
Quadrant C |
| Plot type | Count rate plots | Images |
|---|---|---|
| Comparison with Poisson distribution Blue bars denote a histogram of data divided into 1 sec bins. Red curve is a Poisson curve with rate = median count rate of data. |
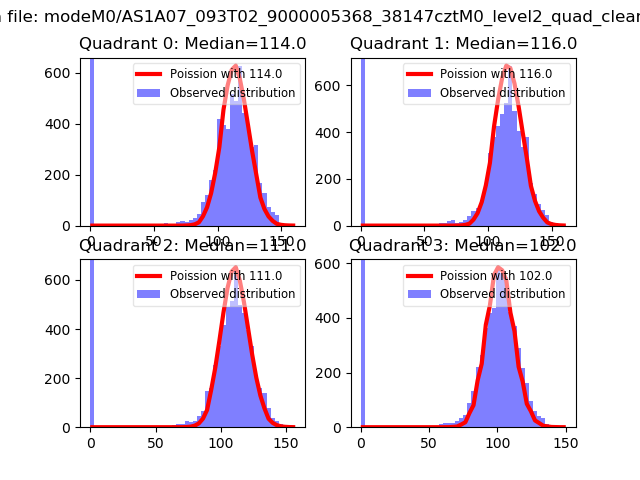 |
 |
| Quadrant-wise count rates Data is divided into 100 sec bins |
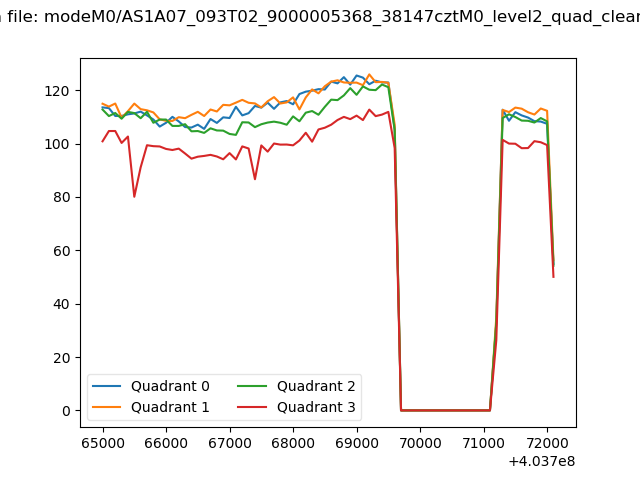 |
|
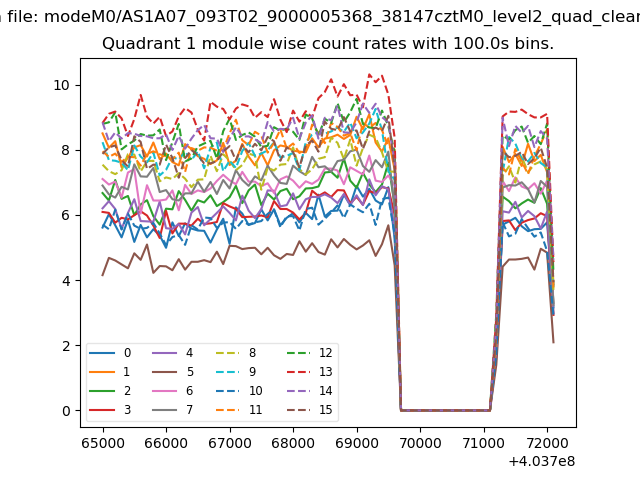
| Module-wise count rates for Quadrant A Data is divided into 100 sec bins |
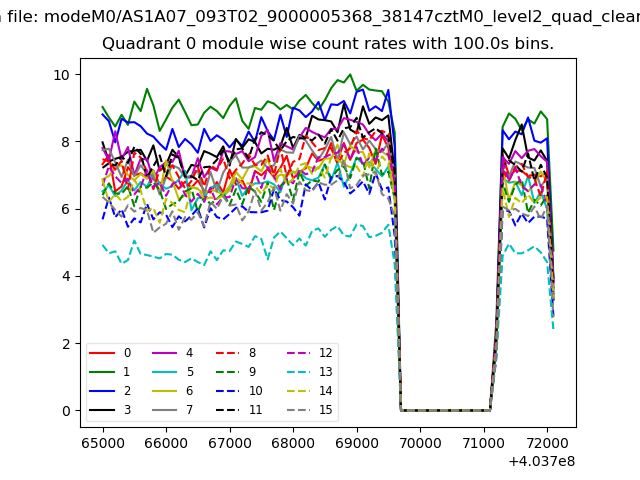 |
 |
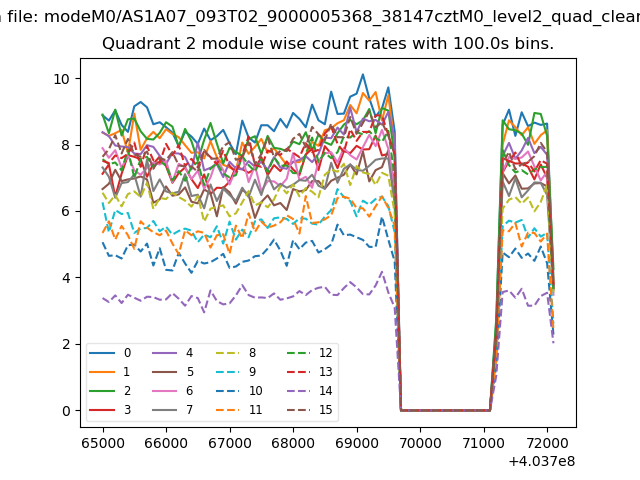
| Module-wise count rates for Quadrant B Data is divided into 100 sec bins |
 |
 |
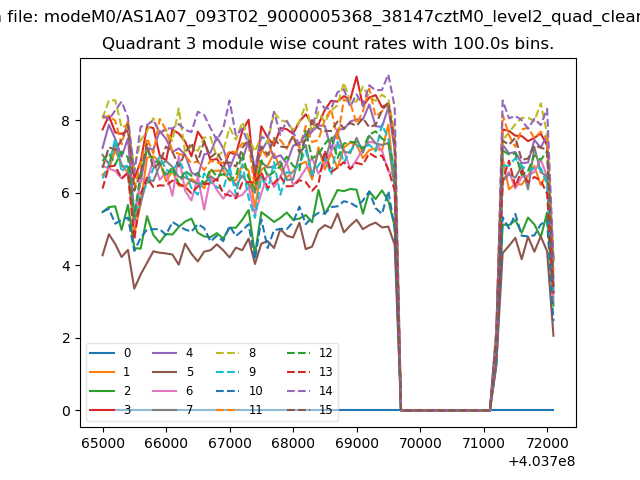
| Module-wise count rates for Quadrant C Data is divided into 100 sec bins |
 |
 |
| Module-wise count rates for Quadrant D Data is divided into 100 sec bins |
 |
 |
| Parameter | Plot |
|---|---|
| CZT HV Monitor | 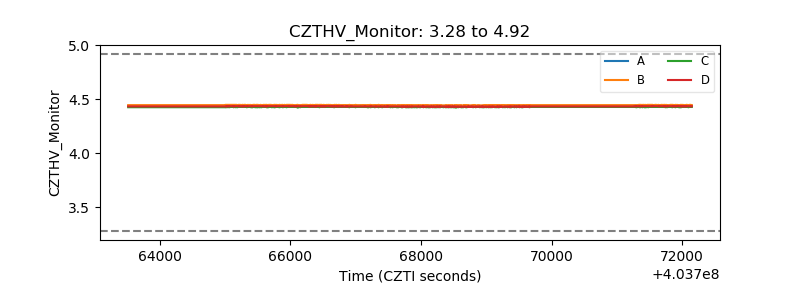 |
| D_VDD | 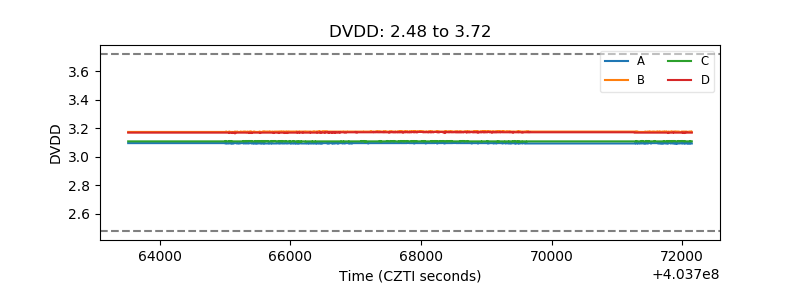 |
| Temperature 1 | 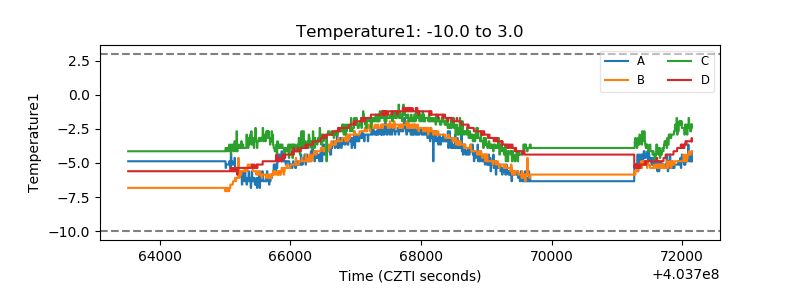 |
| Veto HV Monitor | 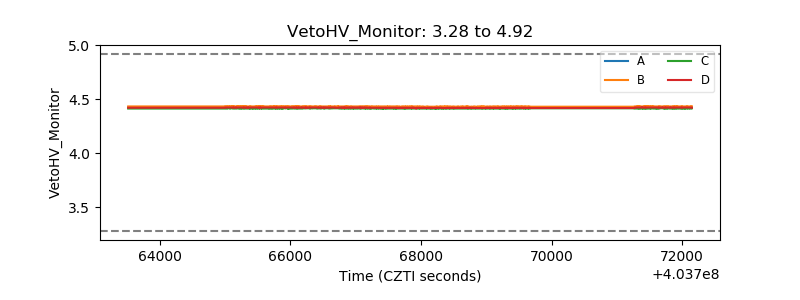 |
| Veto LLD | 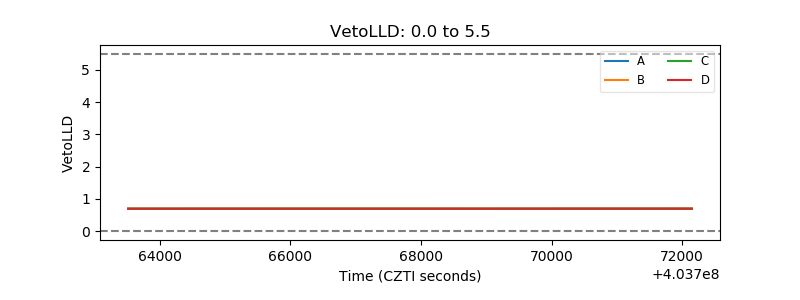 |
| Alpha Counter | 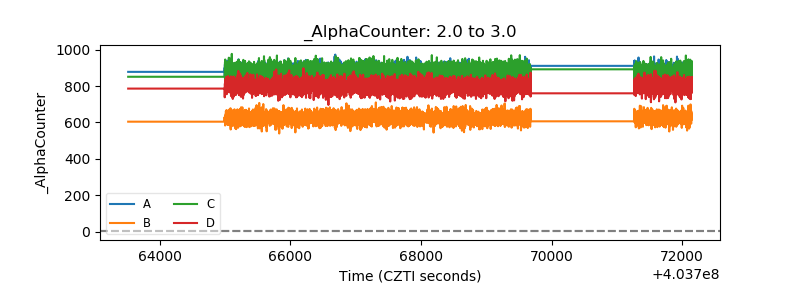 |
| _CPM_Rate | 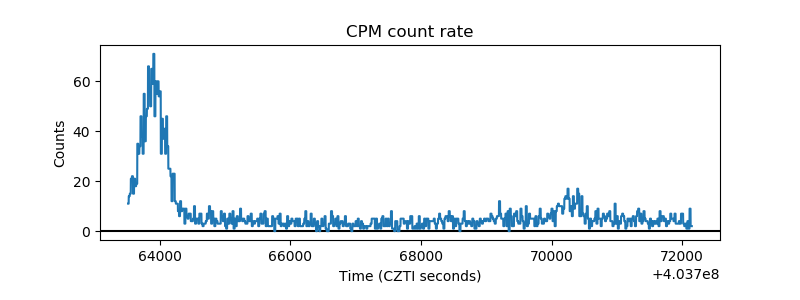 |
| CZT Counter | 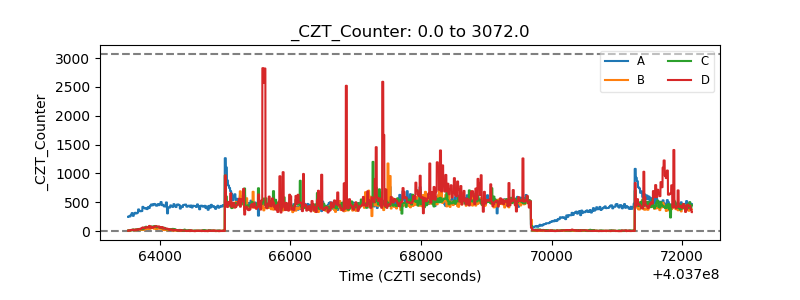 |
| +2.5 Volts monitor | 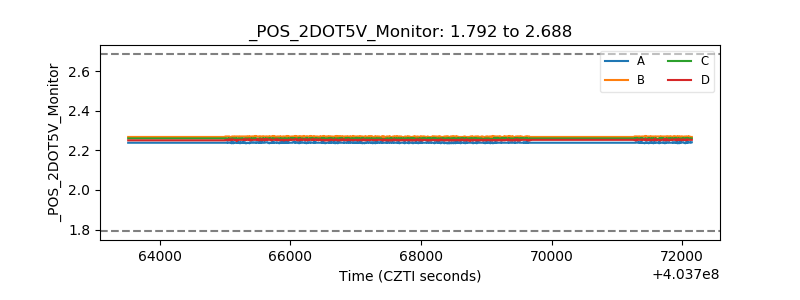 |
| +5 Volts monitor | 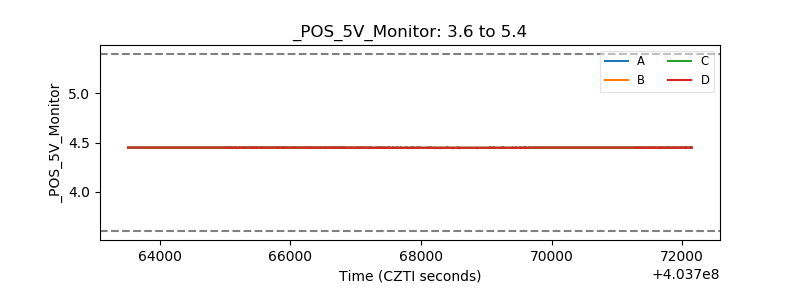 |
| _ROLL_ROT | 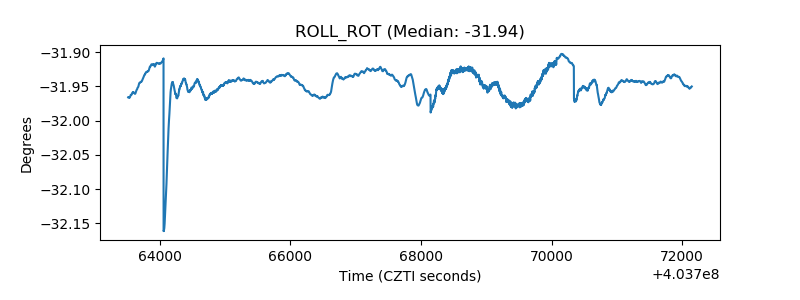 |
| _Roll_DEC | 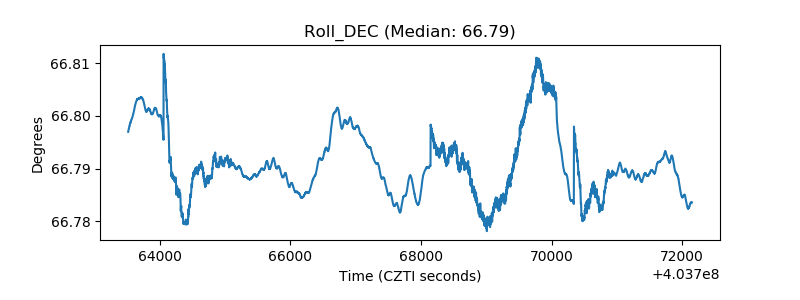 |
| _Roll_RA | 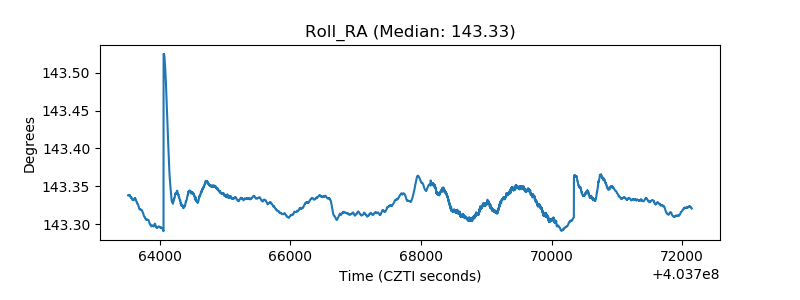 |
| Veto Counter | 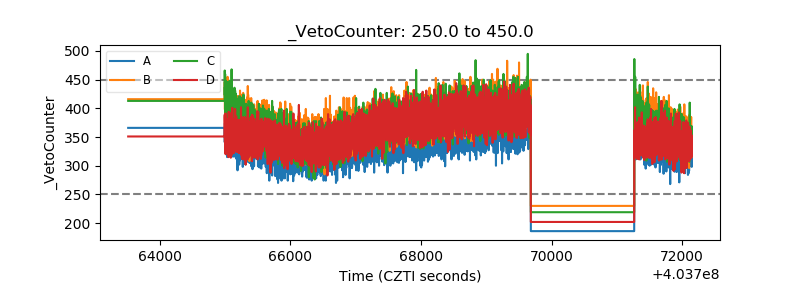 |