| Param | Original file | Final file |
|---|---|---|
| Filename | modeM0/AS1A07_093T02_9000005368_38148cztM0_level2.fits | modeM0/AS1A07_093T02_9000005368_38148cztM0_level2_quad_clean.evt |
| Size (bytes) | 667,226,880 | 187,701,120 |
| Size | 636.3 MB | 179.0 MB |
| Events in quadrant A | 5,690,768 | 1,271,986 |
| Events in quadrant B | 5,194,036 | 1,288,885 |
| Events in quadrant C | 5,376,883 | 1,236,067 |
| Events in quadrant D | 7,570,766 | 1,113,295 |
| Mode SS | |||
|---|---|---|---|
| Quadrant | BADHDUFLAG | Total packets | Discarded packets |
| A | 0 | 230 | 0 |
| B | 0 | 230 | 0 |
| C | 0 | 230 | 0 |
| D | 0 | 230 | 0 |
| Mode M9 | |||
|---|---|---|---|
| Quadrant | BADHDUFLAG | Total packets | Discarded packets |
| A | 0 | 49 | 0 |
| B | 0 | 49 | 0 |
| C | 0 | 49 | 0 |
| D | 0 | 49 | 0 |
| Mode M0 | |||
|---|---|---|---|
| Quadrant | BADHDUFLAG | Total packets | Discarded packets |
| A | 0 | 23402 | 4 |
| B | 0 | 23042 | 3 |
| C | 0 | 22732 | 3 |
| D | 0 | 30163 | 3 |
| Quadrant | Total seconds | Saturated seconds | Saturation percentage |
|---|---|---|---|
| A | 11168 | 12 | 0.107450% |
| B | 11168 | 35 | 0.313395% |
| C | 11168 | 9 | 0.080587% |
| D | 11168 | 289 | 2.587751% |
Noise dominated data is calculated using 1-second bins in cleaned event files. If a bin has >2000 counts, and if more than 50% of those come from <1% of pixels, then it is considered to be noise-dominated and hence unusable.
| Quadrant | # 1 sec bins | Bins with >0 counts | Bins with >2000 counts | High rate bins dominated by noise | Noise dominated (total time) | Noise dominated (detector-on time) | Marked lightcurve |
|---|---|---|---|---|---|---|---|
| A | 16066 | 11171 | 6 | 6 | 0.04% | 0.05% |  |
| B | 16066 | 11171 | 19 | 19 | 0.12% | 0.17% |  |
| C | 16066 | 11171 | 9 | 9 | 0.06% | 0.08% | 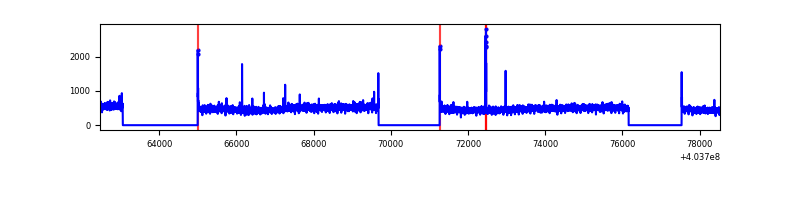 |
| D | 16066 | 11171 | 273 | 273 | 1.70% | 2.44% | 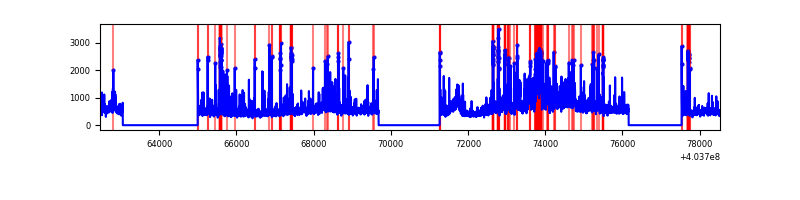 |
Top three noisy pixels from each quadrant. If the there are fewer than three noisy pixels in the level2.evt file, extra rows are filled as -1
| Pixel properties | Quadrant properties | ||||||
|---|---|---|---|---|---|---|---|
| Quadrant | DetID | PixID | Counts | Sigma | Mean | Median | Sigma |
| A | 10 | 83 | 704217 | 2789.12 | 1244 | 1218 | 252.1 |
| A | 12 | 189 | 86851 | 339.74 | 1244 | 1218 | 252.1 |
| A | 12 | 16 | 54178 | 210.12 | 1244 | 1218 | 252.1 |
| B | 4 | 171 | 113115 | 477.14 | 1233 | 1200 | 234.6 |
| B | 0 | 229 | 70940 | 297.33 | 1233 | 1200 | 234.6 |
| B | 5 | 172 | 35471 | 146.11 | 1233 | 1200 | 234.6 |
| C | 15 | 214 | 466841 | 1673.05 | 1210 | 1216 | 278.3 |
| C | 3 | 233 | 107492 | 381.86 | 1210 | 1216 | 278.3 |
| C | 0 | 239 | 47582 | 166.6 | 1210 | 1216 | 278.3 |
| D | 12 | 235 | 1258799 | 4394.27 | 1197 | 1166 | 286.2 |
| D | 1 | 47 | 357723 | 1245.84 | 1197 | 1166 | 286.2 |
| D | 13 | 249 | 317466 | 1105.18 | 1197 | 1166 | 286.2 |
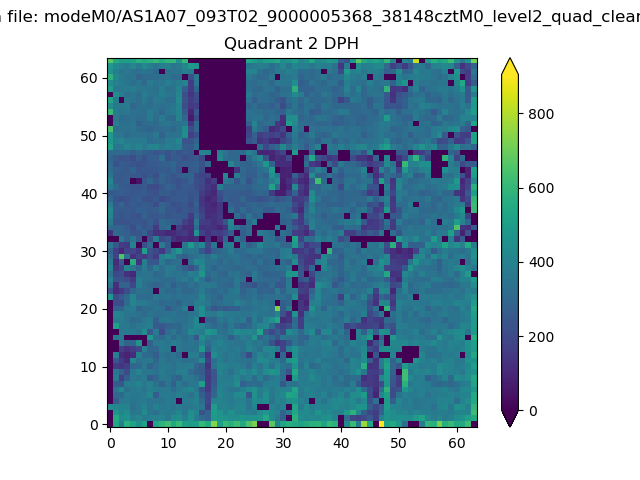
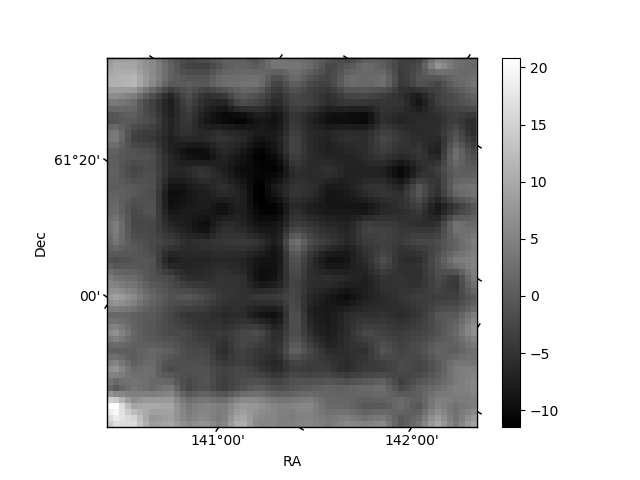
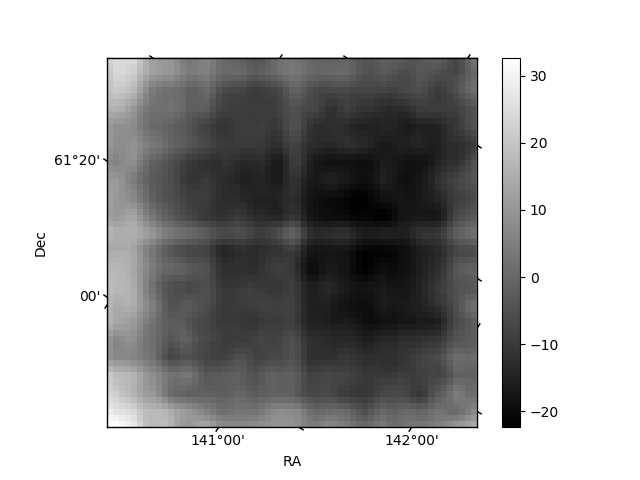
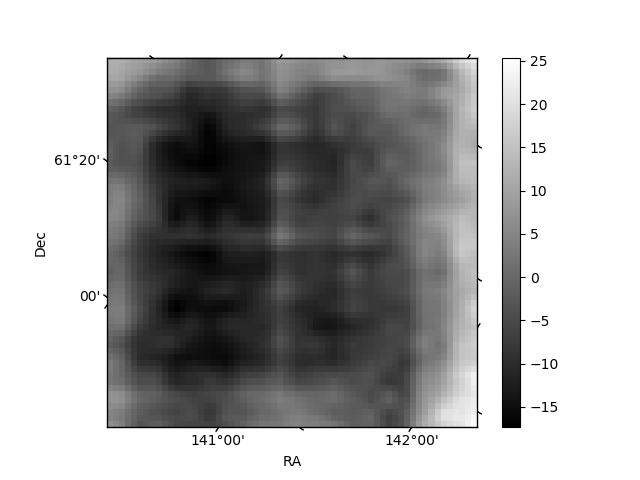
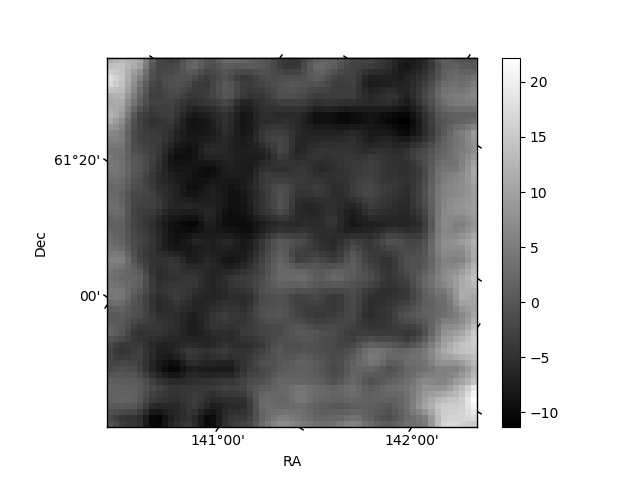
Histogram calculated using DETX and DETY for each event in the final _common_clean file
| Quadrant A | 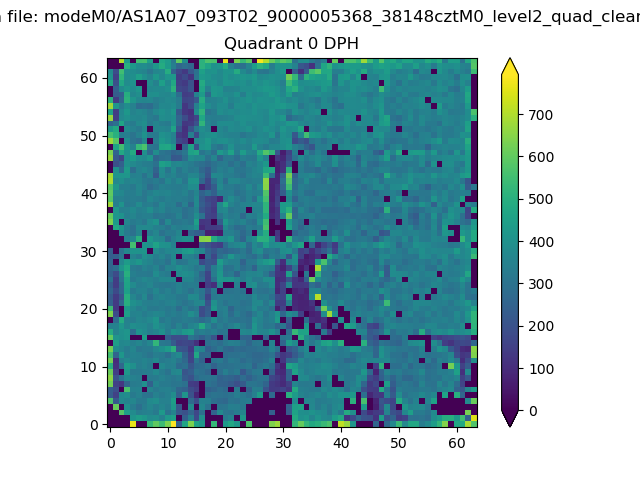 |
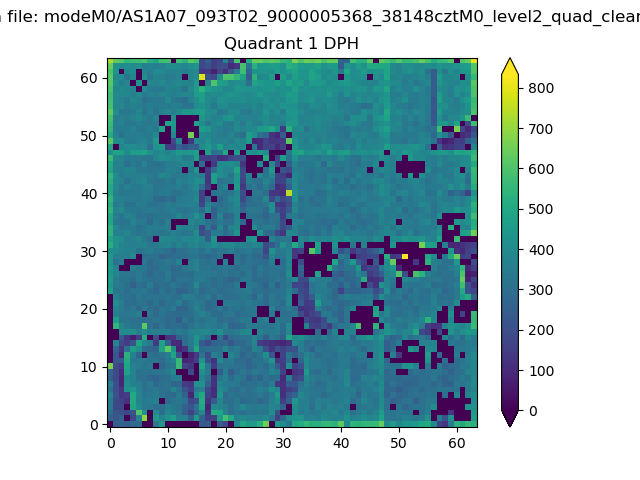 |
Quadrant B |
|---|---|---|---|
| Quadrant D | 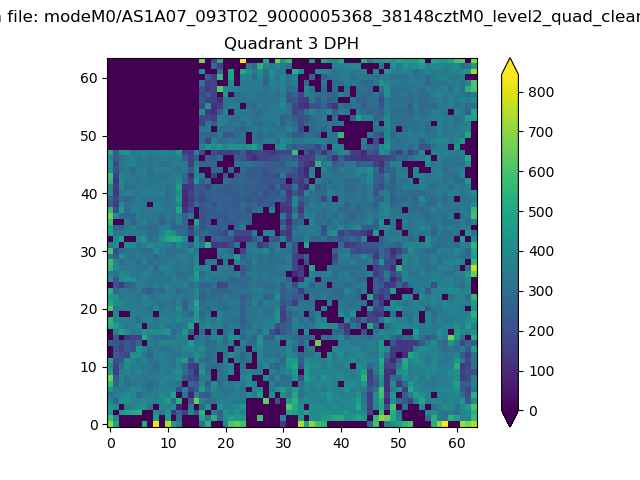 |
 |
Quadrant C |
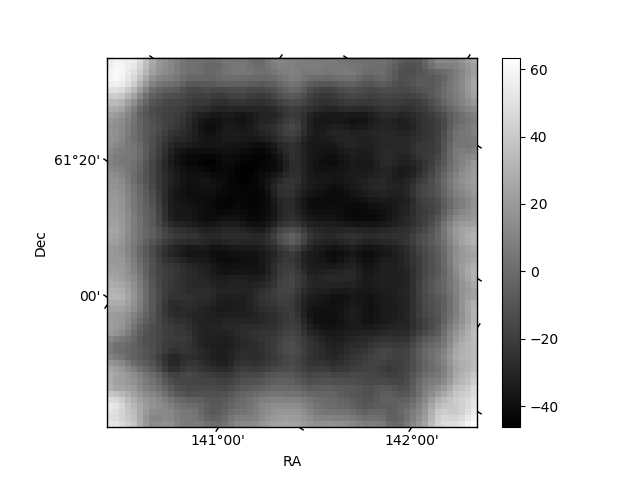
| Plot type | Count rate plots | Images |
|---|---|---|
| Comparison with Poisson distribution Blue bars denote a histogram of data divided into 1 sec bins. Red curve is a Poisson curve with rate = median count rate of data. |
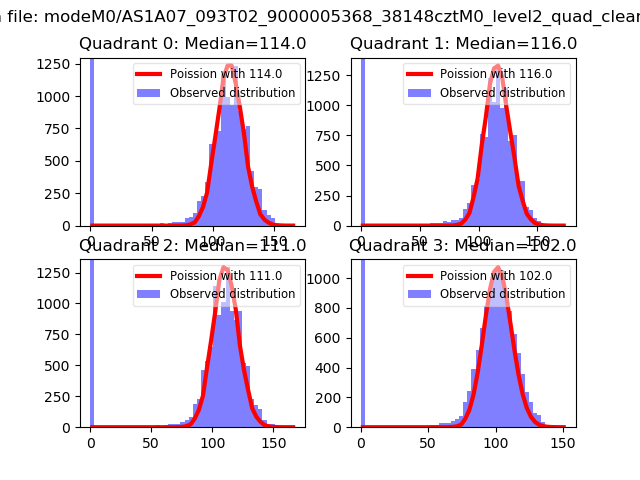 |
 |
| Quadrant-wise count rates Data is divided into 100 sec bins |
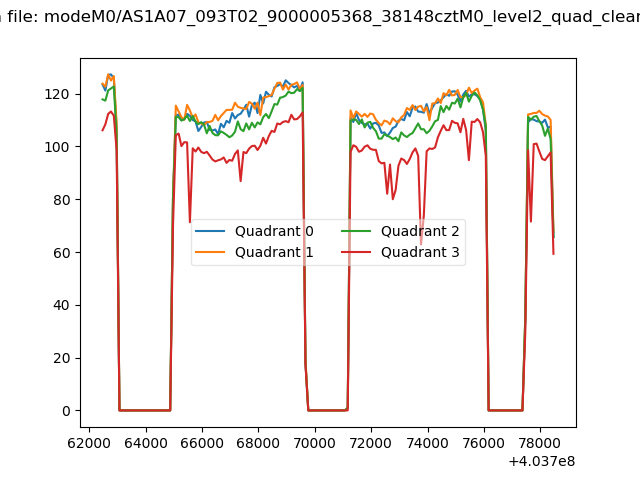 |
|
| Module-wise count rates for Quadrant A Data is divided into 100 sec bins |
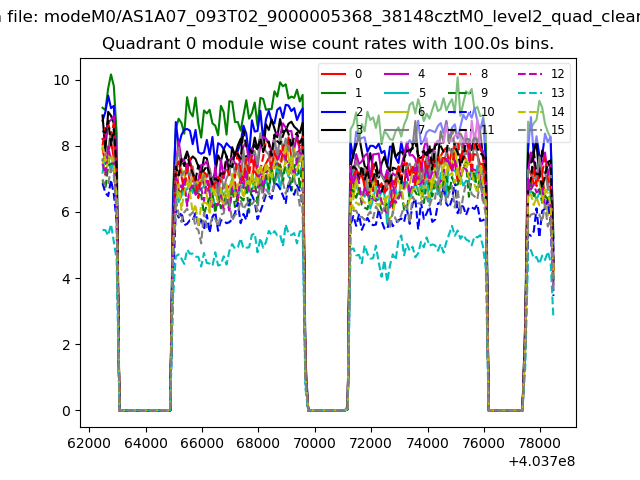 |
 |
| Module-wise count rates for Quadrant B Data is divided into 100 sec bins |
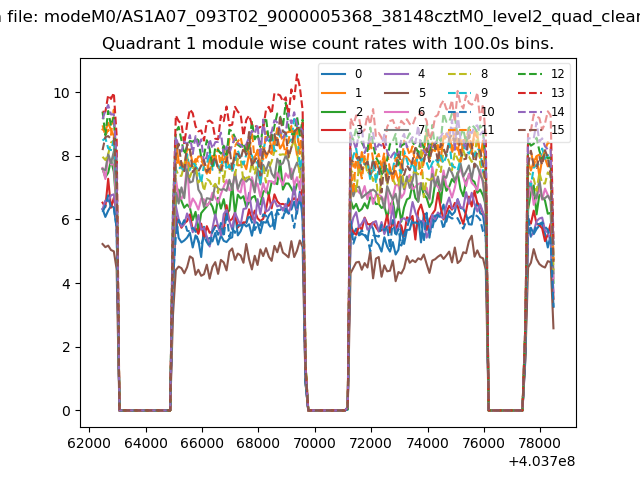 |
 |
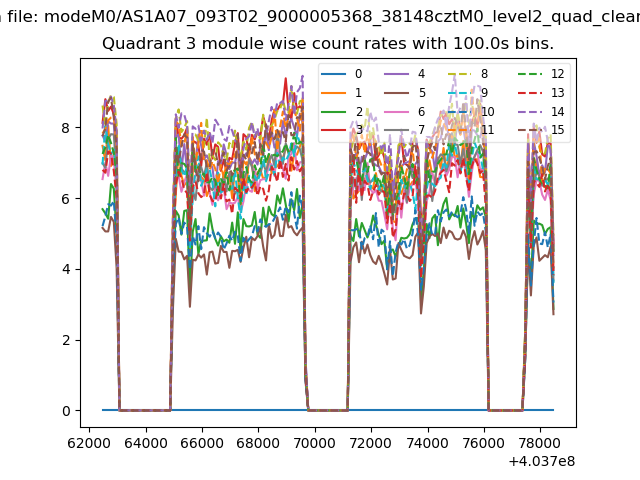
| Module-wise count rates for Quadrant C Data is divided into 100 sec bins |
 |
 |
| Module-wise count rates for Quadrant D Data is divided into 100 sec bins |
 |
 |
| Parameter | Plot |
|---|---|
| CZT HV Monitor |  |
| D_VDD | 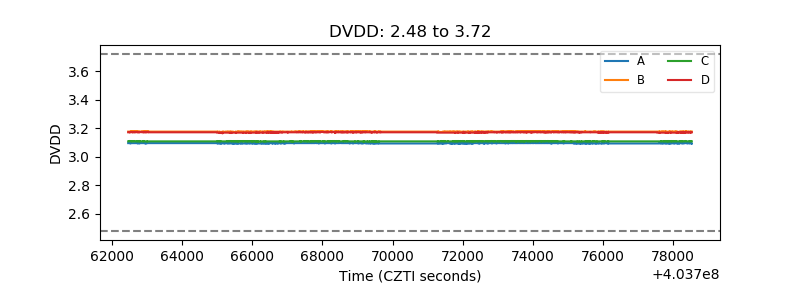 |
| Temperature 1 | 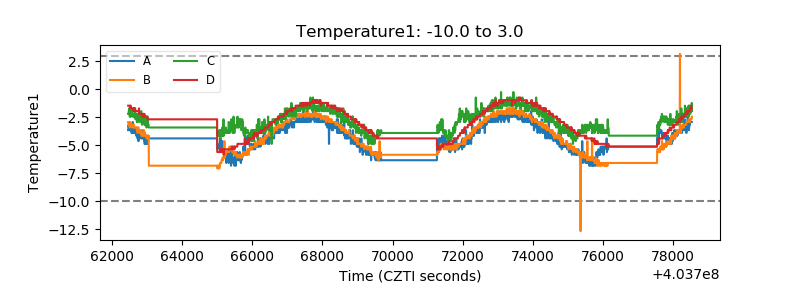 |
| Veto HV Monitor | 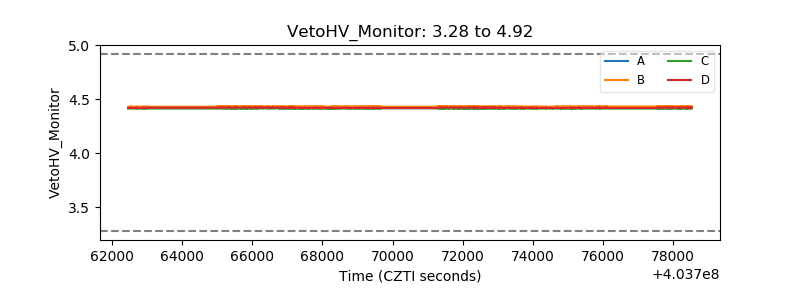 |
| Veto LLD | 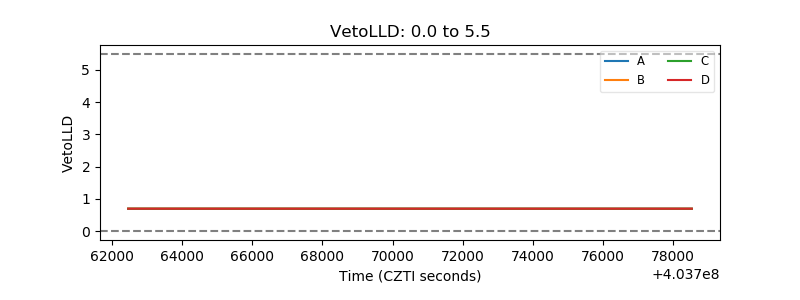 |
| Alpha Counter | 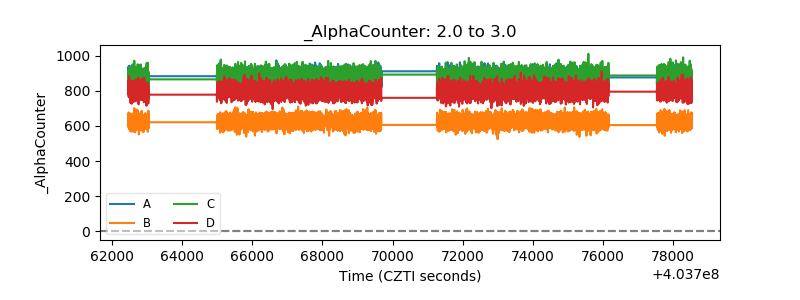 |
| _CPM_Rate | 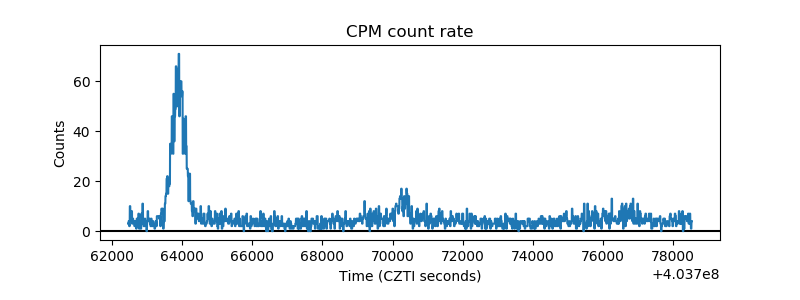 |
| CZT Counter | 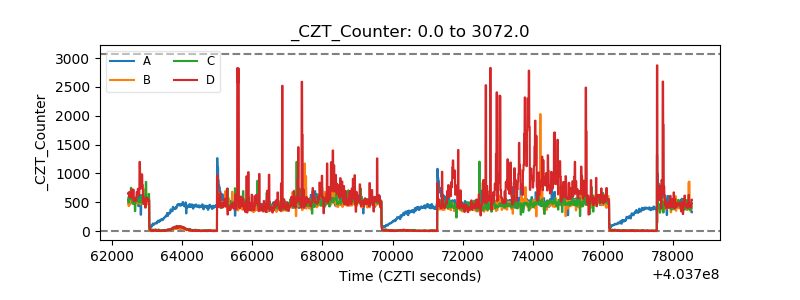 |
| +2.5 Volts monitor | 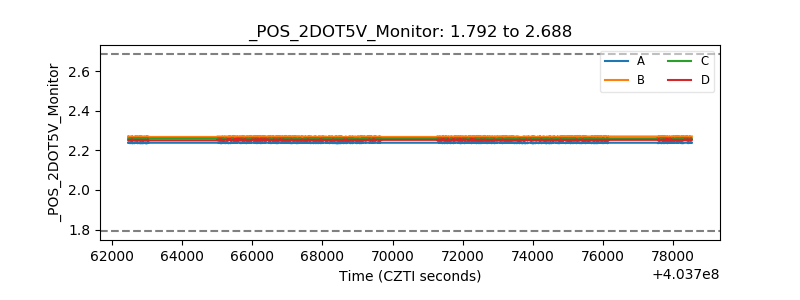 |
| +5 Volts monitor | 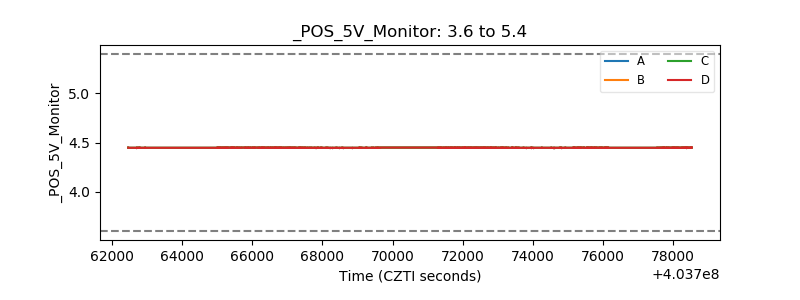 |
| _ROLL_ROT | 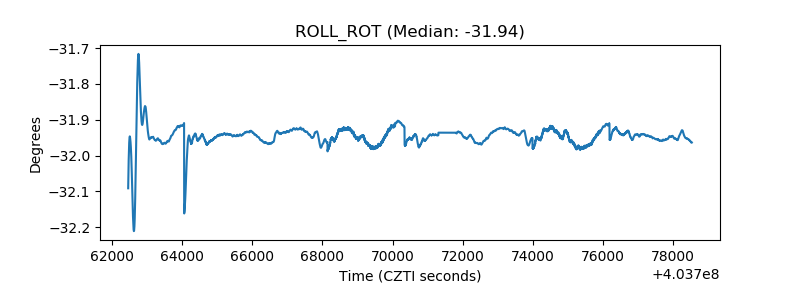 |
| _Roll_DEC | 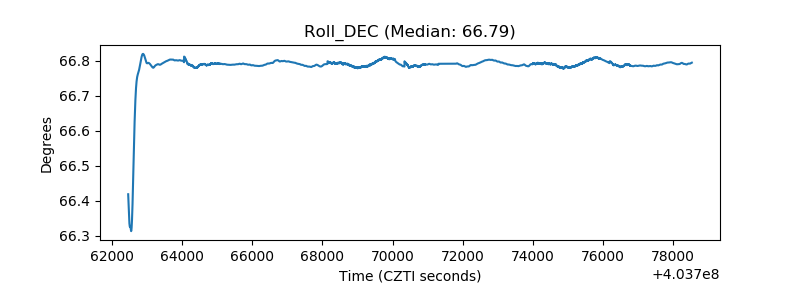 |
| _Roll_RA | 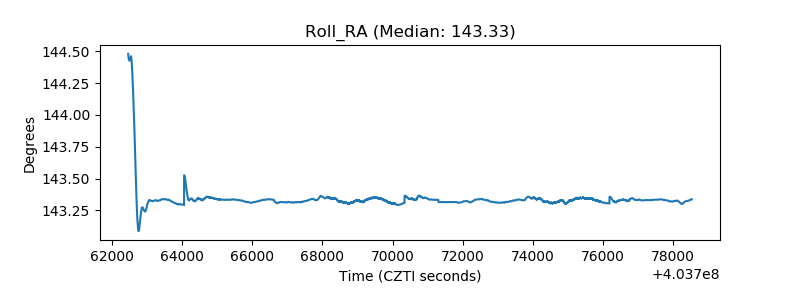 |
| Veto Counter | 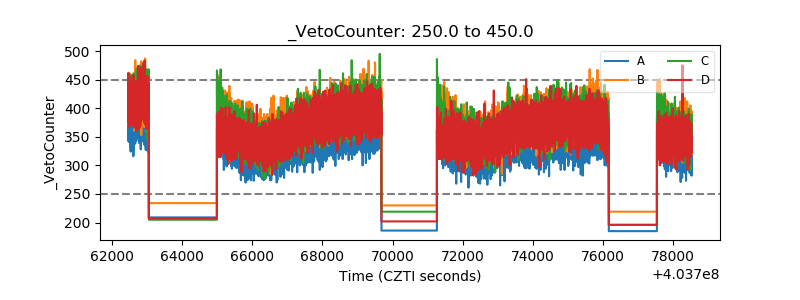 |