| Param | Original file | Final file |
|---|---|---|
| Filename | modeM0/AS1A07_093T02_9000005368_38149cztM0_level2.fits | modeM0/AS1A07_093T02_9000005368_38149cztM0_level2_quad_clean.evt |
| Size (bytes) | 424,857,600 | 97,404,480 |
| Size | 405.2 MB | 92.9 MB |
| Events in quadrant A | 3,247,088 | 676,419 |
| Events in quadrant B | 4,708,463 | 600,267 |
| Events in quadrant C | 2,825,783 | 657,883 |
| Events in quadrant D | 4,477,342 | 594,327 |
| Mode SS | |||
|---|---|---|---|
| Quadrant | BADHDUFLAG | Total packets | Discarded packets |
| A | 0 | 122 | 0 |
| B | 0 | 122 | 0 |
| C | 0 | 122 | 0 |
| D | 0 | 122 | 0 |
| Mode M9 | |||
|---|---|---|---|
| Quadrant | BADHDUFLAG | Total packets | Discarded packets |
| A | 0 | 13 | 0 |
| B | 0 | 13 | 0 |
| C | 0 | 13 | 0 |
| D | 0 | 14 | 0 |
| Mode M0 | |||
|---|---|---|---|
| Quadrant | BADHDUFLAG | Total packets | Discarded packets |
| A | 0 | 13125 | 3 |
| B | 0 | 18026 | 2 |
| C | 0 | 12118 | 2 |
| D | 0 | 17617 | 2 |
| Quadrant | Total seconds | Saturated seconds | Saturation percentage |
|---|---|---|---|
| A | 6019 | 6 | 0.099684% |
| B | 6019 | 793 | 13.174946% |
| C | 6019 | 4 | 0.066456% |
| D | 6019 | 148 | 2.458880% |
Noise dominated data is calculated using 1-second bins in cleaned event files. If a bin has >2000 counts, and if more than 50% of those come from <1% of pixels, then it is considered to be noise-dominated and hence unusable.
| Quadrant | # 1 sec bins | Bins with >0 counts | Bins with >2000 counts | High rate bins dominated by noise | Noise dominated (total time) | Noise dominated (detector-on time) | Marked lightcurve |
|---|---|---|---|---|---|---|---|
| A | 7302 | 6020 | 2 | 2 | 0.03% | 0.03% | 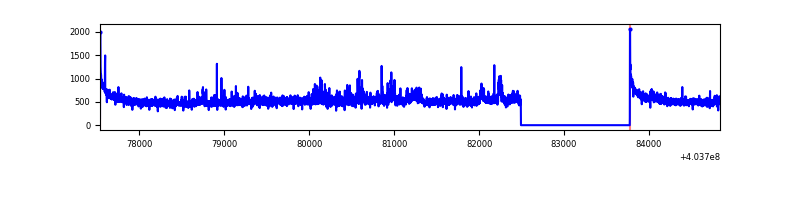 |
| B | 7302 | 6020 | 751 | 751 | 10.28% | 12.48% | 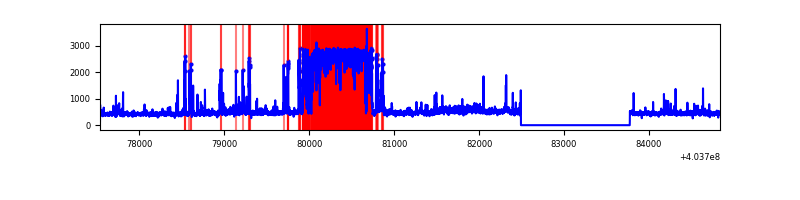 |
| C | 7302 | 6020 | 2 | 2 | 0.03% | 0.03% | 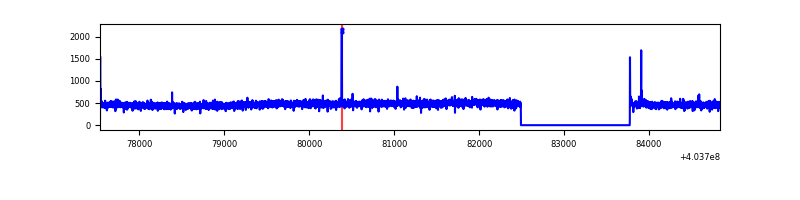 |
| D | 7302 | 6020 | 156 | 156 | 2.14% | 2.59% | 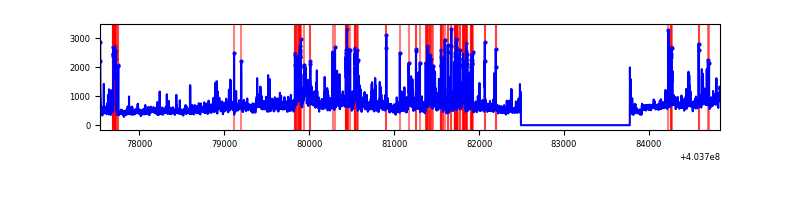 |
Top three noisy pixels from each quadrant. If the there are fewer than three noisy pixels in the level2.evt file, extra rows are filled as -1
| Pixel properties | Quadrant properties | ||||||
|---|---|---|---|---|---|---|---|
| Quadrant | DetID | PixID | Counts | Sigma | Mean | Median | Sigma |
| A | 10 | 83 | 410991 | 3003.91 | 668 | 655 | 136.6 |
| A | 15 | 223 | 128757 | 937.78 | 668 | 655 | 136.6 |
| A | 12 | 16 | 48234 | 348.31 | 668 | 655 | 136.6 |
| B | 5 | 184 | 1915259 | 16306.43 | 608 | 591 | 117.4 |
| B | 0 | 229 | 152699 | 1295.44 | 608 | 591 | 117.4 |
| B | 4 | 171 | 118925 | 1007.8 | 608 | 591 | 117.4 |
| C | 15 | 214 | 253478 | 1681.75 | 650 | 655 | 150.3 |
| C | 3 | 233 | 13362 | 84.53 | 650 | 655 | 150.3 |
| C | 2 | 16 | 10189 | 63.42 | 650 | 655 | 150.3 |
| D | 1 | 20 | 435756 | 2785.34 | 641 | 623 | 156.2 |
| D | 1 | 52 | 301913 | 1928.59 | 641 | 623 | 156.2 |
| D | 12 | 235 | 264922 | 1691.81 | 641 | 623 | 156.2 |
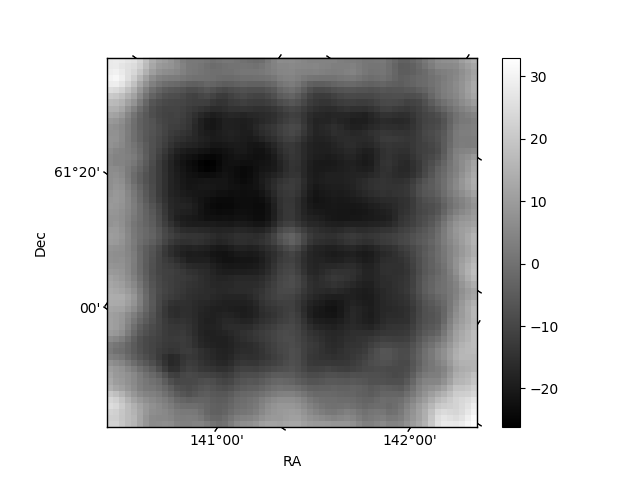
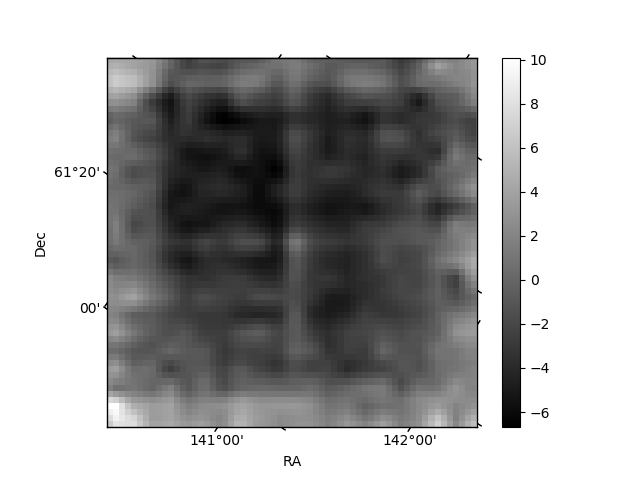
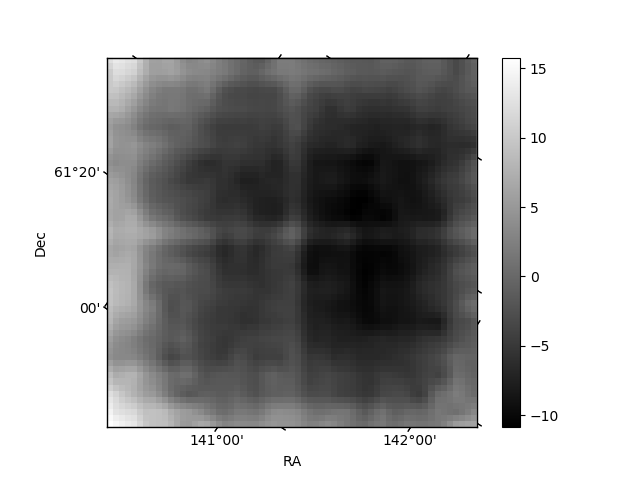
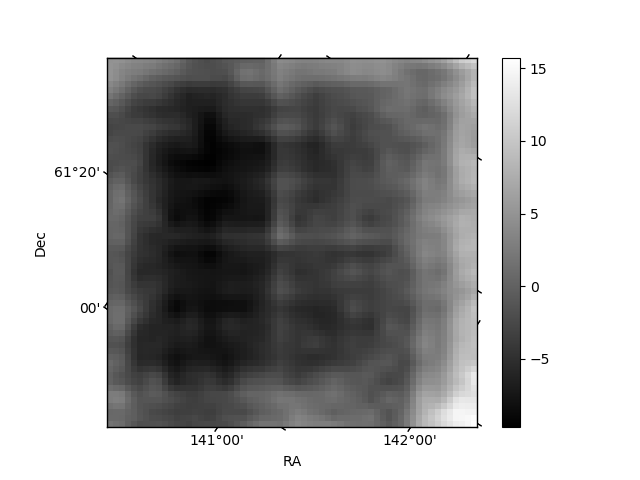
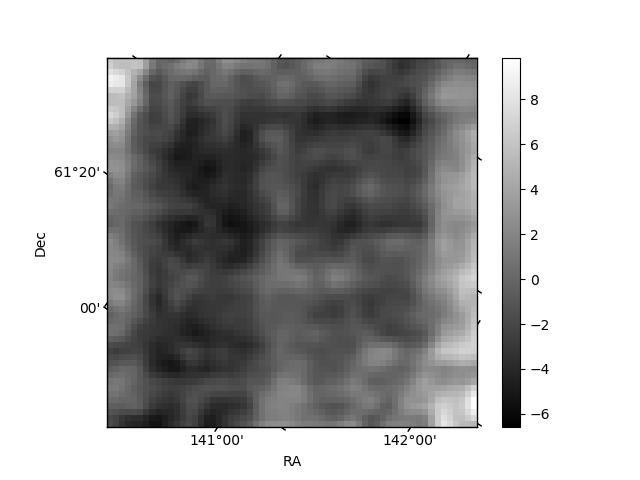
Histogram calculated using DETX and DETY for each event in the final _common_clean file
| Quadrant A | 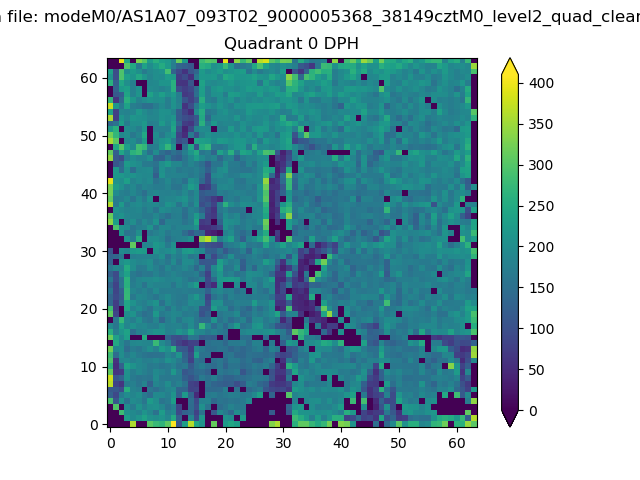 |
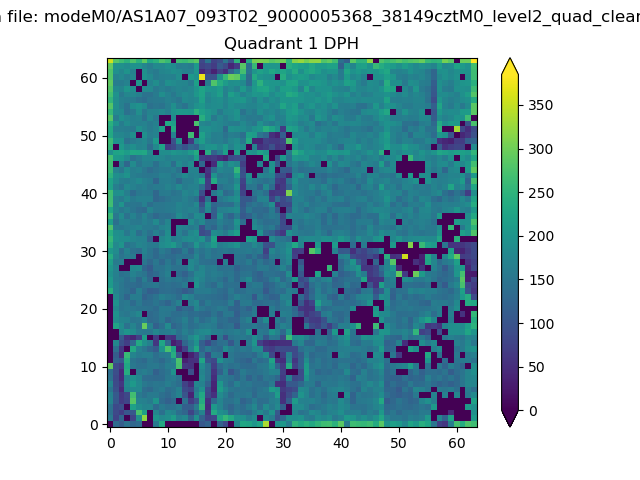 |
Quadrant B |
|---|---|---|---|
| Quadrant D | 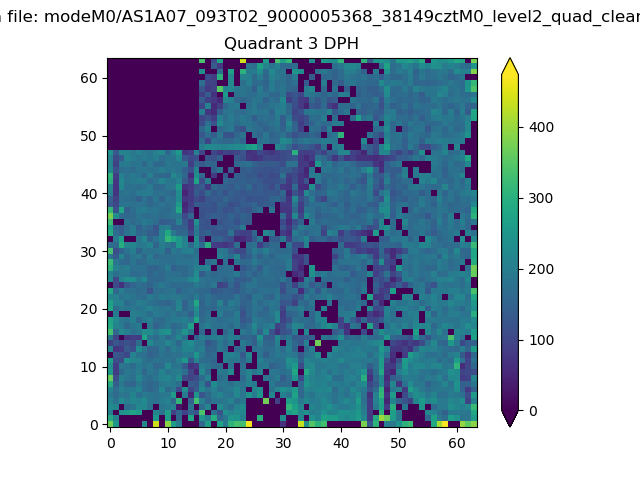 |
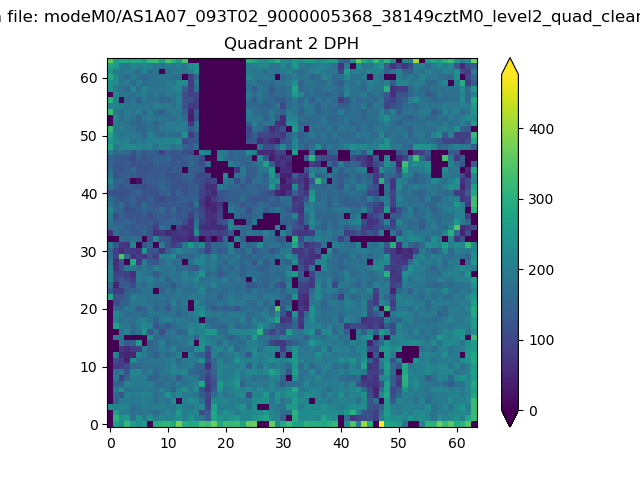 |
Quadrant C |
| Plot type | Count rate plots | Images |
|---|---|---|
| Comparison with Poisson distribution Blue bars denote a histogram of data divided into 1 sec bins. Red curve is a Poisson curve with rate = median count rate of data. |
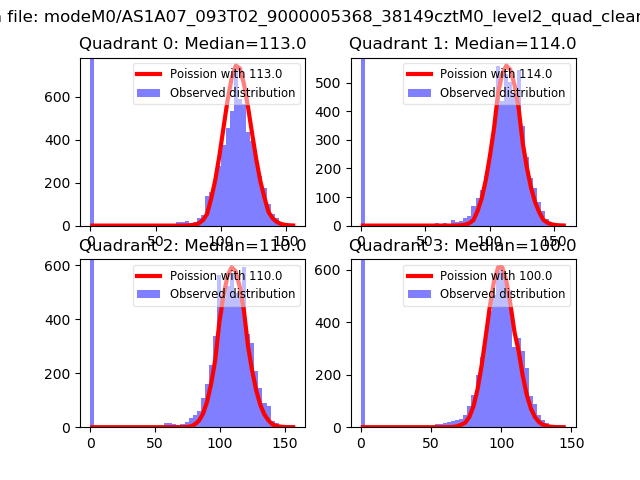 |
 |
| Quadrant-wise count rates Data is divided into 100 sec bins |
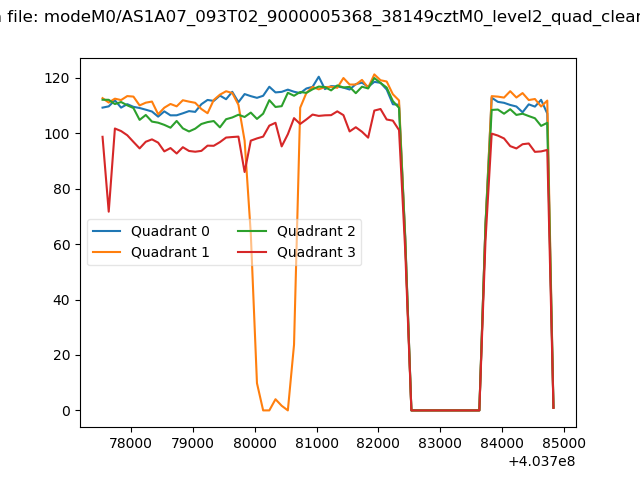 |
|
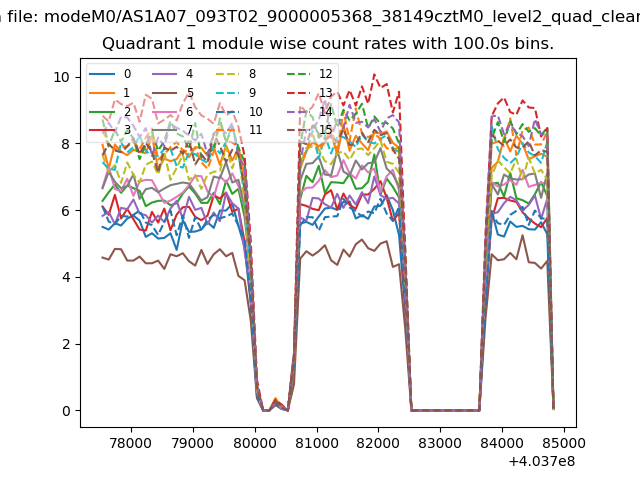
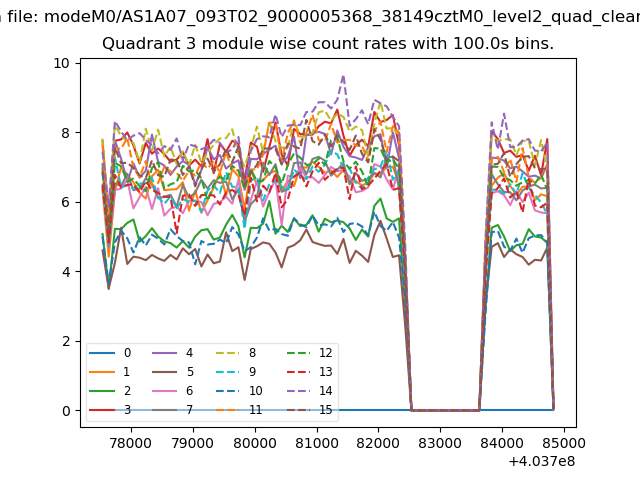
| Module-wise count rates for Quadrant A Data is divided into 100 sec bins |
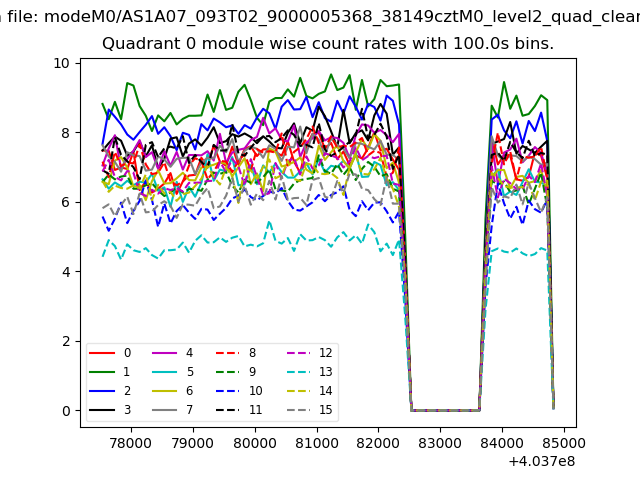 |
 |
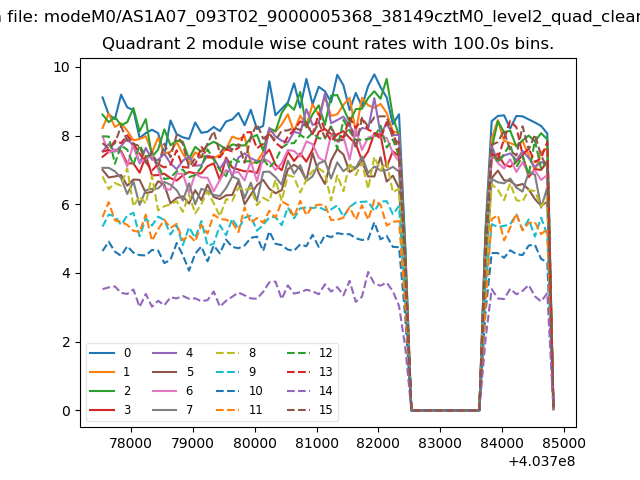
| Module-wise count rates for Quadrant B Data is divided into 100 sec bins |
 |
 |
| Module-wise count rates for Quadrant C Data is divided into 100 sec bins |
 |
 |
| Module-wise count rates for Quadrant D Data is divided into 100 sec bins |
 |
 |
| Parameter | Plot |
|---|---|
| CZT HV Monitor |  |
| D_VDD | 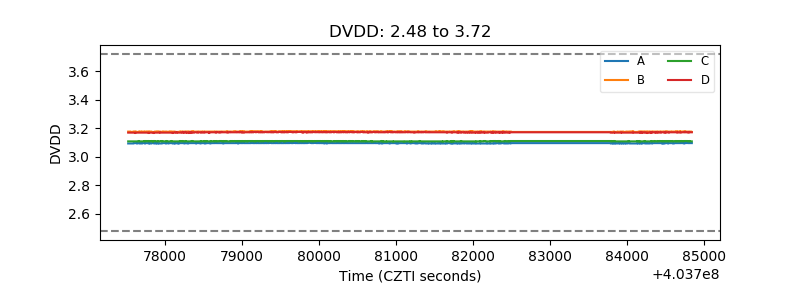 |
| Temperature 1 | 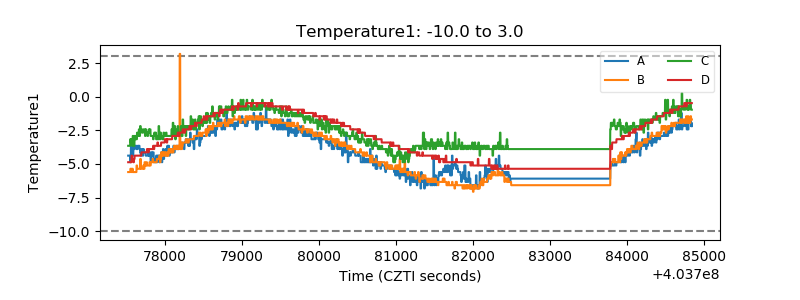 |
| Veto HV Monitor | 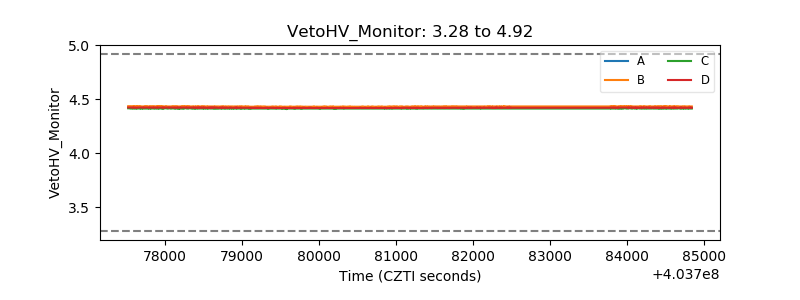 |
| Veto LLD | 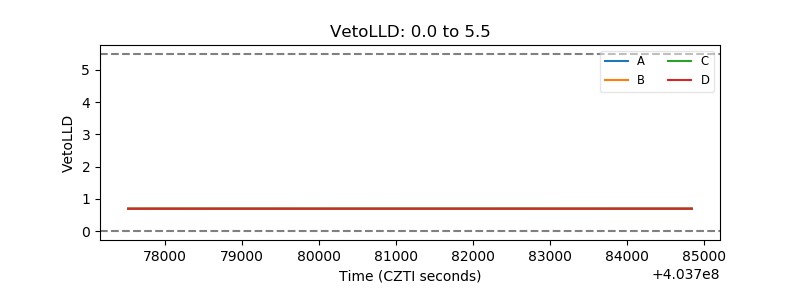 |
| Alpha Counter | 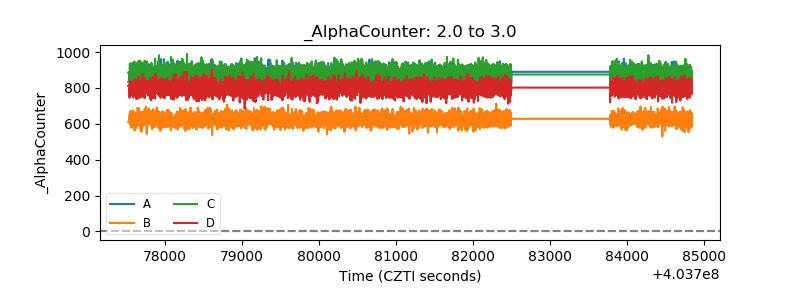 |
| _CPM_Rate | 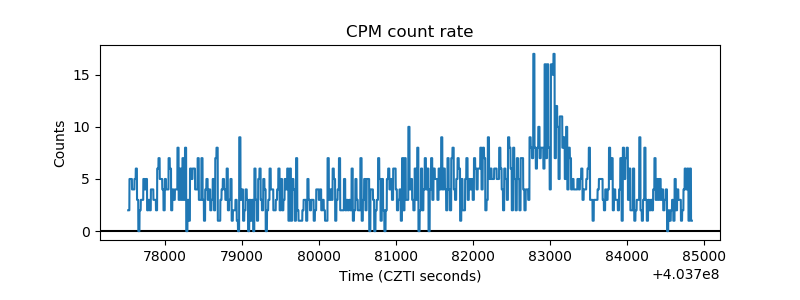 |
| CZT Counter | 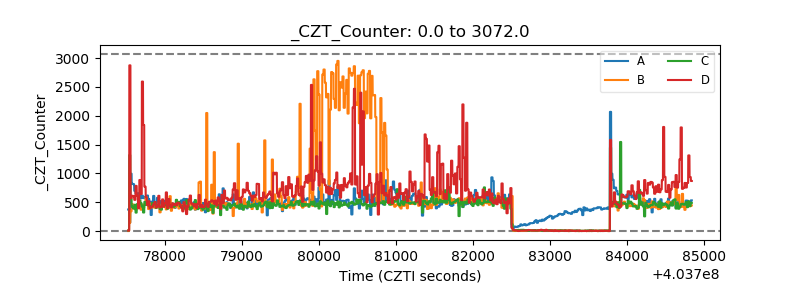 |
| +2.5 Volts monitor | 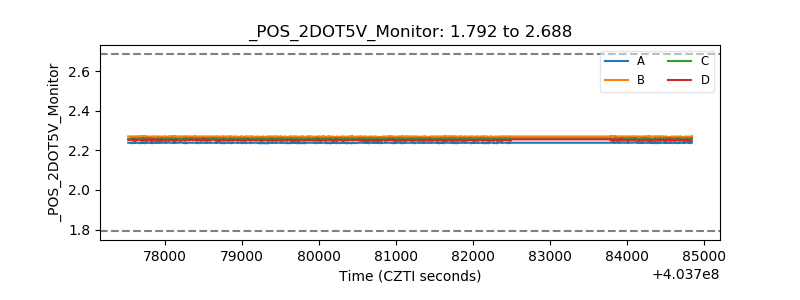 |
| +5 Volts monitor | 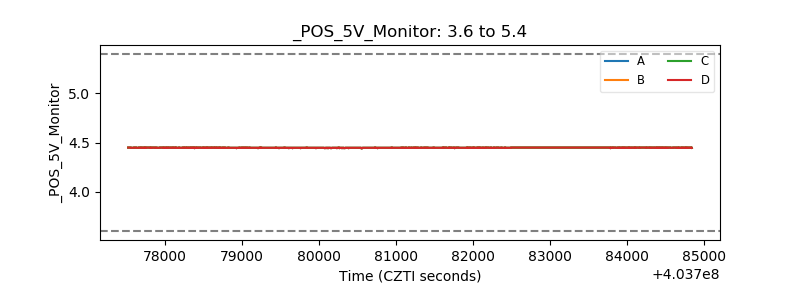 |
| _ROLL_ROT | 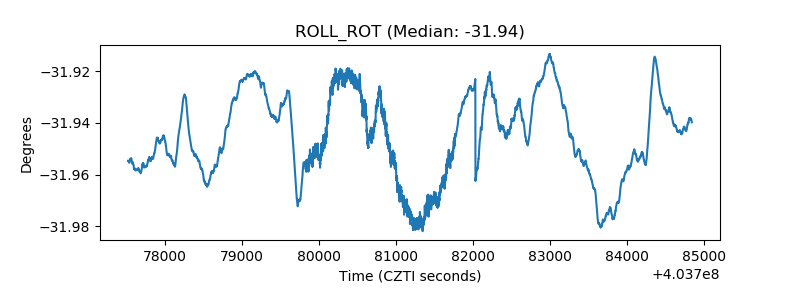 |
| _Roll_DEC | 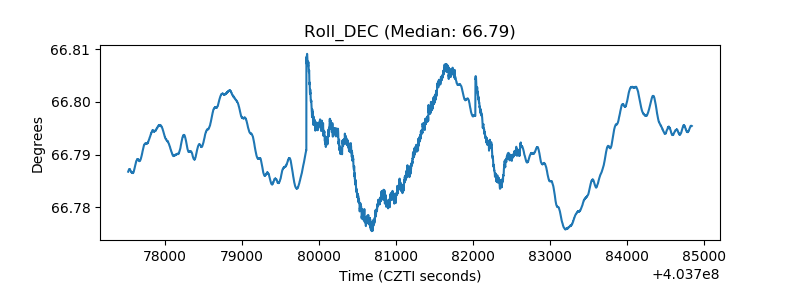 |
| _Roll_RA | 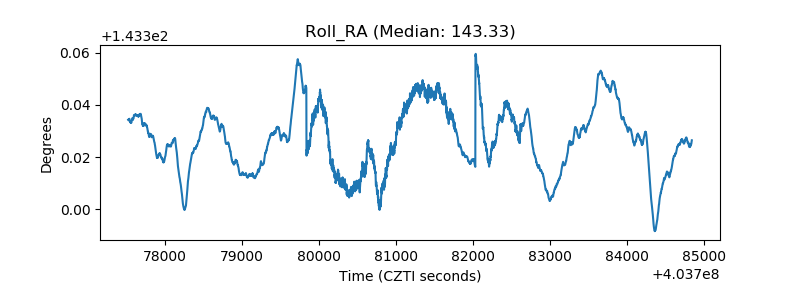 |
| Veto Counter | 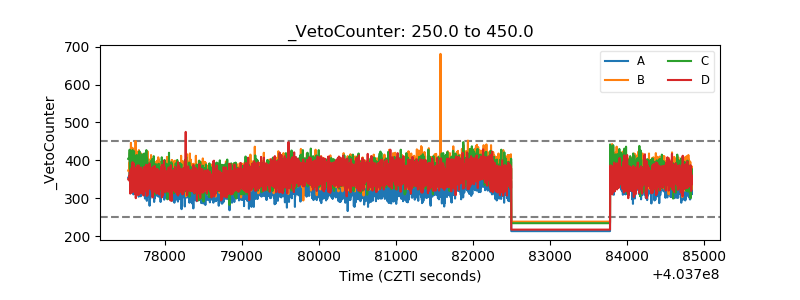 |