| Param | Original file | Final file |
|---|---|---|
| Filename | modeM0/AS1A07_093T02_9000005368_38151cztM0_level2.fits | modeM0/AS1A07_093T02_9000005368_38151cztM0_level2_quad_clean.evt |
| Size (bytes) | 231,361,920 | 60,517,440 |
| Size | 220.6 MB | 57.7 MB |
| Events in quadrant A | 1,923,269 | 411,632 |
| Events in quadrant B | 1,779,812 | 411,741 |
| Events in quadrant C | 1,716,338 | 393,391 |
| Events in quadrant D | 2,859,060 | 356,779 |
| Mode SS | |||
|---|---|---|---|
| Quadrant | BADHDUFLAG | Total packets | Discarded packets |
| A | 0 | 74 | 0 |
| B | 0 | 74 | 0 |
| C | 0 | 74 | 0 |
| D | 0 | 74 | 0 |
| Mode M9 | |||
|---|---|---|---|
| Quadrant | BADHDUFLAG | Total packets | Discarded packets |
| A | 0 | 4 | 0 |
| B | 0 | 4 | 0 |
| C | 0 | 4 | 0 |
| D | 0 | 5 | 0 |
| Mode M0 | |||
|---|---|---|---|
| Quadrant | BADHDUFLAG | Total packets | Discarded packets |
| A | 0 | 7813 | 1 |
| B | 0 | 7746 | 1 |
| C | 0 | 7399 | 1 |
| D | 0 | 11143 | 1 |
| Quadrant | Total seconds | Saturated seconds | Saturation percentage |
|---|---|---|---|
| A | 3656 | 6 | 0.164114% |
| B | 3656 | 27 | 0.738512% |
| C | 3656 | 3 | 0.082057% |
| D | 3656 | 102 | 2.789934% |
Noise dominated data is calculated using 1-second bins in cleaned event files. If a bin has >2000 counts, and if more than 50% of those come from <1% of pixels, then it is considered to be noise-dominated and hence unusable.
| Quadrant | # 1 sec bins | Bins with >0 counts | Bins with >2000 counts | High rate bins dominated by noise | Noise dominated (total time) | Noise dominated (detector-on time) | Marked lightcurve |
|---|---|---|---|---|---|---|---|
| A | 3656 | 3656 | 4 | 4 | 0.11% | 0.11% | 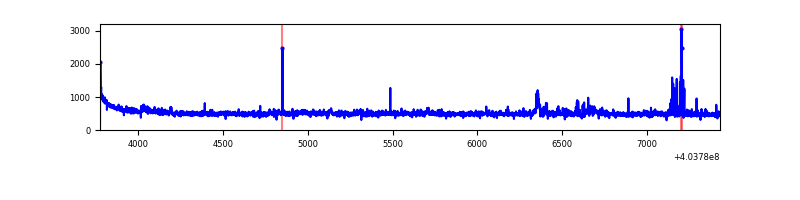 |
| B | 3656 | 3656 | 21 | 21 | 0.57% | 0.57% | 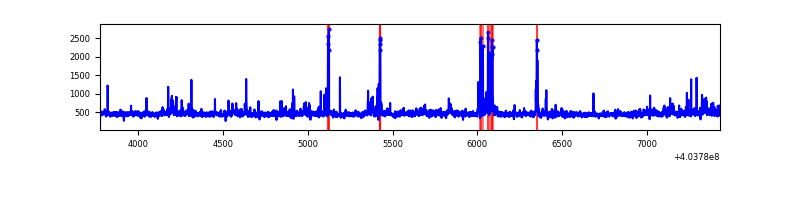 |
| C | 3656 | 3656 | 2 | 2 | 0.05% | 0.05% | 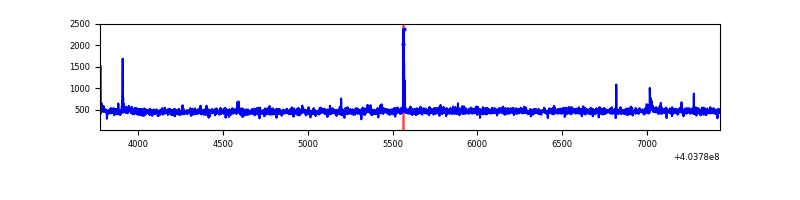 |
| D | 3656 | 3656 | 96 | 96 | 2.63% | 2.63% | 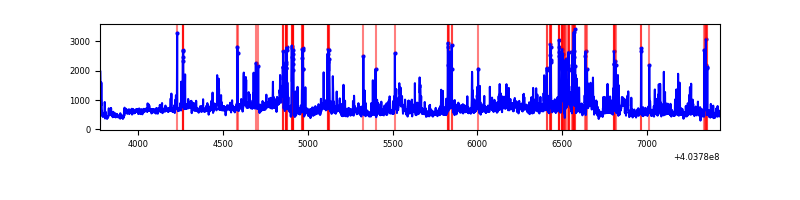 |
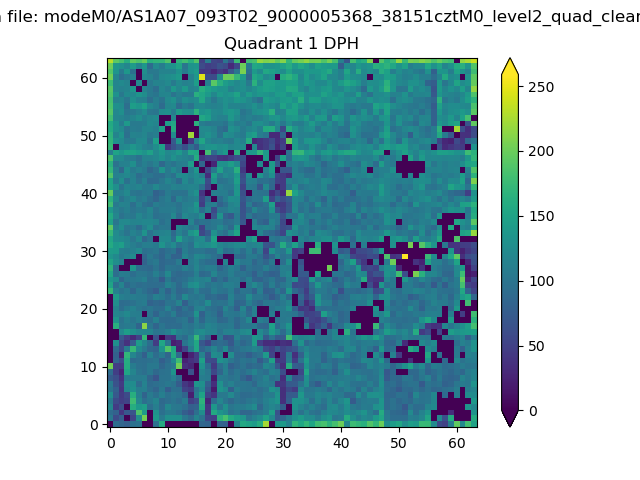
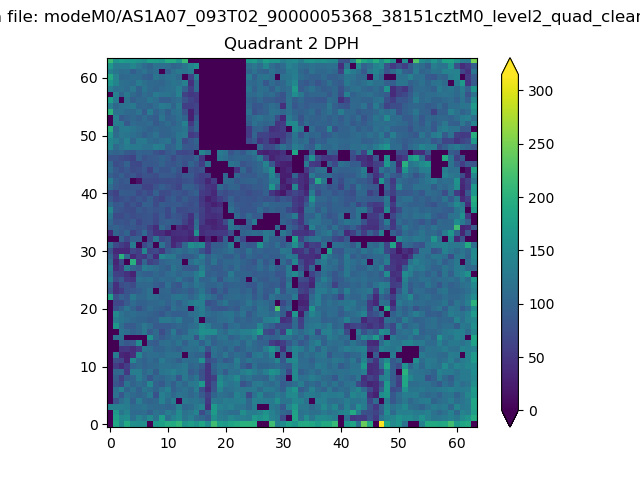
Top three noisy pixels from each quadrant. If the there are fewer than three noisy pixels in the level2.evt file, extra rows are filled as -1
| Pixel properties | Quadrant properties | ||||||
|---|---|---|---|---|---|---|---|
| Quadrant | DetID | PixID | Counts | Sigma | Mean | Median | Sigma |
| A | 10 | 83 | 237539 | 2847.79 | 403 | 393 | 83.3 |
| A | 15 | 223 | 35325 | 419.48 | 403 | 393 | 83.3 |
| A | 10 | 248 | 25198 | 297.87 | 403 | 393 | 83.3 |
| B | 15 | 85 | 64461 | 824.88 | 397 | 386 | 77.7 |
| B | 4 | 171 | 51937 | 663.65 | 397 | 386 | 77.7 |
| B | 0 | 229 | 40574 | 517.37 | 397 | 386 | 77.7 |
| C | 15 | 214 | 154126 | 1658.75 | 391 | 392 | 92.7 |
| C | 0 | 207 | 9224 | 95.3 | 391 | 392 | 92.7 |
| C | 1 | 23 | 8785 | 90.56 | 391 | 392 | 92.7 |
| D | 12 | 235 | 250841 | 2595.22 | 390 | 377 | 96.5 |
| D | 10 | 203 | 212646 | 2199.45 | 390 | 377 | 96.5 |
| D | 1 | 47 | 204081 | 2110.71 | 390 | 377 | 96.5 |
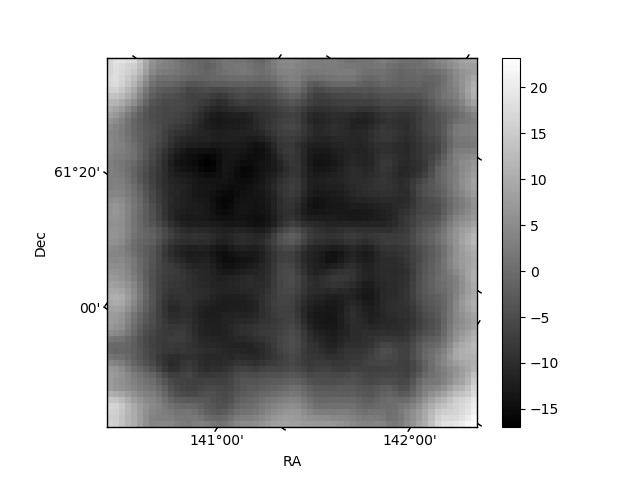
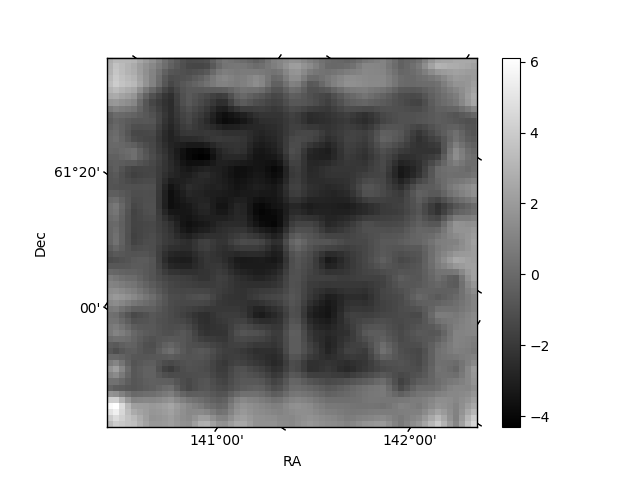
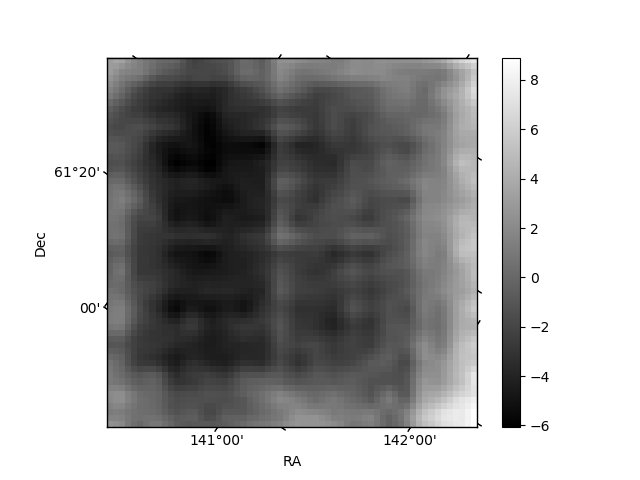
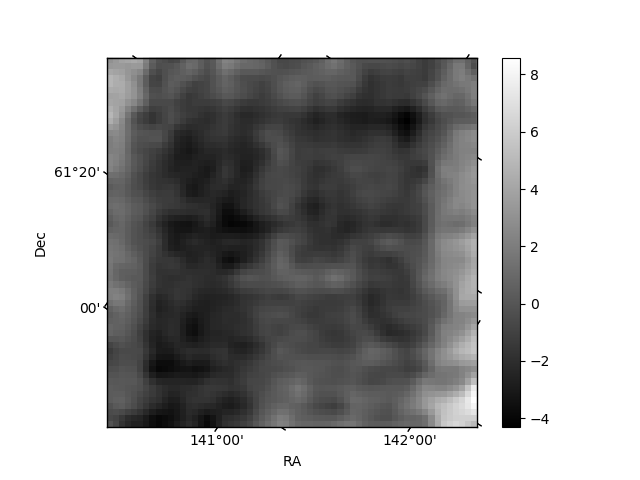
Histogram calculated using DETX and DETY for each event in the final _common_clean file
| Quadrant A | 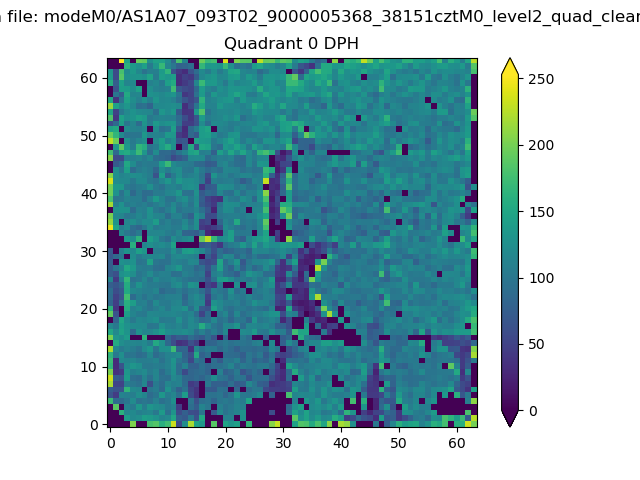 |
 |
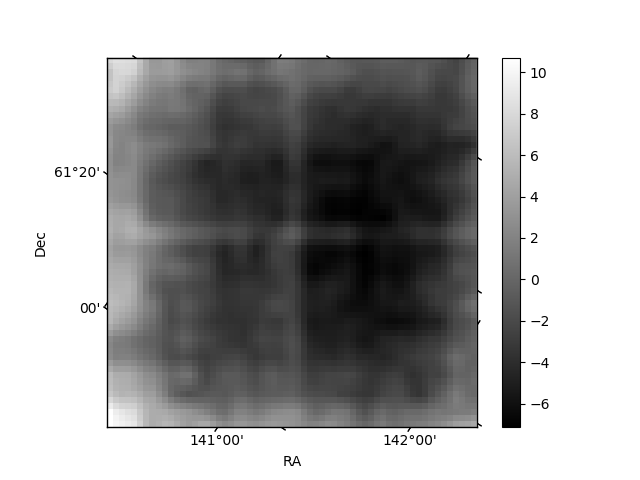
Quadrant B |
|---|---|---|---|
| Quadrant D | 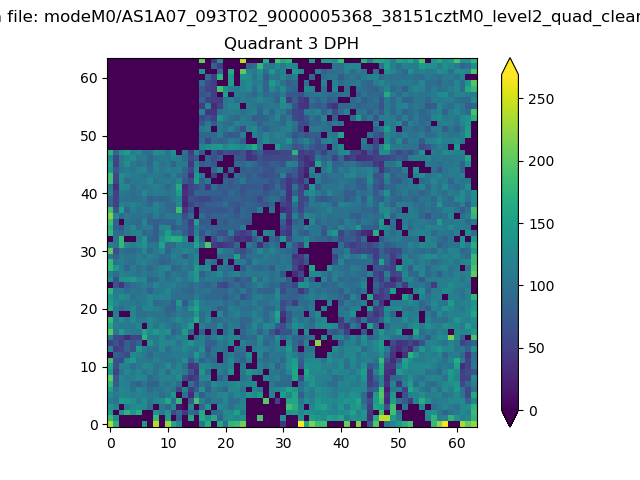 |
 |
Quadrant C |
| Plot type | Count rate plots | Images |
|---|---|---|
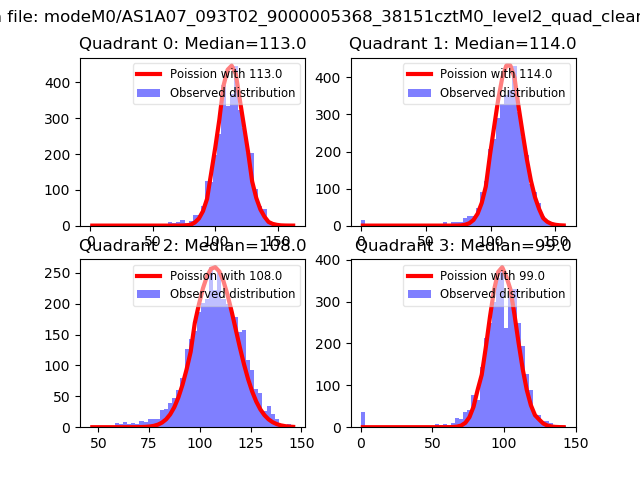
| Comparison with Poisson distribution Blue bars denote a histogram of data divided into 1 sec bins. Red curve is a Poisson curve with rate = median count rate of data. |
 |
 |
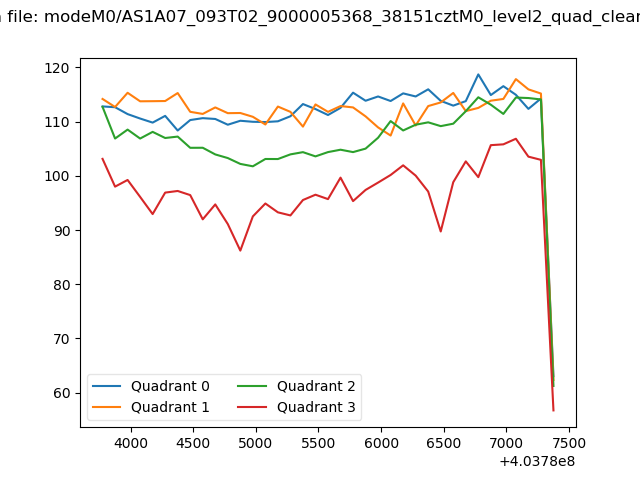
| Quadrant-wise count rates Data is divided into 100 sec bins |
 |
|
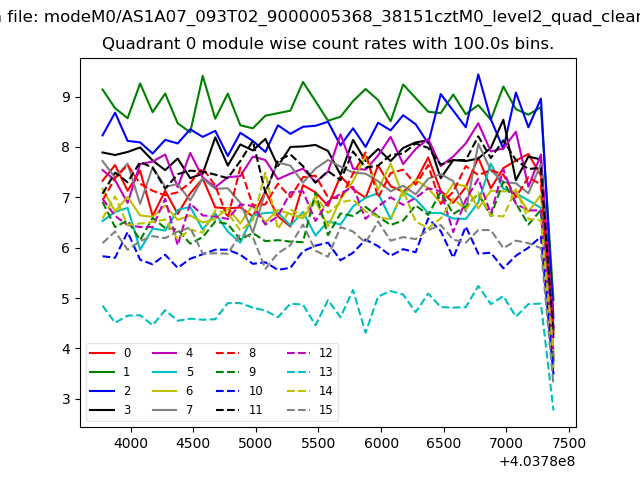
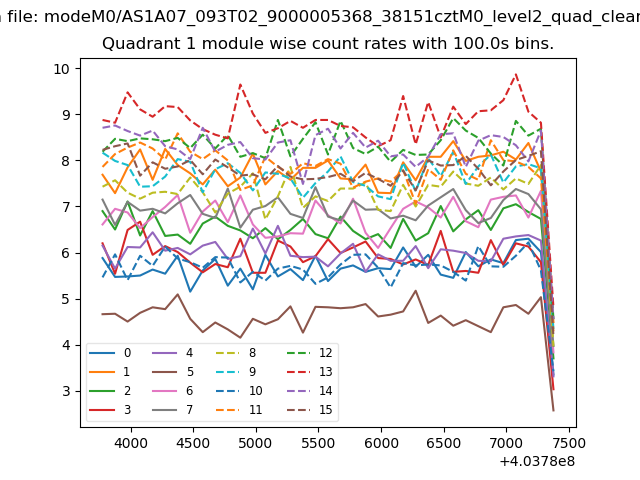
| Module-wise count rates for Quadrant A Data is divided into 100 sec bins |
 |
 |
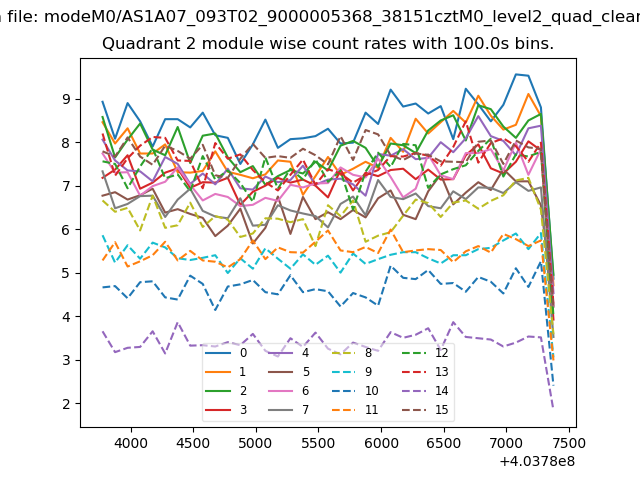
| Module-wise count rates for Quadrant B Data is divided into 100 sec bins |
 |
 |
| Module-wise count rates for Quadrant C Data is divided into 100 sec bins |
 |
 |
| Module-wise count rates for Quadrant D Data is divided into 100 sec bins |
 |
 |
| Parameter | Plot |
|---|---|
| CZT HV Monitor | 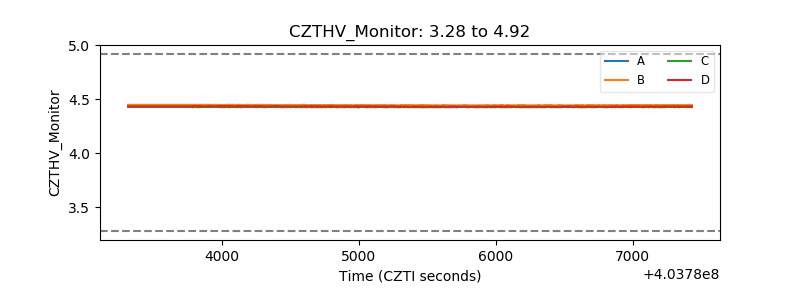 |
| D_VDD | 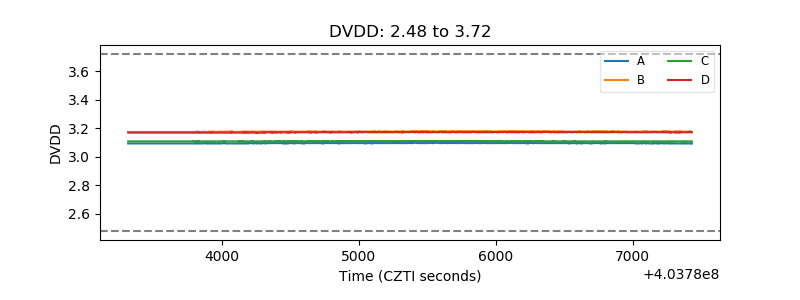 |
| Temperature 1 | 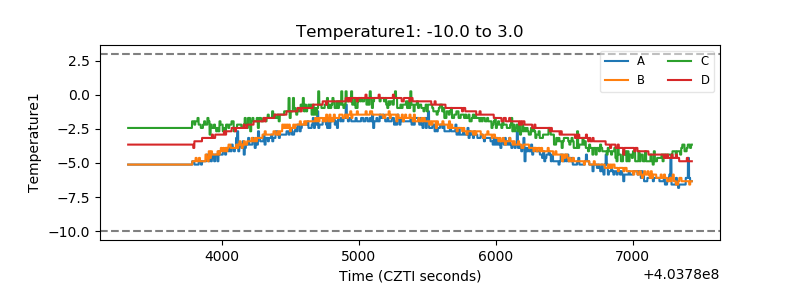 |
| Veto HV Monitor | 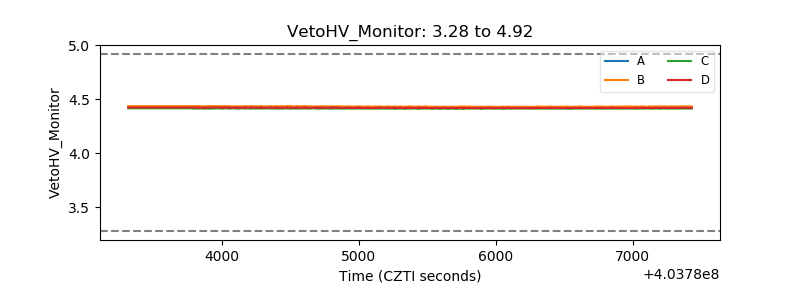 |
| Veto LLD | 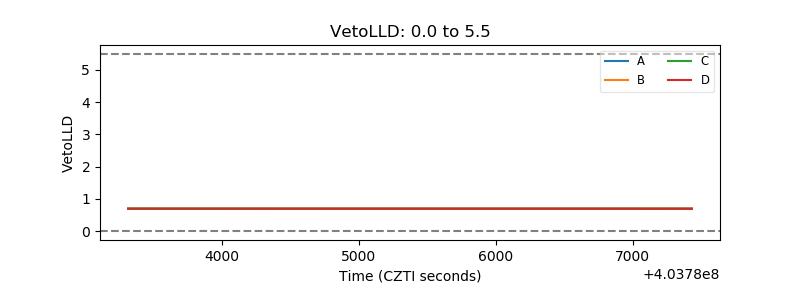 |
| Alpha Counter | 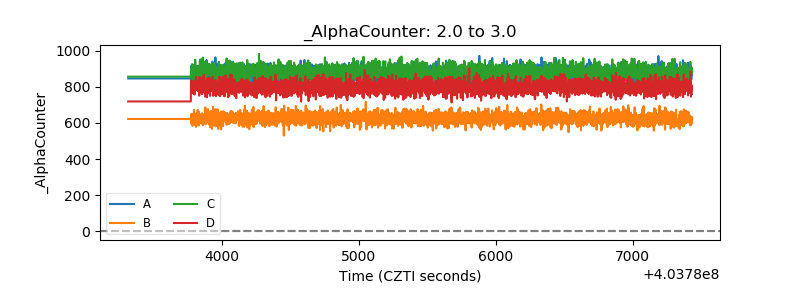 |
| _CPM_Rate | 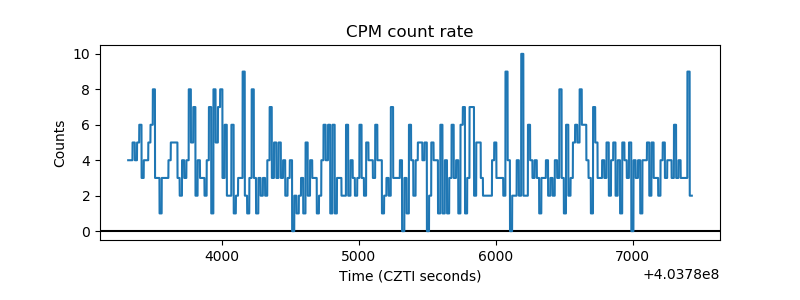 |
| CZT Counter | 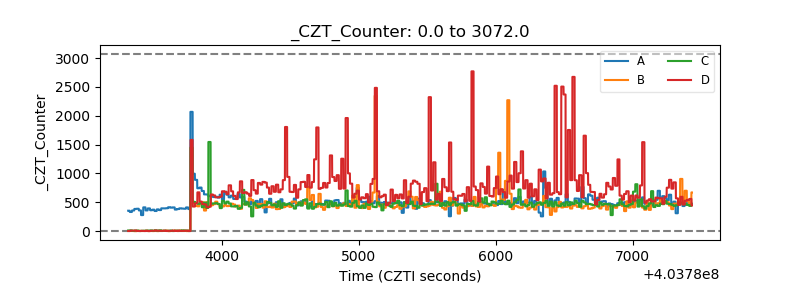 |
| +2.5 Volts monitor | 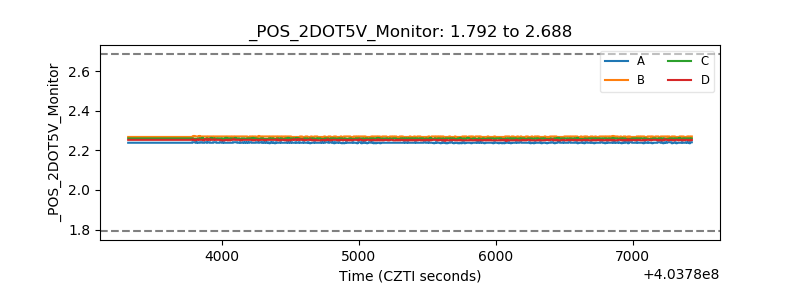 |
| +5 Volts monitor | 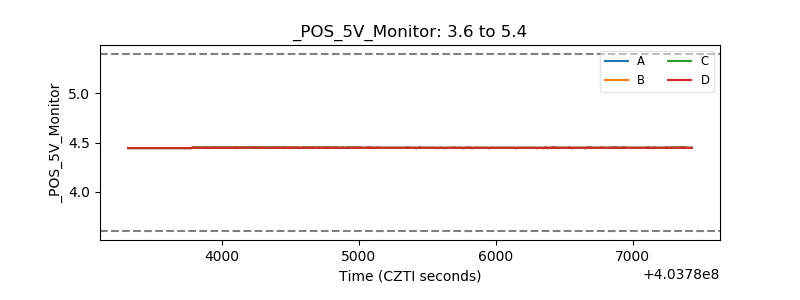 |
| _ROLL_ROT | 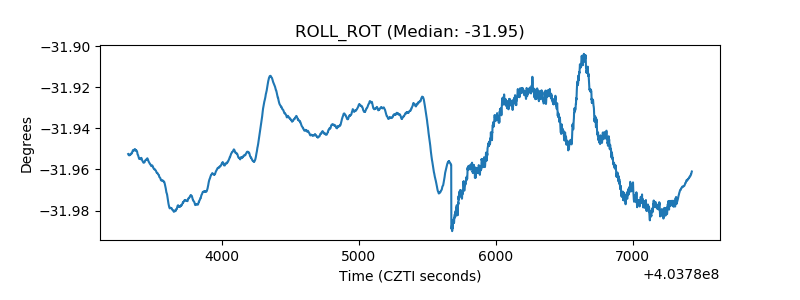 |
| _Roll_DEC | 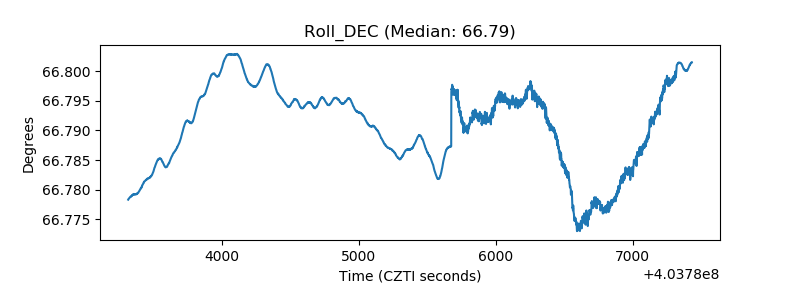 |
| _Roll_RA | 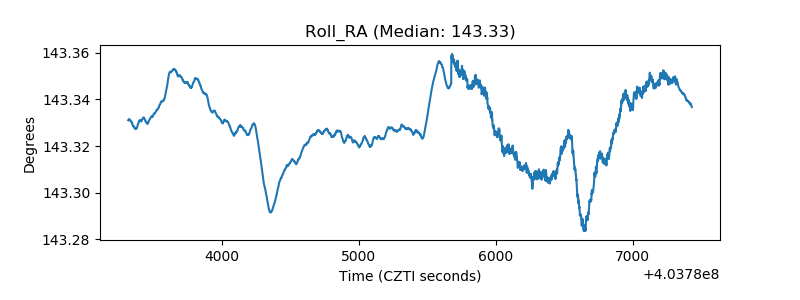 |
| Veto Counter | 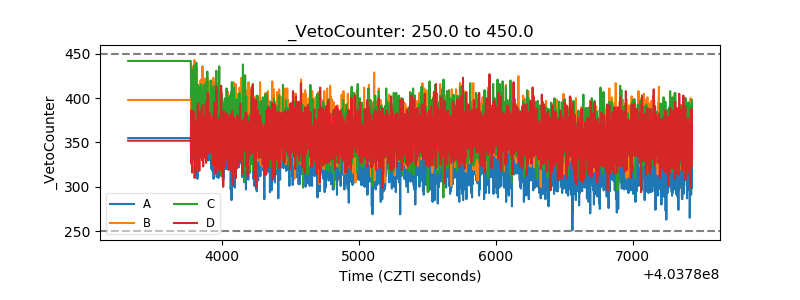 |