| Param | Original file | Final file |
|---|---|---|
| Filename | modeM0/AS1A07_145T01_9000005370_38151cztM0_level2.fits | modeM0/AS1A07_145T01_9000005370_38151cztM0_level2_quad_clean.evt |
| Size (bytes) | 399,735,360 | 107,717,760 |
| Size | 381.2 MB | 102.7 MB |
| Events in quadrant A | 3,455,416 | 729,059 |
| Events in quadrant B | 3,083,662 | 743,601 |
| Events in quadrant C | 3,119,082 | 709,400 |
| Events in quadrant D | 4,634,277 | 627,200 |
| Mode M9 | |||
|---|---|---|---|
| Quadrant | BADHDUFLAG | Total packets | Discarded packets |
| A | 0 | 27 | 0 |
| B | 0 | 27 | 0 |
| C | 0 | 27 | 0 |
| D | 0 | 27 | 0 |
| Mode SS | |||
|---|---|---|---|
| Quadrant | BADHDUFLAG | Total packets | Discarded packets |
| A | 0 | 134 | 0 |
| B | 0 | 134 | 0 |
| C | 0 | 134 | 0 |
| D | 0 | 134 | 0 |
| Mode M0 | |||
|---|---|---|---|
| Quadrant | BADHDUFLAG | Total packets | Discarded packets |
| A | 0 | 14254 | 3 |
| B | 0 | 13511 | 2 |
| C | 0 | 13210 | 2 |
| D | 0 | 18103 | 2 |
| Quadrant | Total seconds | Saturated seconds | Saturation percentage |
|---|---|---|---|
| A | 6484 | 24 | 0.370142% |
| B | 6484 | 24 | 0.370142% |
| C | 6484 | 6 | 0.092535% |
| D | 6484 | 381 | 5.876002% |
Noise dominated data is calculated using 1-second bins in cleaned event files. If a bin has >2000 counts, and if more than 50% of those come from <1% of pixels, then it is considered to be noise-dominated and hence unusable.
| Quadrant | # 1 sec bins | Bins with >0 counts | Bins with >2000 counts | High rate bins dominated by noise | Noise dominated (total time) | Noise dominated (detector-on time) | Marked lightcurve |
|---|---|---|---|---|---|---|---|
| A | 9200 | 6486 | 7 | 7 | 0.08% | 0.11% | 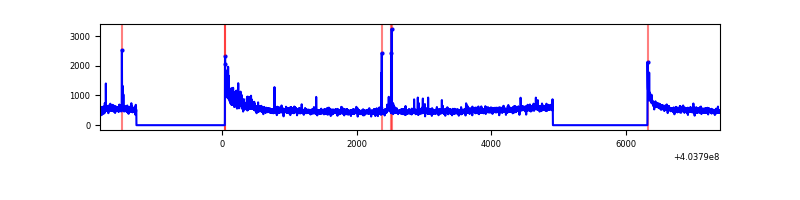 |
| B | 9200 | 6486 | 10 | 10 | 0.11% | 0.15% | 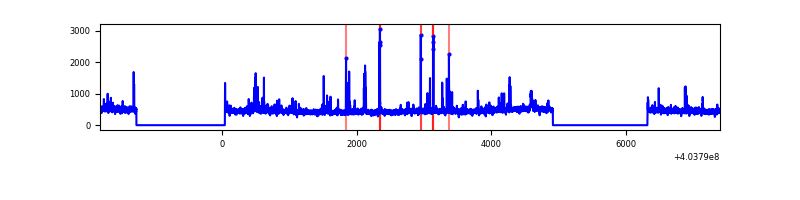 |
| C | 9200 | 6486 | 1 | 1 | 0.01% | 0.02% | 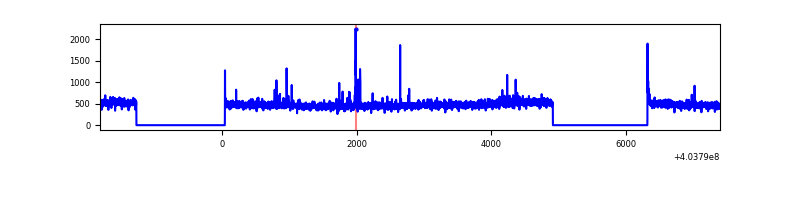 |
| D | 9200 | 6486 | 378 | 378 | 4.11% | 5.83% | 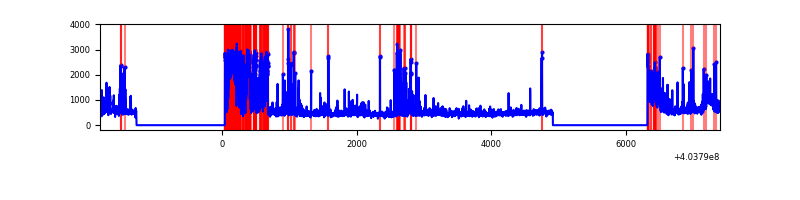 |
Top three noisy pixels from each quadrant. If the there are fewer than three noisy pixels in the level2.evt file, extra rows are filled as -1
| Pixel properties | Quadrant properties | ||||||
|---|---|---|---|---|---|---|---|
| Quadrant | DetID | PixID | Counts | Sigma | Mean | Median | Sigma |
| A | 10 | 83 | 423923 | 2850.63 | 728 | 711 | 148.5 |
| A | 12 | 16 | 87912 | 587.36 | 728 | 711 | 148.5 |
| A | 10 | 248 | 40959 | 271.1 | 728 | 711 | 148.5 |
| B | 5 | 172 | 70062 | 490.95 | 726 | 706 | 141.3 |
| B | 4 | 171 | 64529 | 451.78 | 726 | 706 | 141.3 |
| B | 5 | 184 | 44451 | 309.66 | 726 | 706 | 141.3 |
| C | 15 | 214 | 270013 | 1623.91 | 711 | 714 | 165.8 |
| C | 14 | 254 | 43486 | 257.92 | 711 | 714 | 165.8 |
| C | 3 | 233 | 20606 | 119.95 | 711 | 714 | 165.8 |
| D | 12 | 227 | 927215 | 5487.09 | 694 | 673 | 168.9 |
| D | 12 | 235 | 423244 | 2502.51 | 694 | 673 | 168.9 |
| D | 13 | 249 | 186342 | 1099.55 | 694 | 673 | 168.9 |
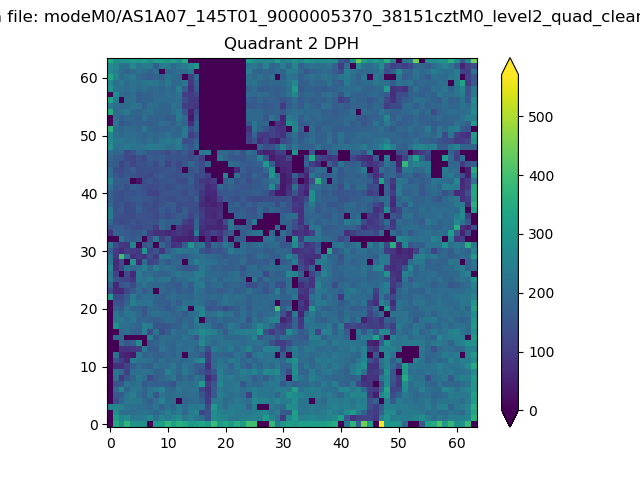
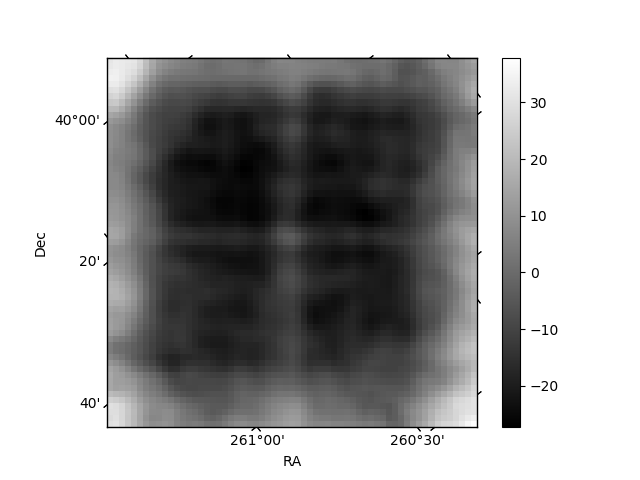
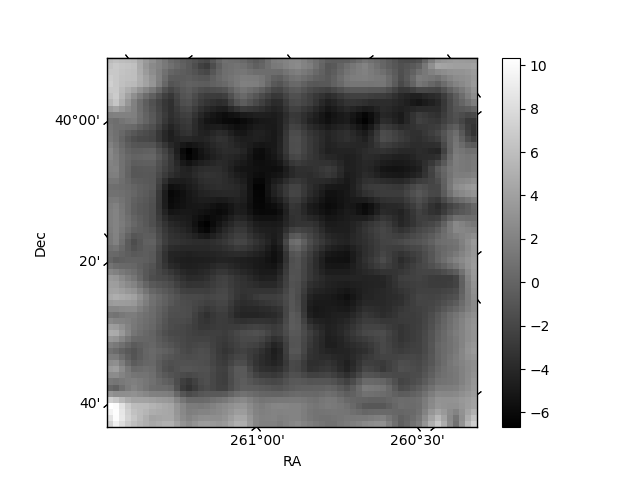
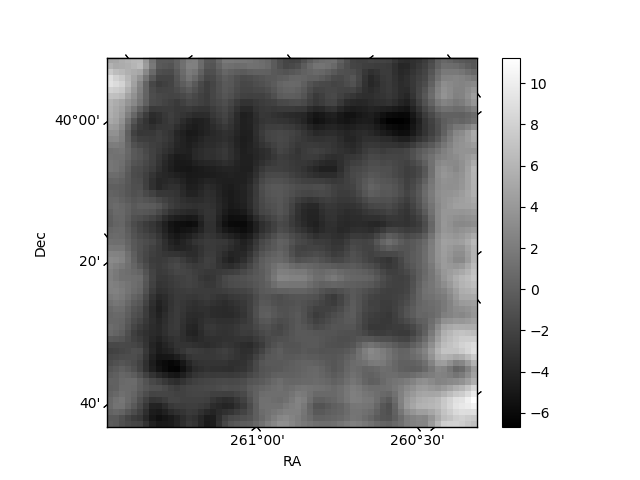
Histogram calculated using DETX and DETY for each event in the final _common_clean file
| Quadrant A | 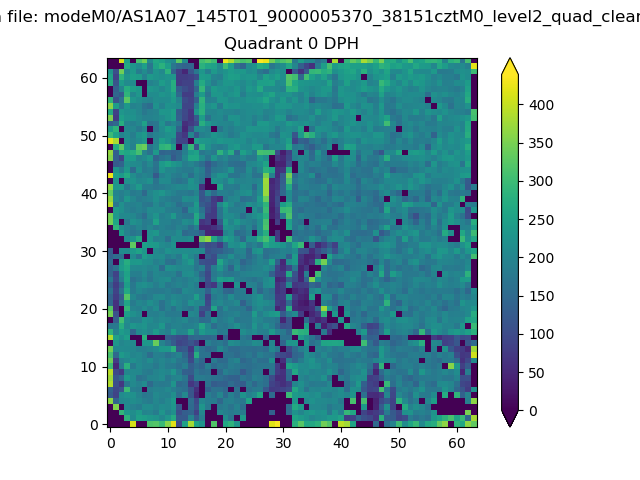 |
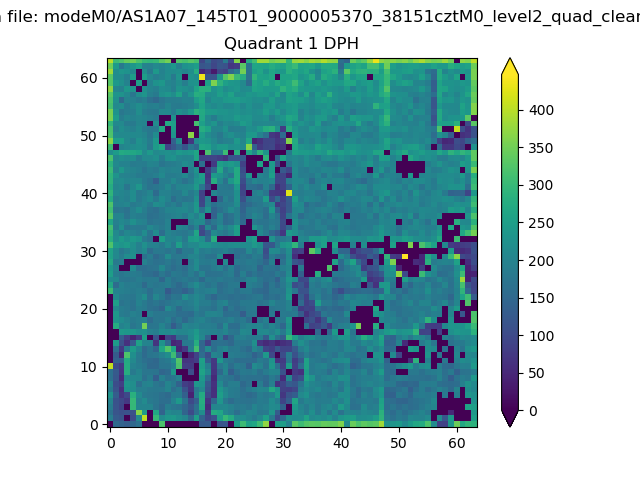 |
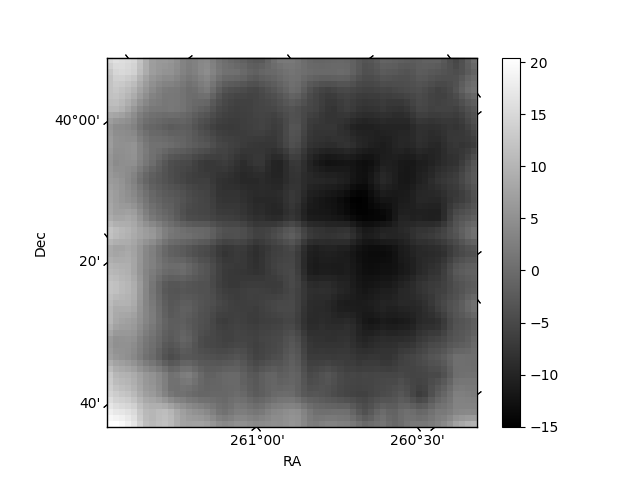
Quadrant B |
|---|---|---|---|
| Quadrant D | 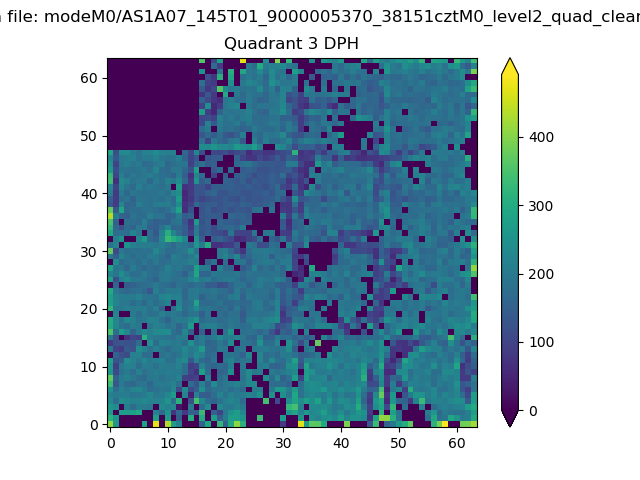 |
 |
Quadrant C |
| Plot type | Count rate plots | Images |
|---|---|---|
| Comparison with Poisson distribution Blue bars denote a histogram of data divided into 1 sec bins. Red curve is a Poisson curve with rate = median count rate of data. |
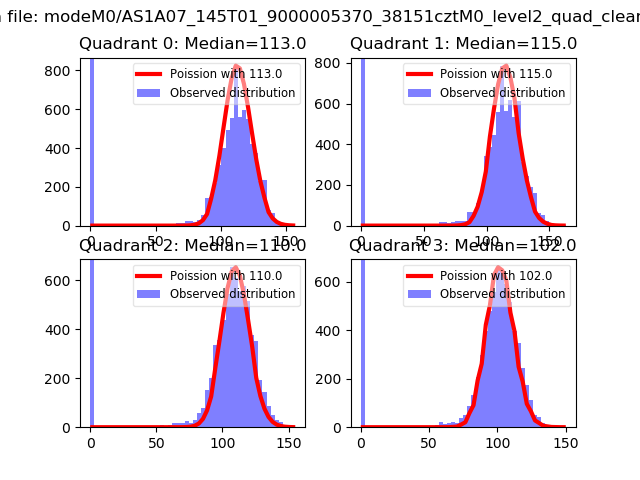 |
 |
| Quadrant-wise count rates Data is divided into 100 sec bins |
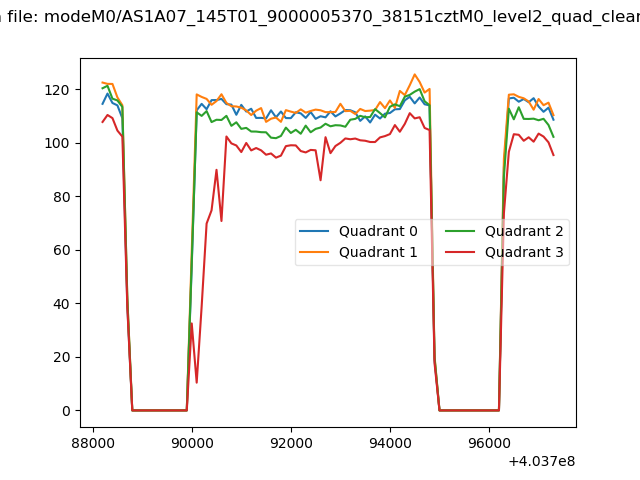 |
|
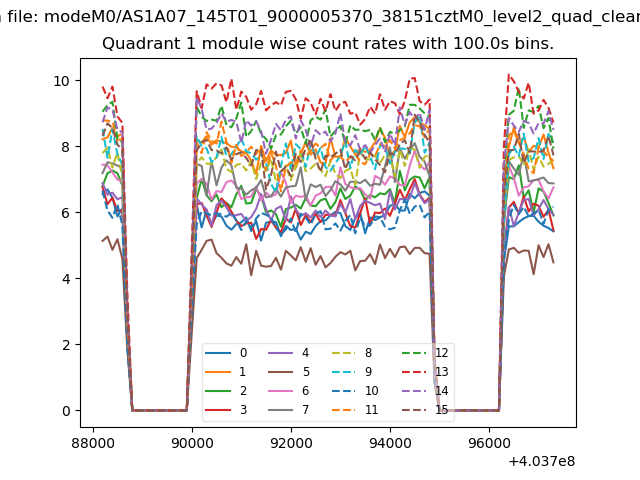
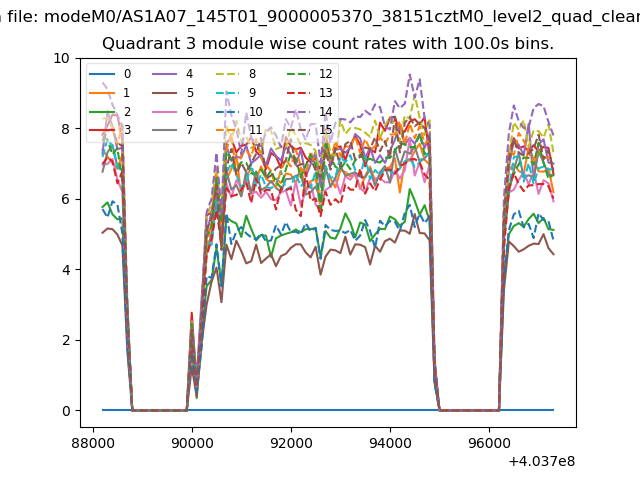
| Module-wise count rates for Quadrant A Data is divided into 100 sec bins |
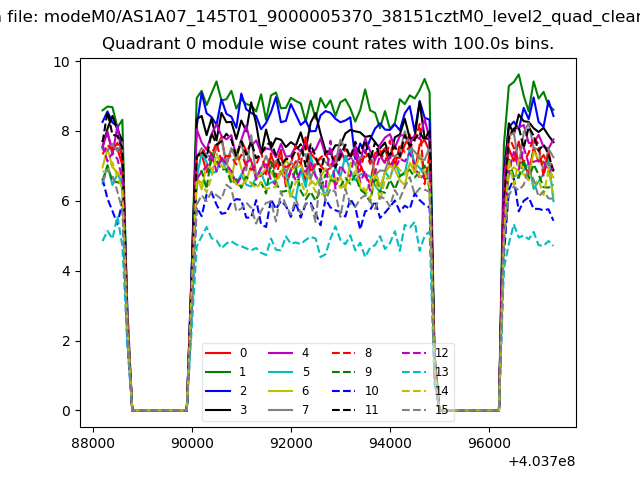 |
 |
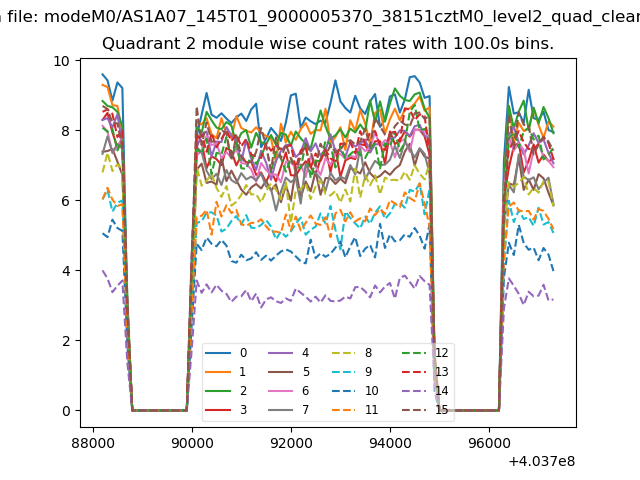
| Module-wise count rates for Quadrant B Data is divided into 100 sec bins |
 |
 |
| Module-wise count rates for Quadrant C Data is divided into 100 sec bins |
 |
 |
| Module-wise count rates for Quadrant D Data is divided into 100 sec bins |
 |
 |
| Parameter | Plot |
|---|---|
| CZT HV Monitor | 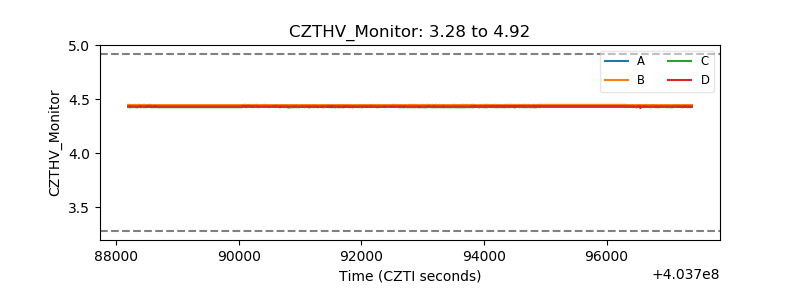 |
| D_VDD | 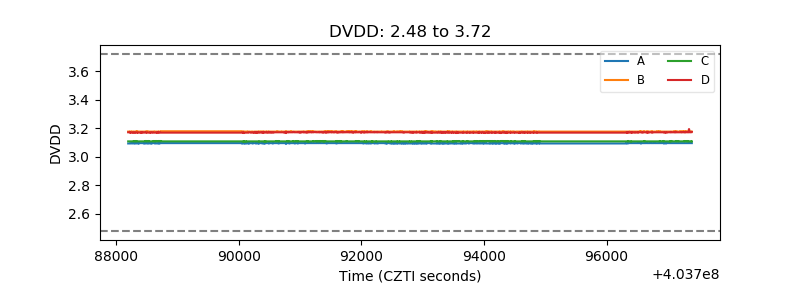 |
| Temperature 1 | 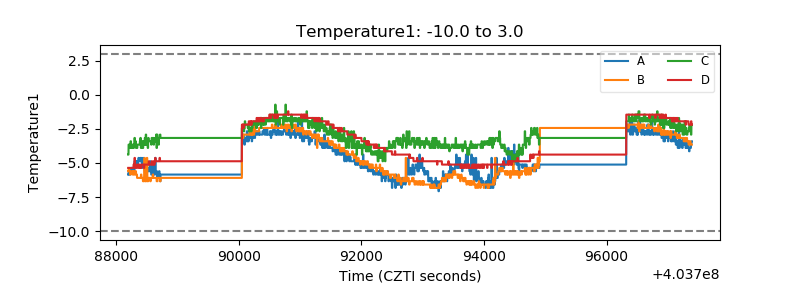 |
| Veto HV Monitor | 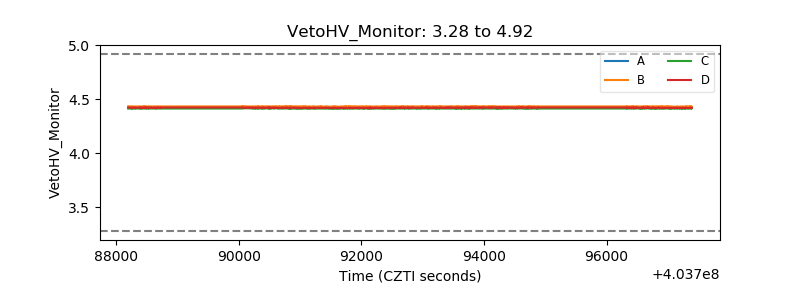 |
| Veto LLD | 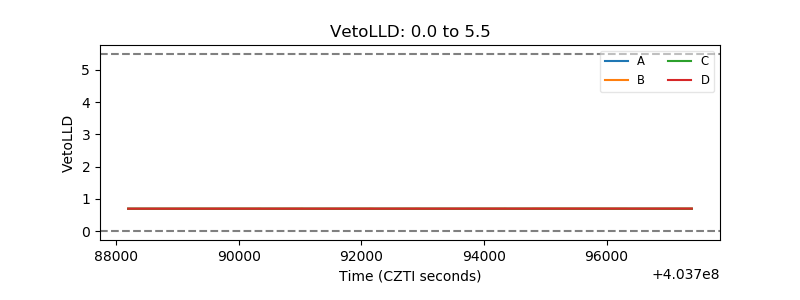 |
| Alpha Counter | 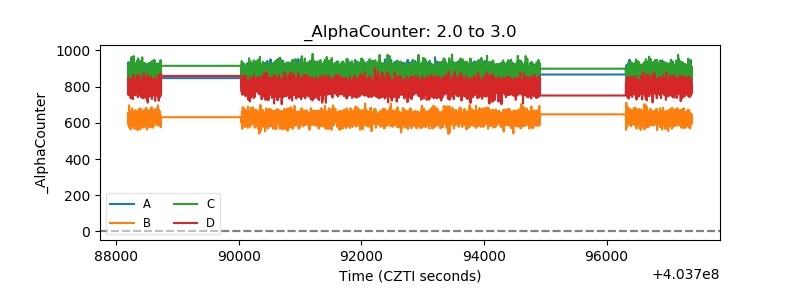 |
| _CPM_Rate | 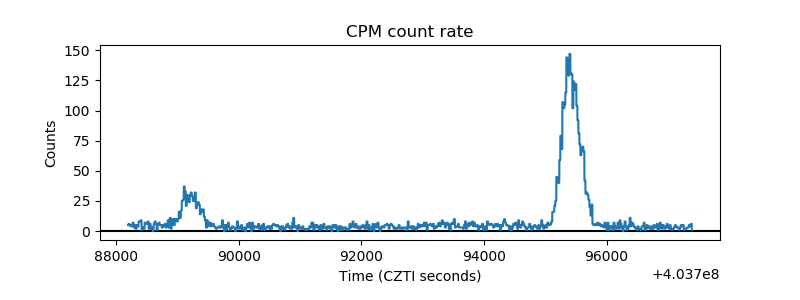 |
| CZT Counter | 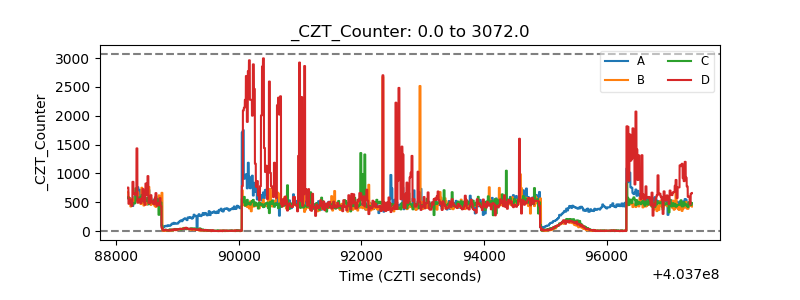 |
| +2.5 Volts monitor | 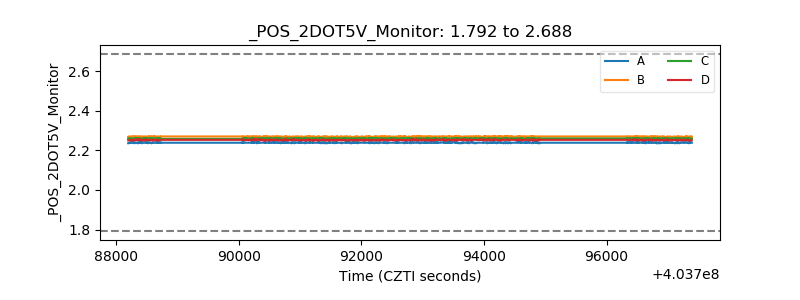 |
| +5 Volts monitor | 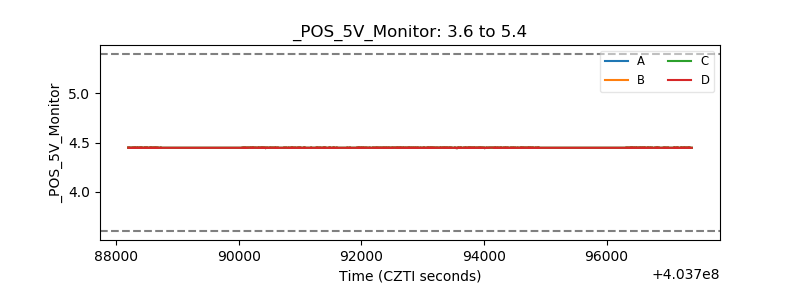 |
| _ROLL_ROT | 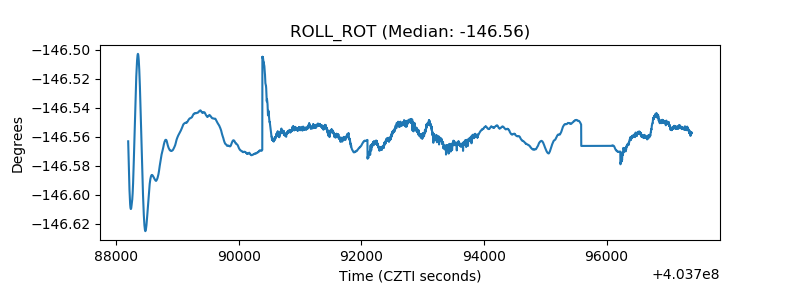 |
| _Roll_DEC | 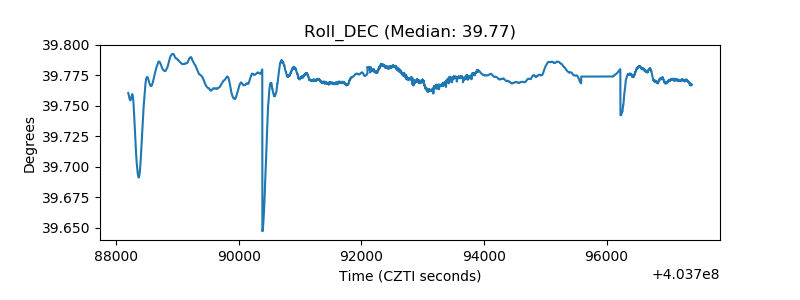 |
| _Roll_RA | 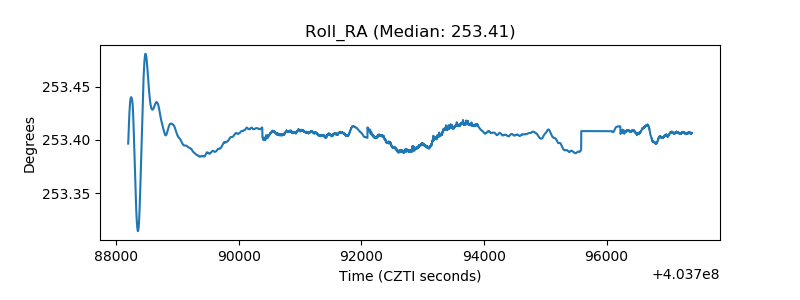 |
| Veto Counter | 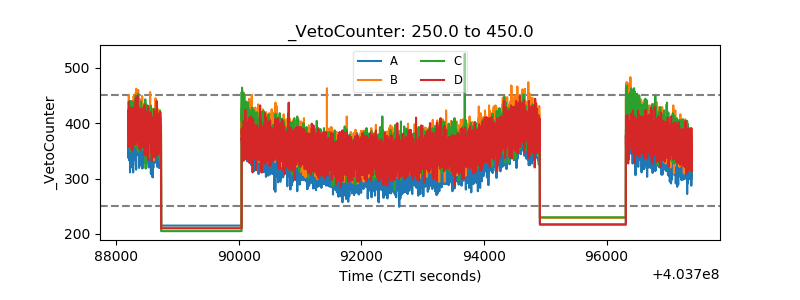 |