| Param | Original file | Final file |
|---|---|---|
| Filename | modeM0/AS1A07_145T01_9000005370_38152cztM0_level2.fits | modeM0/AS1A07_145T01_9000005370_38152cztM0_level2_quad_clean.evt |
| Size (bytes) | 330,842,880 | 93,159,360 |
| Size | 315.5 MB | 88.8 MB |
| Events in quadrant A | 2,811,121 | 626,208 |
| Events in quadrant B | 2,569,312 | 634,980 |
| Events in quadrant C | 2,643,445 | 610,102 |
| Events in quadrant D | 3,788,948 | 559,706 |
| Mode M9 | |||
|---|---|---|---|
| Quadrant | BADHDUFLAG | Total packets | Discarded packets |
| A | 0 | 15 | 0 |
| B | 0 | 15 | 0 |
| C | 0 | 15 | 0 |
| D | 0 | 15 | 0 |
| Mode SS | |||
|---|---|---|---|
| Quadrant | BADHDUFLAG | Total packets | Discarded packets |
| A | 0 | 114 | 0 |
| B | 0 | 114 | 0 |
| C | 0 | 114 | 0 |
| D | 0 | 114 | 0 |
| Mode M0 | |||
|---|---|---|---|
| Quadrant | BADHDUFLAG | Total packets | Discarded packets |
| A | 0 | 11776 | 2 |
| B | 0 | 11427 | 1 |
| C | 0 | 11284 | 1 |
| D | 0 | 14998 | 1 |
| Quadrant | Total seconds | Saturated seconds | Saturation percentage |
|---|---|---|---|
| A | 5569 | 11 | 0.197522% |
| B | 5569 | 11 | 0.197522% |
| C | 5569 | 7 | 0.125696% |
| D | 5569 | 112 | 2.011133% |
Noise dominated data is calculated using 1-second bins in cleaned event files. If a bin has >2000 counts, and if more than 50% of those come from <1% of pixels, then it is considered to be noise-dominated and hence unusable.
| Quadrant | # 1 sec bins | Bins with >0 counts | Bins with >2000 counts | High rate bins dominated by noise | Noise dominated (total time) | Noise dominated (detector-on time) | Marked lightcurve |
|---|---|---|---|---|---|---|---|
| A | 7091 | 5570 | 6 | 6 | 0.08% | 0.11% | 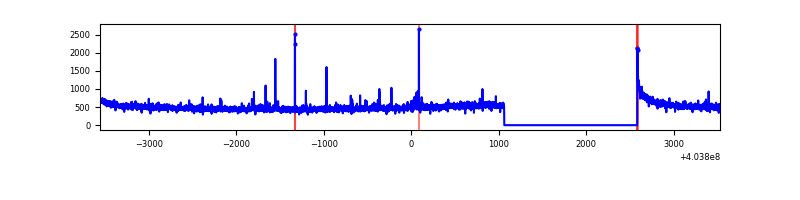 |
| B | 7091 | 5570 | 3 | 3 | 0.04% | 0.05% | 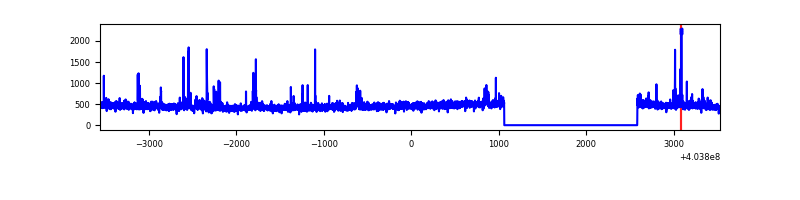 |
| C | 7091 | 5570 | 4 | 4 | 0.06% | 0.07% | 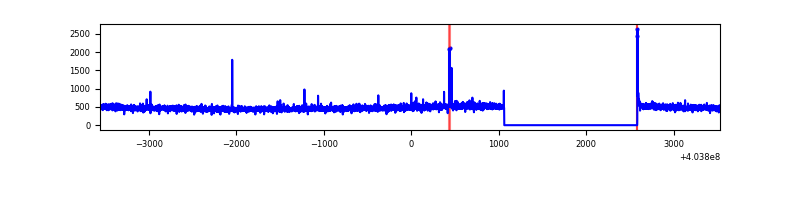 |
| D | 7091 | 5570 | 86 | 86 | 1.21% | 1.54% | 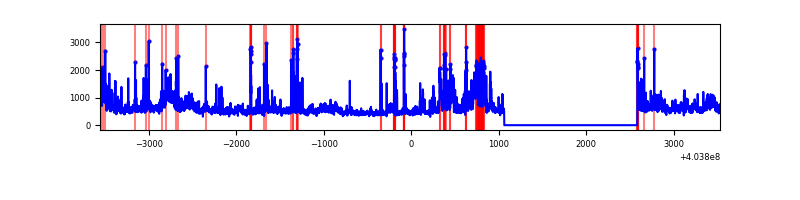 |
Top three noisy pixels from each quadrant. If the there are fewer than three noisy pixels in the level2.evt file, extra rows are filled as -1
| Pixel properties | Quadrant properties | ||||||
|---|---|---|---|---|---|---|---|
| Quadrant | DetID | PixID | Counts | Sigma | Mean | Median | Sigma |
| A | 10 | 83 | 343458 | 2700.82 | 619 | 606 | 126.9 |
| A | 10 | 248 | 19811 | 151.29 | 619 | 606 | 126.9 |
| A | 12 | 189 | 18828 | 143.54 | 619 | 606 | 126.9 |
| B | 4 | 171 | 87169 | 714.27 | 617 | 599 | 121.2 |
| B | 5 | 172 | 17451 | 139.04 | 617 | 599 | 121.2 |
| B | 12 | 111 | 14956 | 118.46 | 617 | 599 | 121.2 |
| C | 15 | 214 | 232364 | 1634.85 | 606 | 611 | 141.8 |
| C | 14 | 254 | 15613 | 105.83 | 606 | 611 | 141.8 |
| C | 10 | 20 | 11239 | 74.97 | 606 | 611 | 141.8 |
| D | 12 | 235 | 701623 | 4803.5 | 603 | 587 | 145.9 |
| D | 13 | 171 | 348634 | 2384.82 | 603 | 587 | 145.9 |
| D | 1 | 52 | 113250 | 771.97 | 603 | 587 | 145.9 |
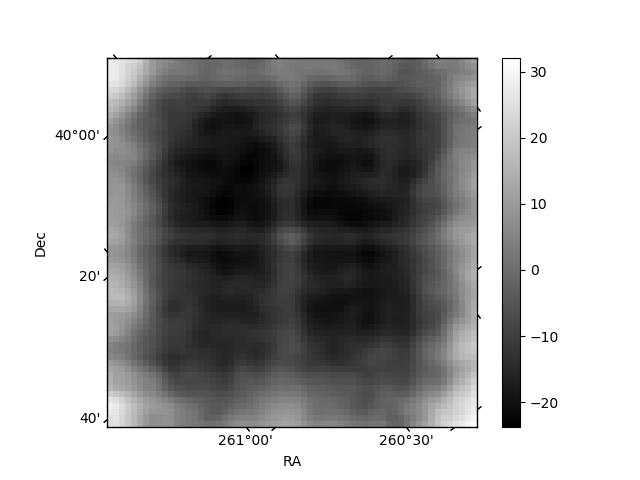
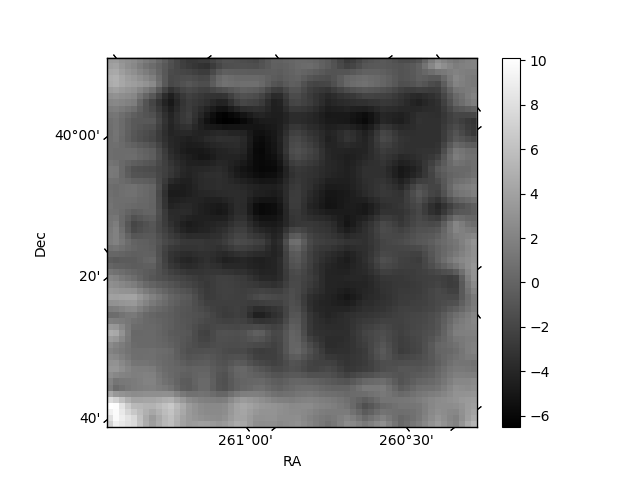
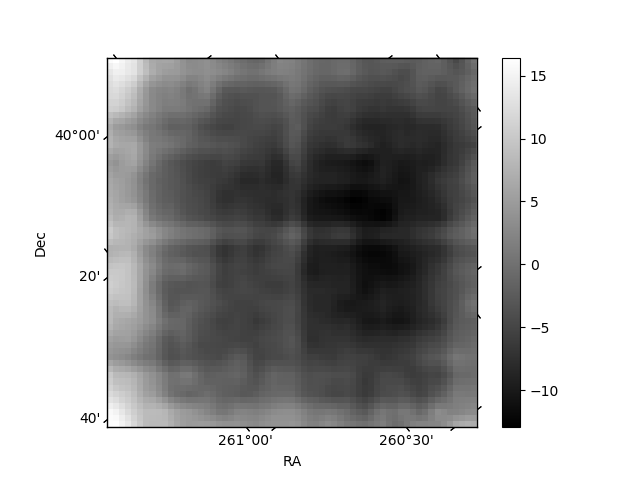
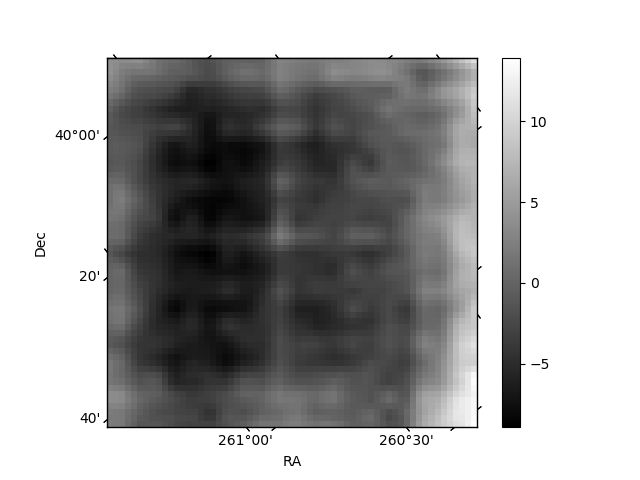
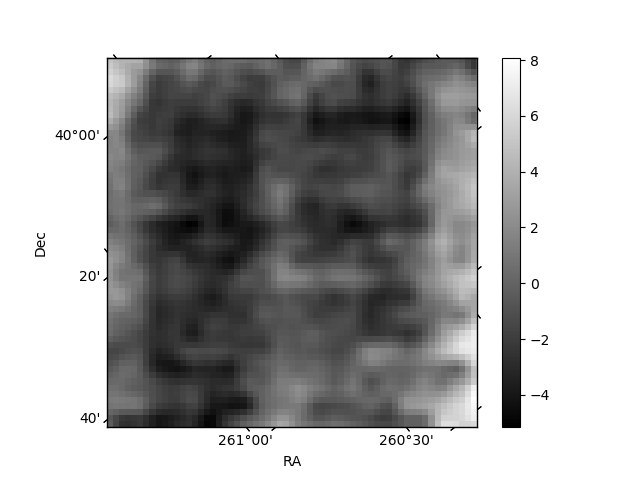
Histogram calculated using DETX and DETY for each event in the final _common_clean file
| Quadrant A | 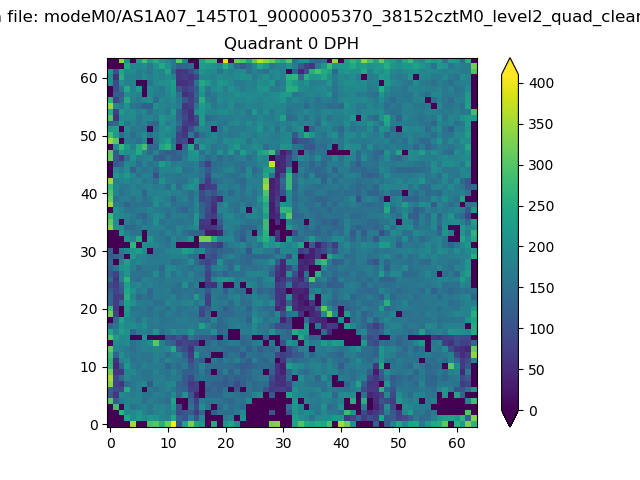 |
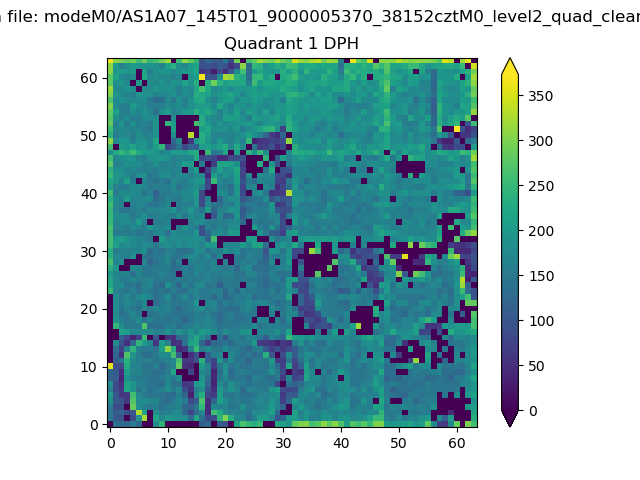 |
Quadrant B |
|---|---|---|---|
| Quadrant D | 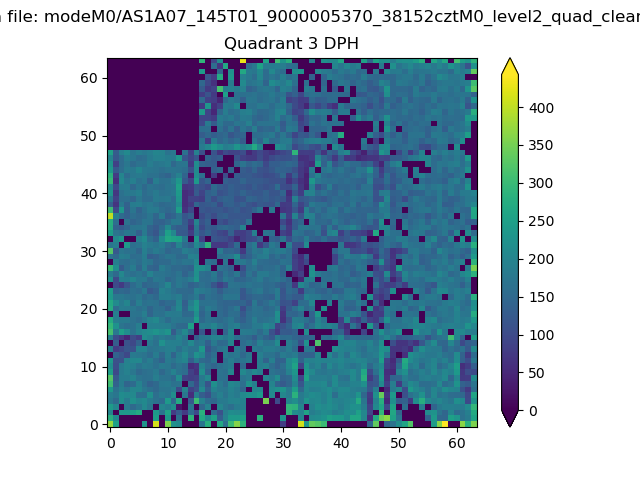 |
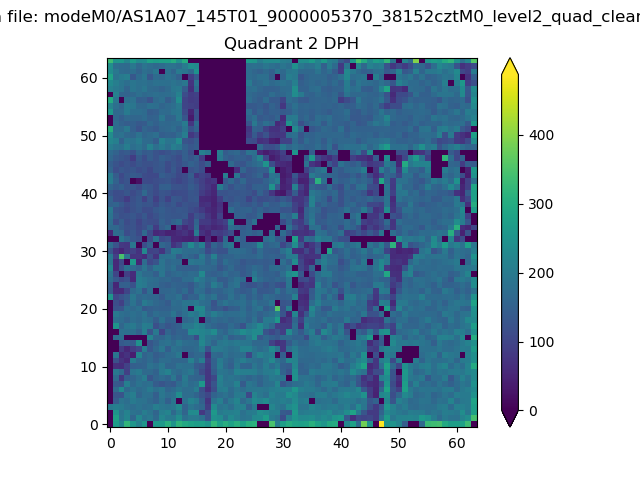 |
Quadrant C |
| Plot type | Count rate plots | Images |
|---|---|---|
| Comparison with Poisson distribution Blue bars denote a histogram of data divided into 1 sec bins. Red curve is a Poisson curve with rate = median count rate of data. |
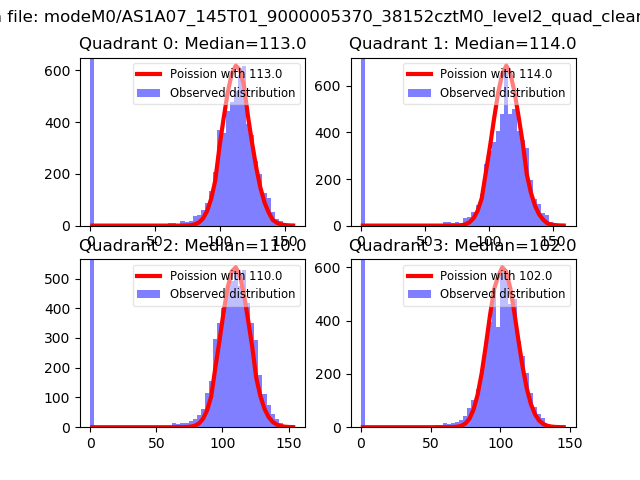 |
 |
| Quadrant-wise count rates Data is divided into 100 sec bins |
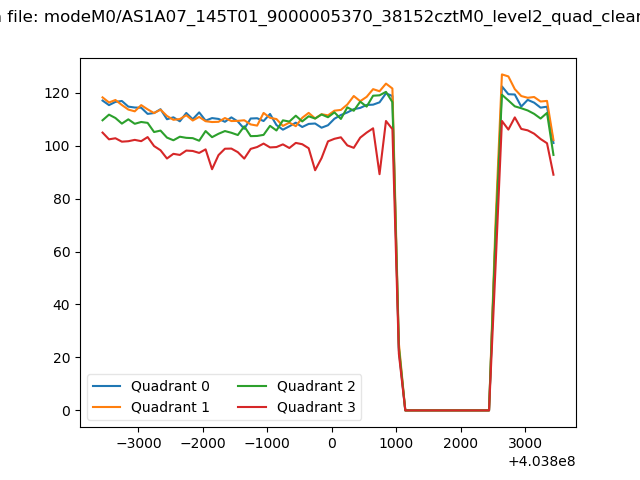 |
|
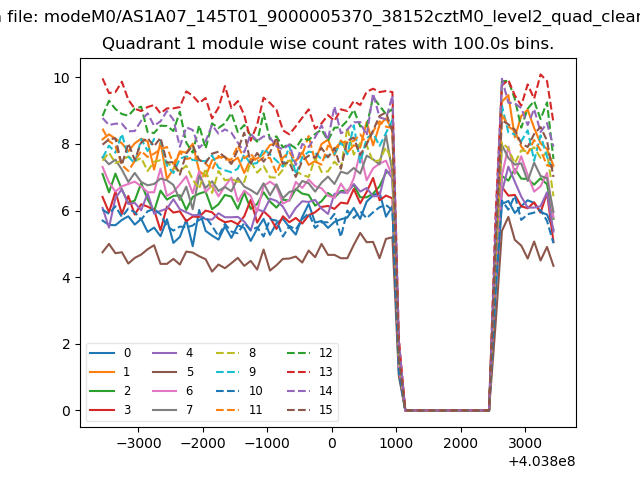
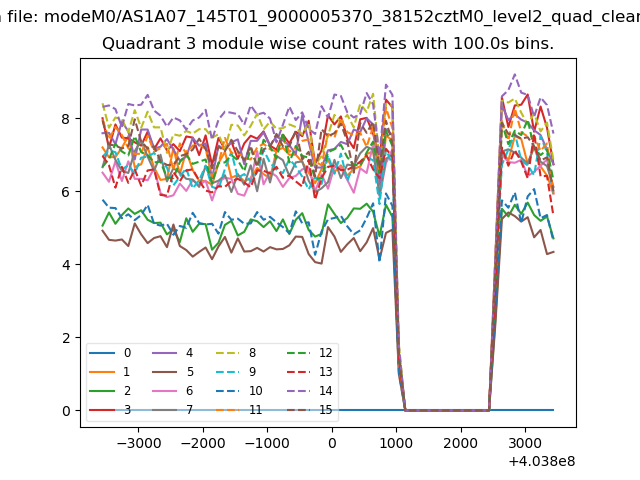
| Module-wise count rates for Quadrant A Data is divided into 100 sec bins |
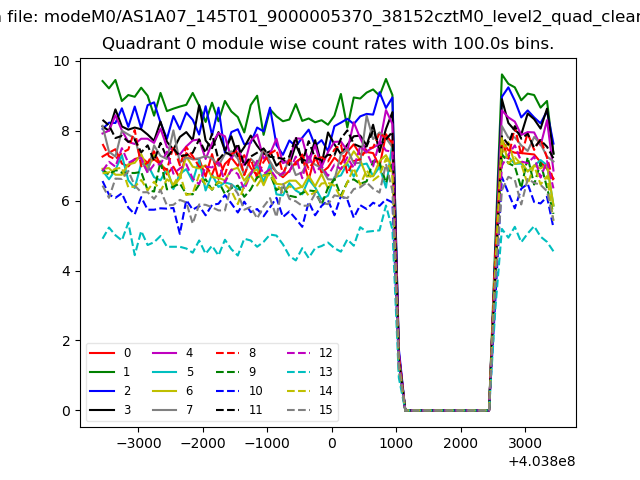 |
 |
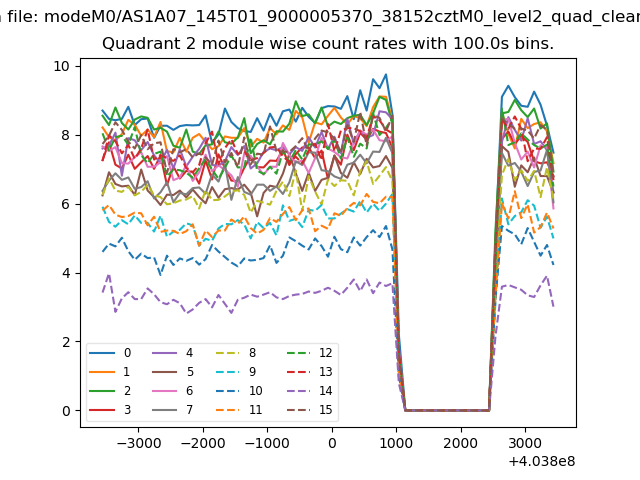
| Module-wise count rates for Quadrant B Data is divided into 100 sec bins |
 |
 |
| Module-wise count rates for Quadrant C Data is divided into 100 sec bins |
 |
 |
| Module-wise count rates for Quadrant D Data is divided into 100 sec bins |
 |
 |
| Parameter | Plot |
|---|---|
| CZT HV Monitor | 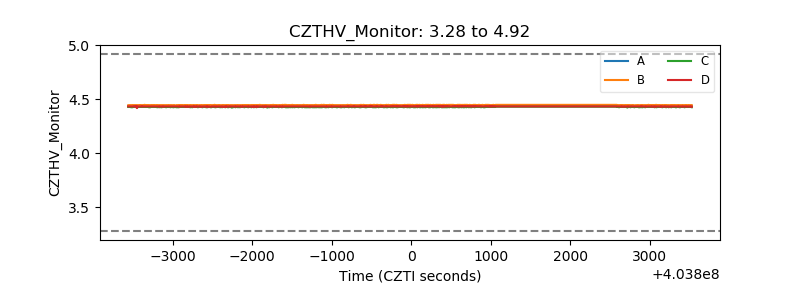 |
| D_VDD | 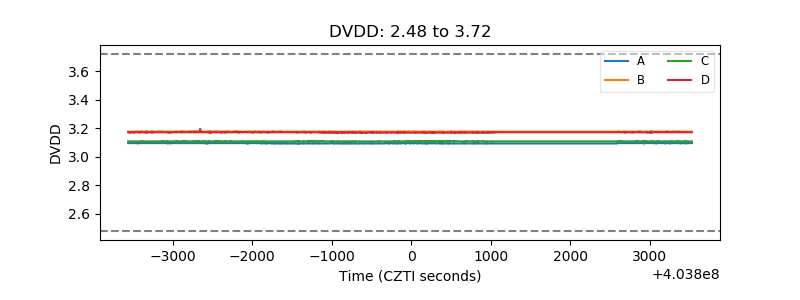 |
| Temperature 1 | 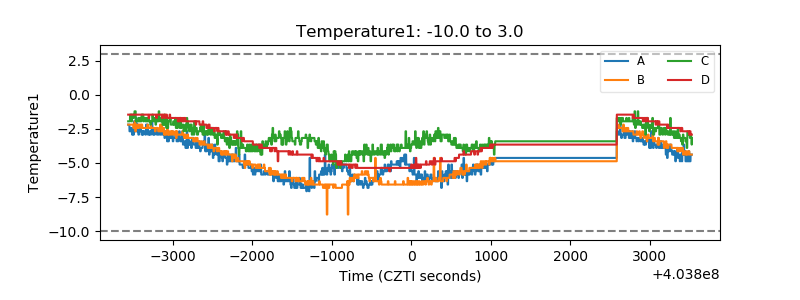 |
| Veto HV Monitor |  |
| Veto LLD | 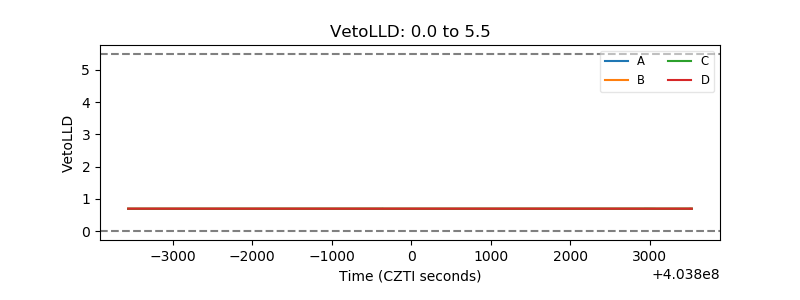 |
| Alpha Counter | 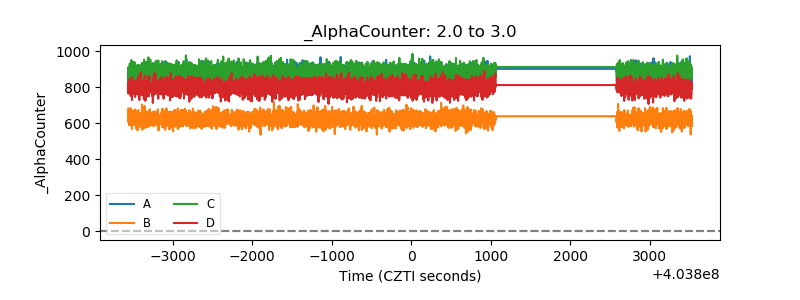 |
| _CPM_Rate | 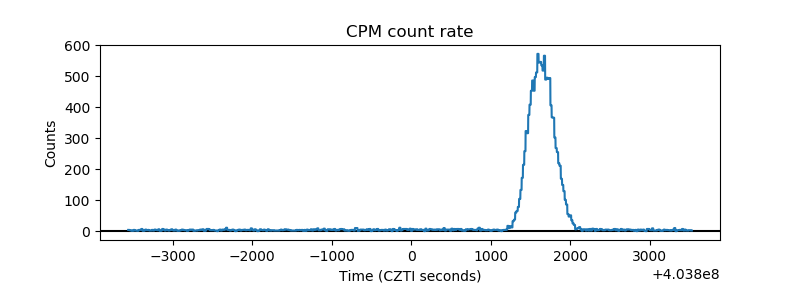 |
| CZT Counter | 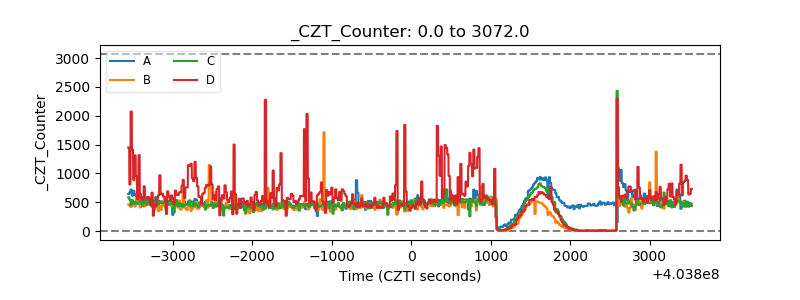 |
| +2.5 Volts monitor | 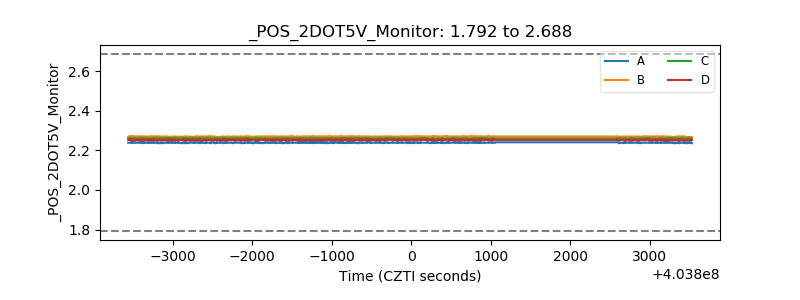 |
| +5 Volts monitor | 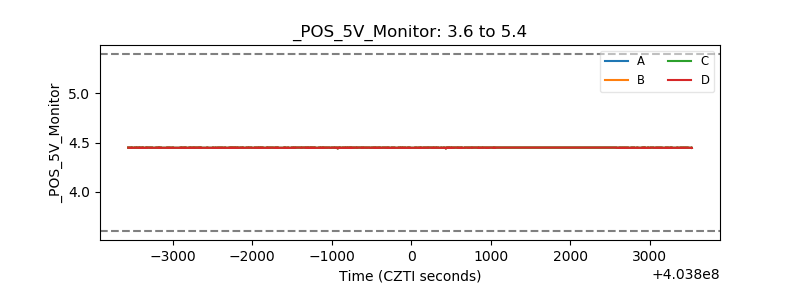 |
| _ROLL_ROT | 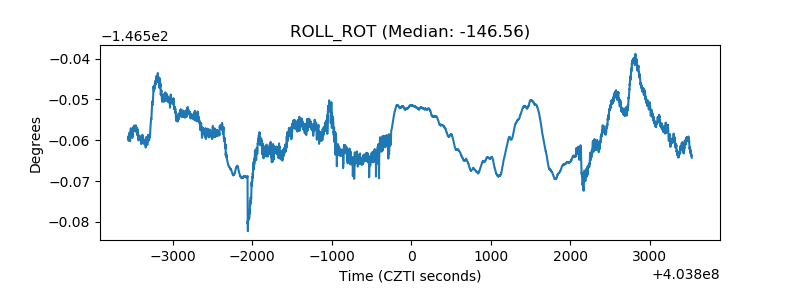 |
| _Roll_DEC | 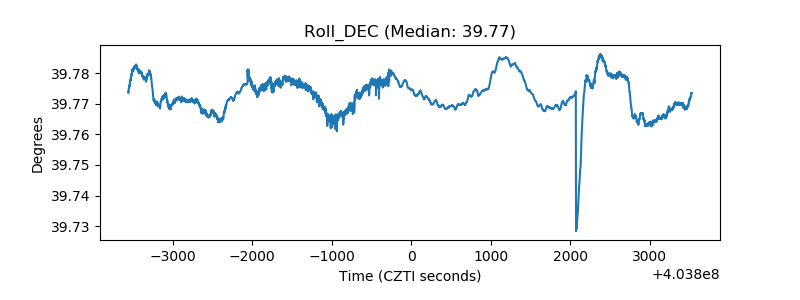 |
| _Roll_RA | 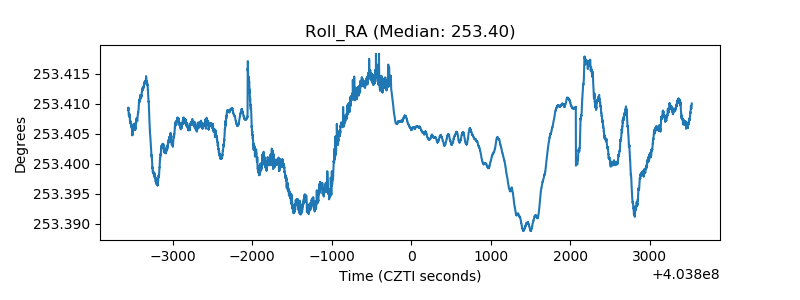 |
| Veto Counter | 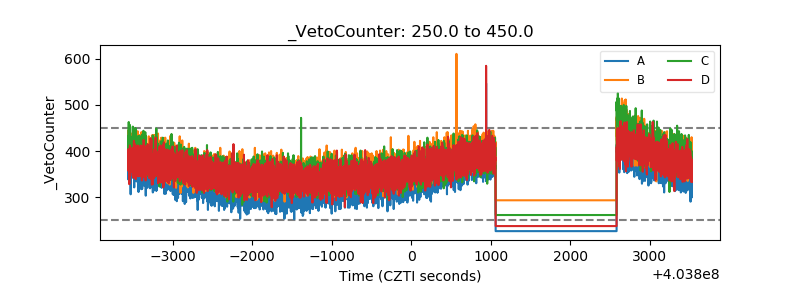 |