| Param | Original file | Final file |
|---|---|---|
| Filename | modeM0/AS1A07_145T01_9000005370_38153cztM0_level2.fits | modeM0/AS1A07_145T01_9000005370_38153cztM0_level2_quad_clean.evt |
| Size (bytes) | 333,694,080 | 94,625,280 |
| Size | 318.2 MB | 90.2 MB |
| Events in quadrant A | 2,822,141 | 634,217 |
| Events in quadrant B | 2,585,046 | 652,665 |
| Events in quadrant C | 2,725,507 | 621,745 |
| Events in quadrant D | 3,787,521 | 568,153 |
| Mode M9 | |||
|---|---|---|---|
| Quadrant | BADHDUFLAG | Total packets | Discarded packets |
| A | 0 | 17 | 0 |
| B | 0 | 17 | 0 |
| C | 0 | 17 | 0 |
| D | 0 | 17 | 0 |
| Mode SS | |||
|---|---|---|---|
| Quadrant | BADHDUFLAG | Total packets | Discarded packets |
| A | 0 | 114 | 0 |
| B | 0 | 114 | 0 |
| C | 0 | 114 | 0 |
| D | 0 | 114 | 0 |
| Mode M0 | |||
|---|---|---|---|
| Quadrant | BADHDUFLAG | Total packets | Discarded packets |
| A | 0 | 11865 | 3 |
| B | 0 | 11447 | 2 |
| C | 0 | 11374 | 2 |
| D | 0 | 14966 | 2 |
| Quadrant | Total seconds | Saturated seconds | Saturation percentage |
|---|---|---|---|
| A | 5548 | 8 | 0.144196% |
| B | 5548 | 7 | 0.126172% |
| C | 5548 | 9 | 0.162221% |
| D | 5548 | 104 | 1.874549% |
Noise dominated data is calculated using 1-second bins in cleaned event files. If a bin has >2000 counts, and if more than 50% of those come from <1% of pixels, then it is considered to be noise-dominated and hence unusable.
| Quadrant | # 1 sec bins | Bins with >0 counts | Bins with >2000 counts | High rate bins dominated by noise | Noise dominated (total time) | Noise dominated (detector-on time) | Marked lightcurve |
|---|---|---|---|---|---|---|---|
| A | 7222 | 5550 | 4 | 4 | 0.06% | 0.07% | 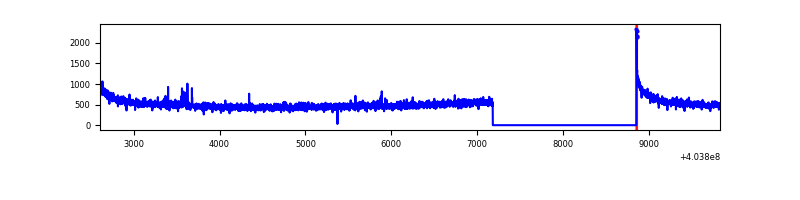 |
| B | 7222 | 5550 | 4 | 4 | 0.06% | 0.07% | 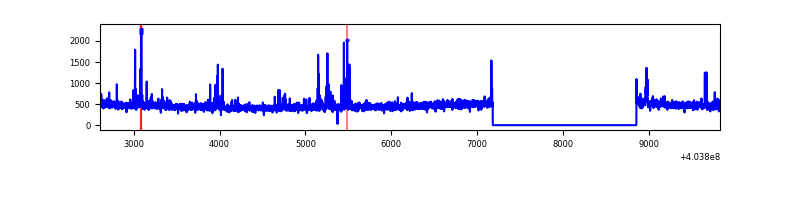 |
| C | 7222 | 5550 | 4 | 4 | 0.06% | 0.07% | 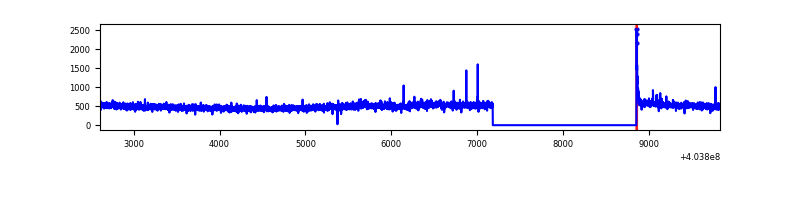 |
| D | 7222 | 5550 | 99 | 99 | 1.37% | 1.78% | 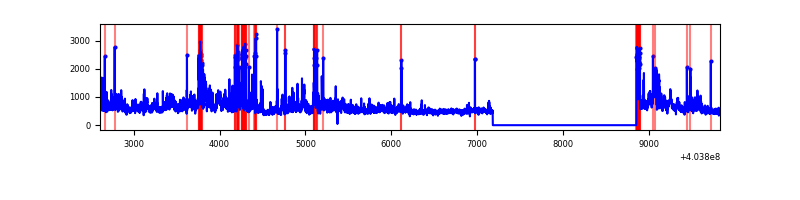 |
Top three noisy pixels from each quadrant. If the there are fewer than three noisy pixels in the level2.evt file, extra rows are filled as -1
| Pixel properties | Quadrant properties | ||||||
|---|---|---|---|---|---|---|---|
| Quadrant | DetID | PixID | Counts | Sigma | Mean | Median | Sigma |
| A | 10 | 83 | 372985 | 2950.22 | 620 | 607 | 126.2 |
| A | 12 | 189 | 20408 | 156.88 | 620 | 607 | 126.2 |
| A | 12 | 16 | 15464 | 117.71 | 620 | 607 | 126.2 |
| B | 4 | 171 | 65450 | 530.27 | 622 | 604 | 122.3 |
| B | 5 | 172 | 33609 | 269.89 | 622 | 604 | 122.3 |
| B | 0 | 229 | 23482 | 187.08 | 622 | 604 | 122.3 |
| C | 15 | 214 | 231591 | 1603.06 | 612 | 615 | 144.1 |
| C | 3 | 233 | 69092 | 475.26 | 612 | 615 | 144.1 |
| C | 0 | 10 | 21322 | 143.71 | 612 | 615 | 144.1 |
| D | 12 | 235 | 770820 | 5194.6 | 606 | 587 | 148.3 |
| D | 13 | 249 | 188898 | 1270.01 | 606 | 587 | 148.3 |
| D | 7 | 55 | 179516 | 1206.73 | 606 | 587 | 148.3 |
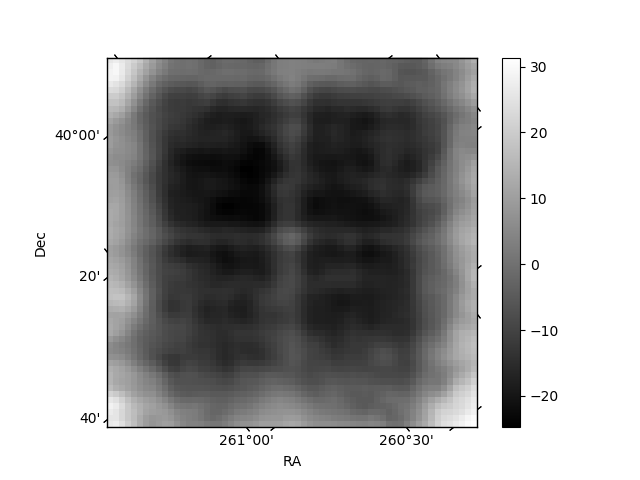
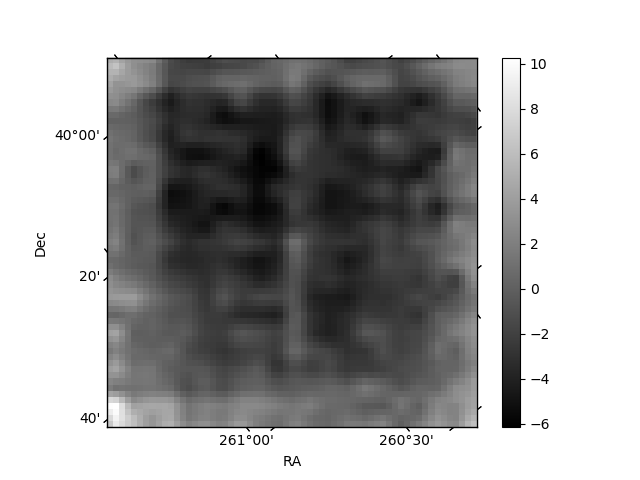
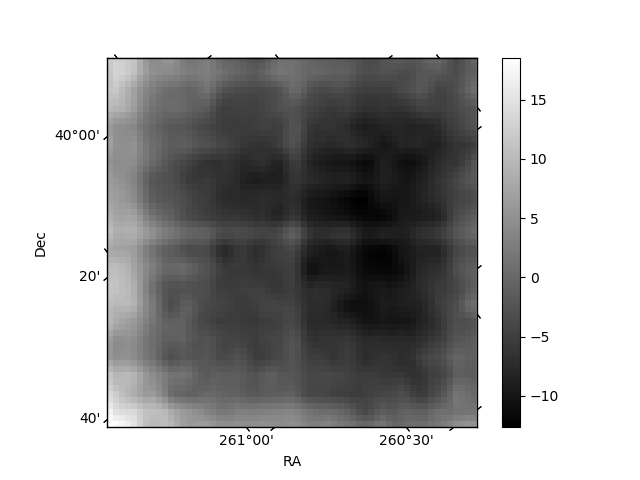
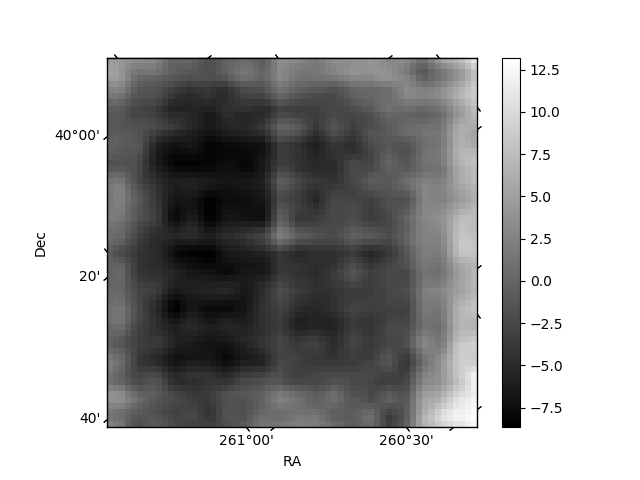
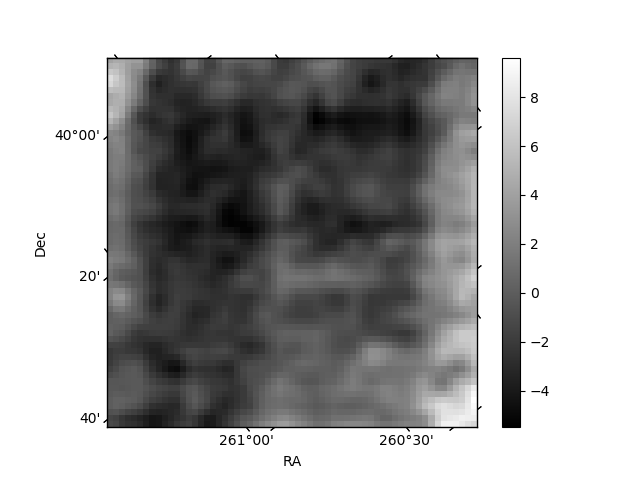
Histogram calculated using DETX and DETY for each event in the final _common_clean file
| Quadrant A | 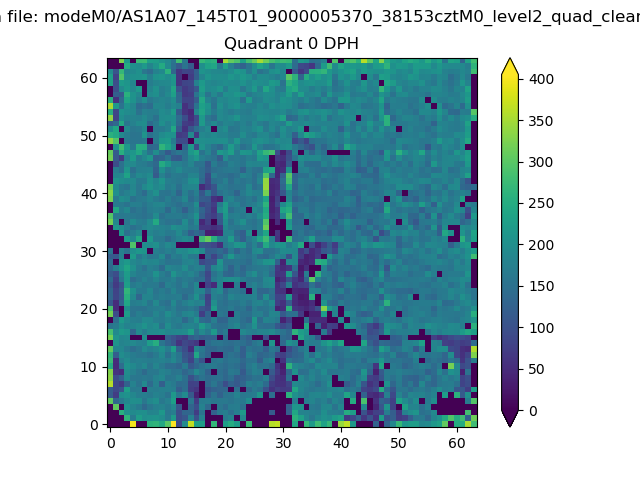 |
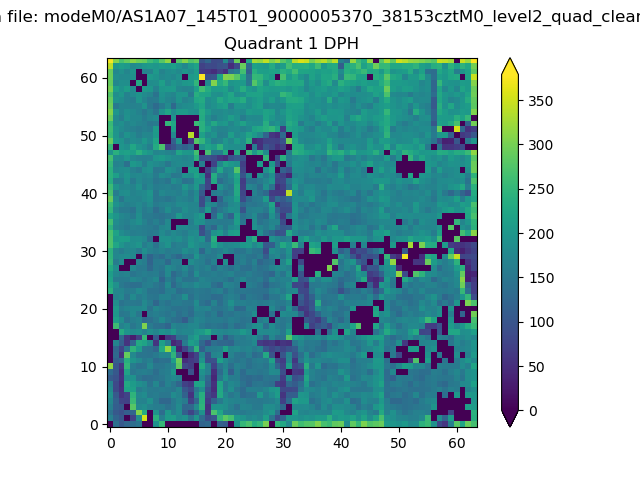 |
Quadrant B |
|---|---|---|---|
| Quadrant D | 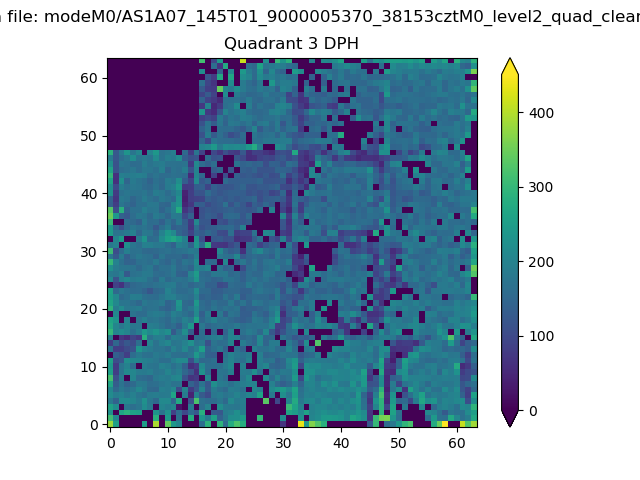 |
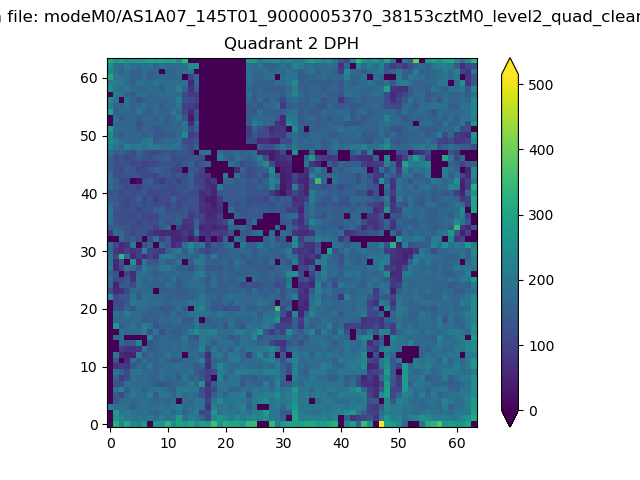 |
Quadrant C |
| Plot type | Count rate plots | Images |
|---|---|---|
| Comparison with Poisson distribution Blue bars denote a histogram of data divided into 1 sec bins. Red curve is a Poisson curve with rate = median count rate of data. |
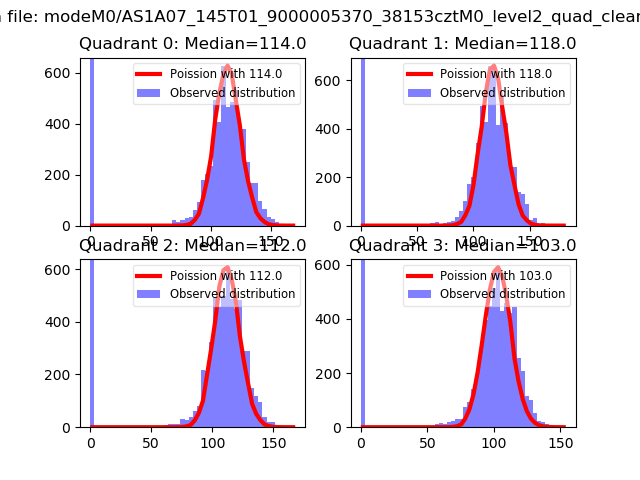 |
 |
| Quadrant-wise count rates Data is divided into 100 sec bins |
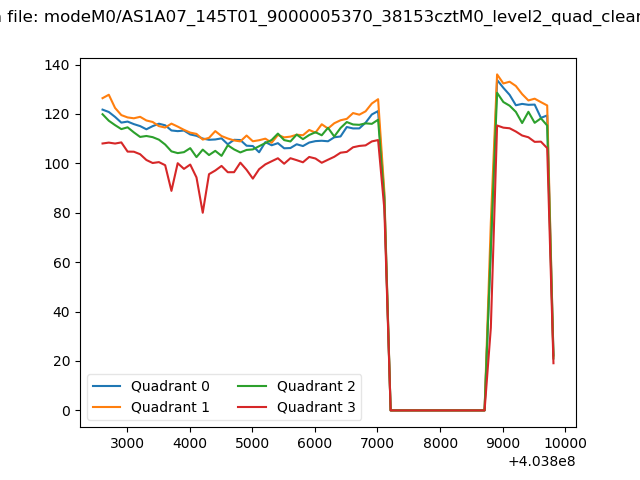 |
|
| Module-wise count rates for Quadrant A Data is divided into 100 sec bins |
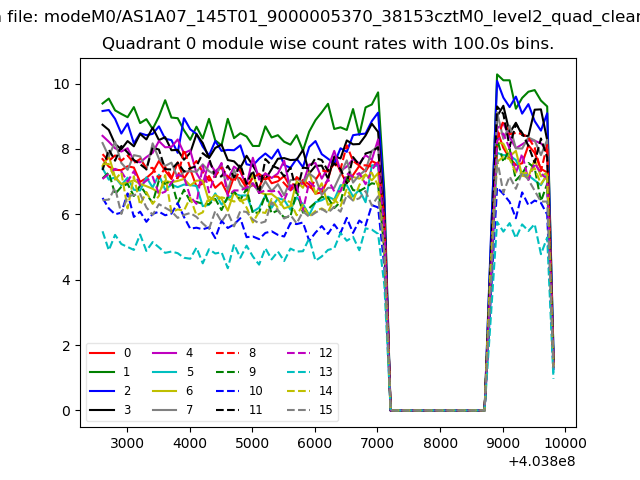 |
 |
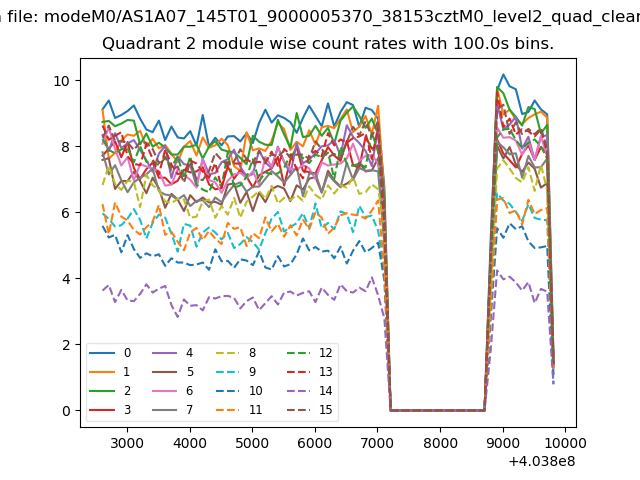
| Module-wise count rates for Quadrant B Data is divided into 100 sec bins |
 |
 |
| Module-wise count rates for Quadrant C Data is divided into 100 sec bins |
 |
 |
| Module-wise count rates for Quadrant D Data is divided into 100 sec bins |
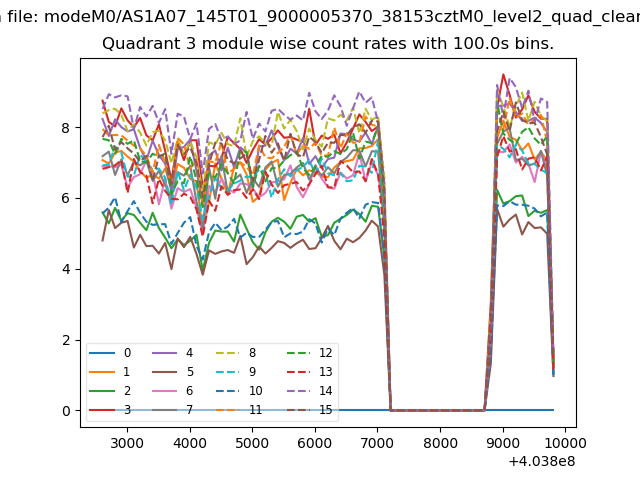 |
 |
| Parameter | Plot |
|---|---|
| CZT HV Monitor | 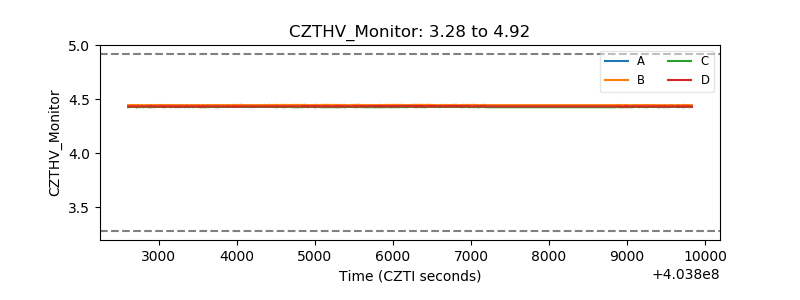 |
| D_VDD | 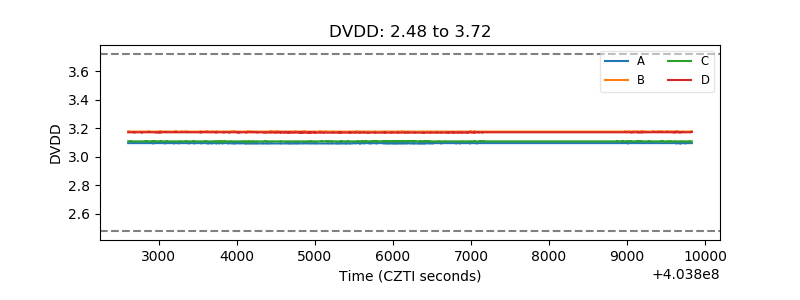 |
| Temperature 1 | 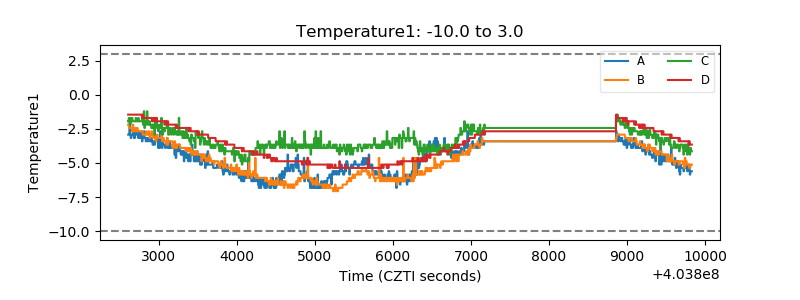 |
| Veto HV Monitor | 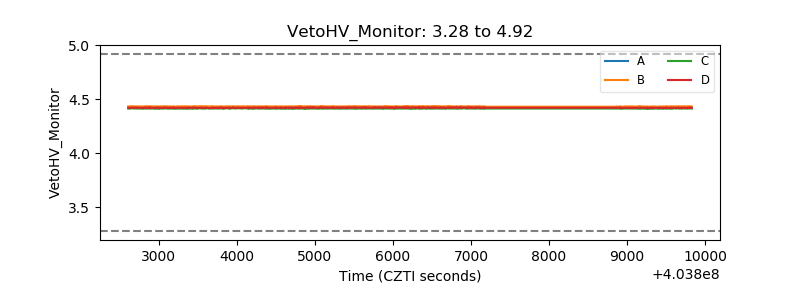 |
| Veto LLD | 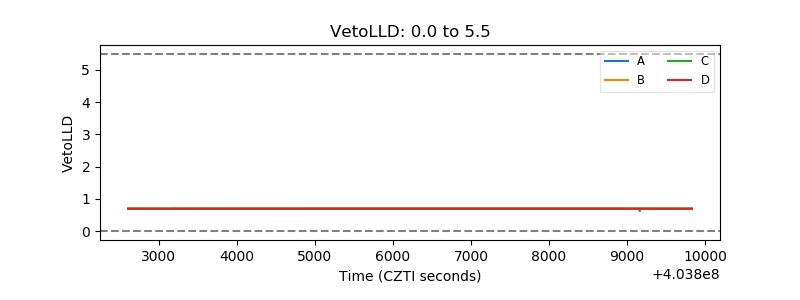 |
| Alpha Counter | 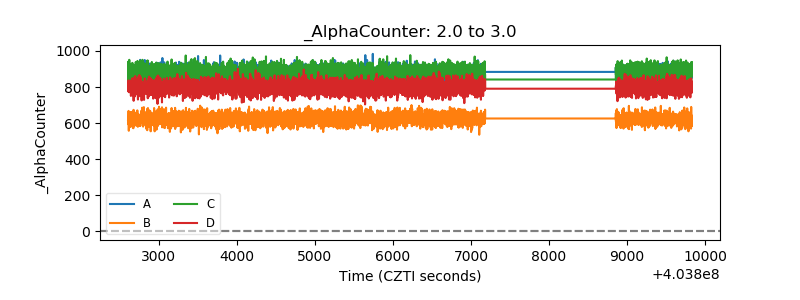 |
| _CPM_Rate | 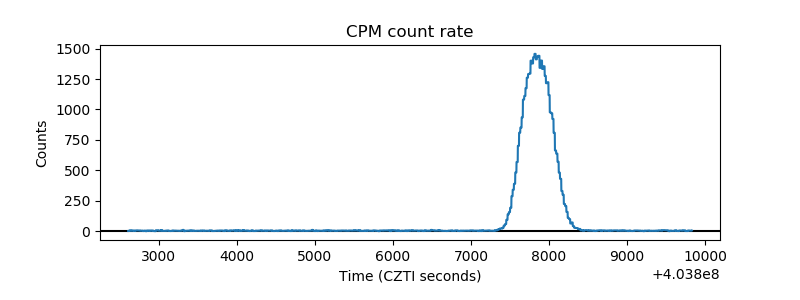 |
| CZT Counter | 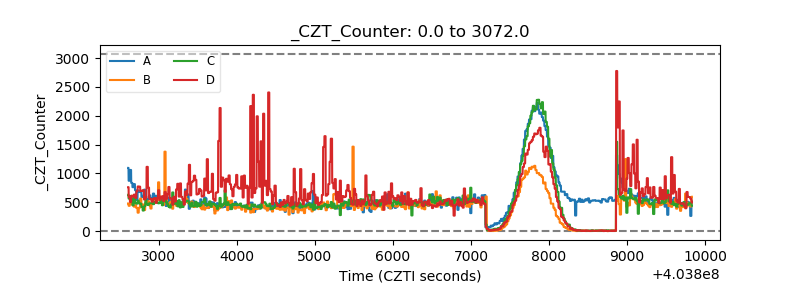 |
| +2.5 Volts monitor | 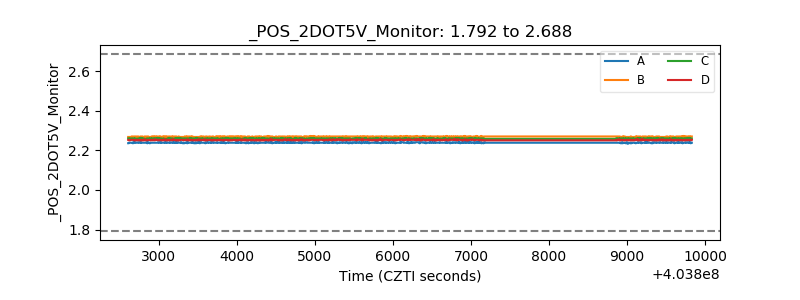 |
| +5 Volts monitor | 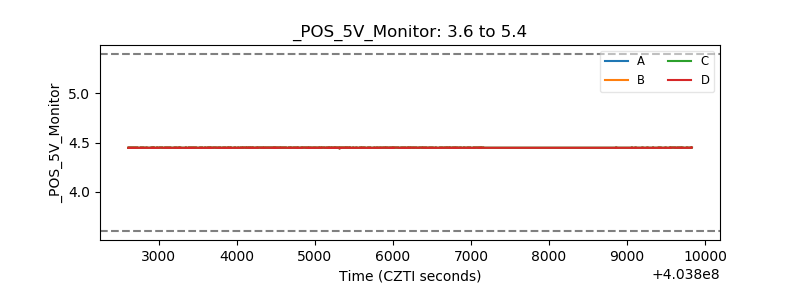 |
| _ROLL_ROT | 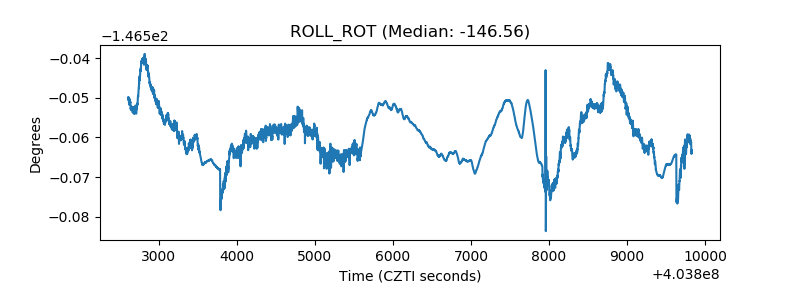 |
| _Roll_DEC | 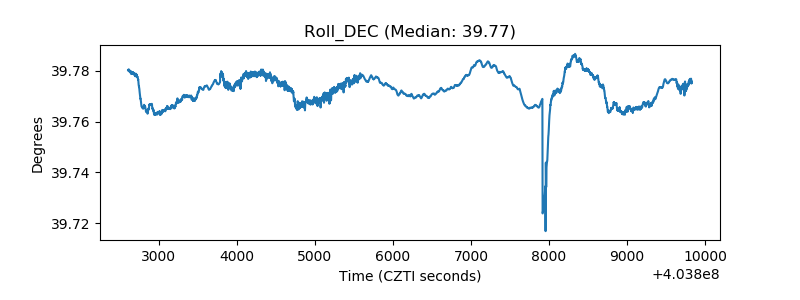 |
| _Roll_RA | 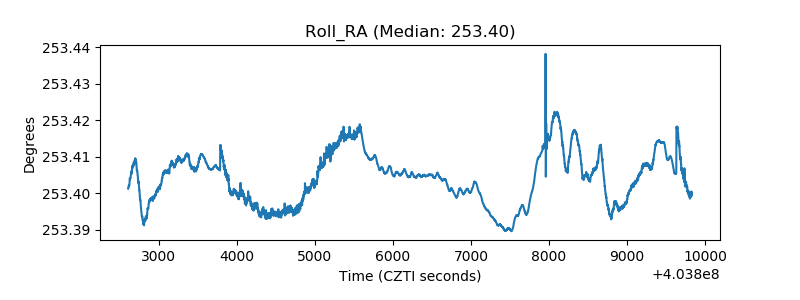 |
| Veto Counter | 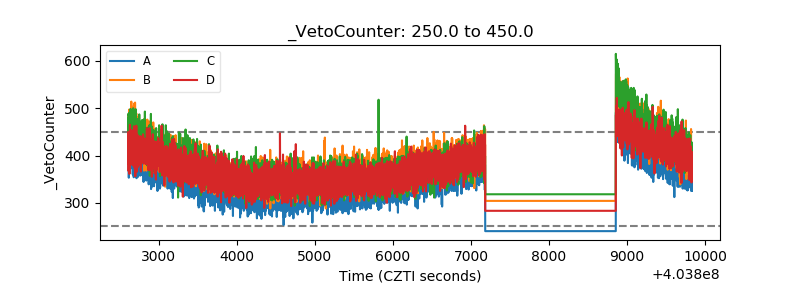 |