| Param | Original file | Final file |
|---|---|---|
| Filename | modeM0/AS1A07_145T01_9000005370_38155cztM0_level2.fits | modeM0/AS1A07_145T01_9000005370_38155cztM0_level2_quad_clean.evt |
| Size (bytes) | 320,846,400 | 94,835,520 |
| Size | 306.0 MB | 90.4 MB |
| Events in quadrant A | 2,793,184 | 636,244 |
| Events in quadrant B | 2,691,541 | 657,320 |
| Events in quadrant C | 2,687,769 | 627,642 |
| Events in quadrant D | 3,287,221 | 575,997 |
| Mode M9 | |||
|---|---|---|---|
| Quadrant | BADHDUFLAG | Total packets | Discarded packets |
| A | 0 | 18 | 0 |
| B | 0 | 18 | 0 |
| C | 0 | 18 | 0 |
| D | 0 | 19 | 0 |
| Mode SS | |||
|---|---|---|---|
| Quadrant | BADHDUFLAG | Total packets | Discarded packets |
| A | 0 | 108 | 0 |
| B | 0 | 108 | 0 |
| C | 0 | 108 | 0 |
| D | 0 | 108 | 0 |
| Mode M0 | |||
|---|---|---|---|
| Quadrant | BADHDUFLAG | Total packets | Discarded packets |
| A | 0 | 11589 | 3 |
| B | 0 | 11464 | 2 |
| C | 0 | 11163 | 2 |
| D | 0 | 13397 | 2 |
| Quadrant | Total seconds | Saturated seconds | Saturation percentage |
|---|---|---|---|
| A | 5353 | 14 | 0.261536% |
| B | 5353 | 29 | 0.541752% |
| C | 5353 | 13 | 0.242854% |
| D | 5353 | 67 | 1.251635% |
Noise dominated data is calculated using 1-second bins in cleaned event files. If a bin has >2000 counts, and if more than 50% of those come from <1% of pixels, then it is considered to be noise-dominated and hence unusable.
| Quadrant | # 1 sec bins | Bins with >0 counts | Bins with >2000 counts | High rate bins dominated by noise | Noise dominated (total time) | Noise dominated (detector-on time) | Marked lightcurve |
|---|---|---|---|---|---|---|---|
| A | 7146 | 5354 | 8 | 8 | 0.11% | 0.15% | 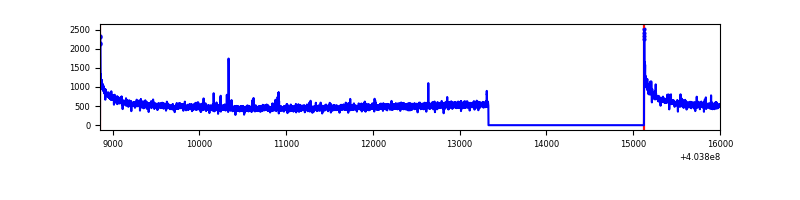 |
| B | 7146 | 5354 | 15 | 15 | 0.21% | 0.28% | 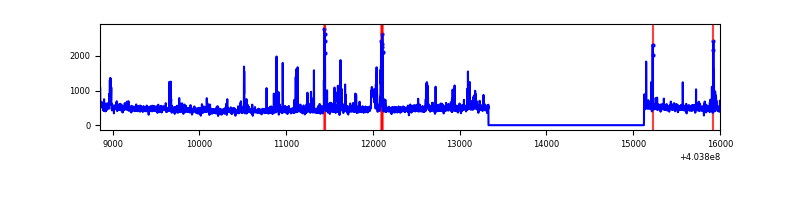 |
| C | 7146 | 5354 | 8 | 8 | 0.11% | 0.15% | 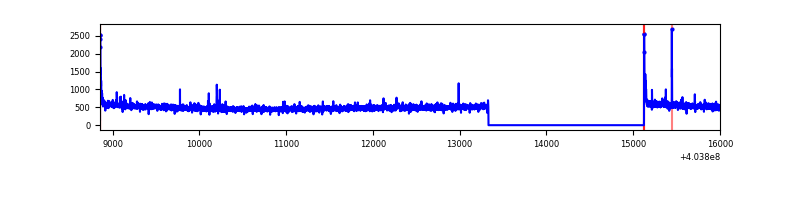 |
| D | 7146 | 5354 | 56 | 56 | 0.78% | 1.05% | 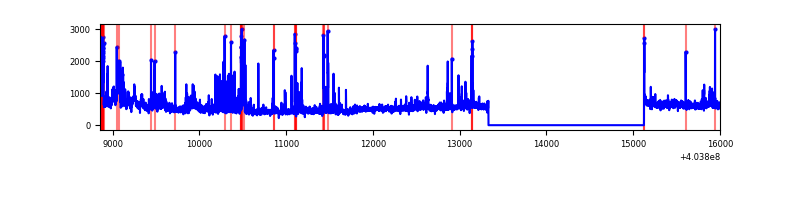 |
Top three noisy pixels from each quadrant. If the there are fewer than three noisy pixels in the level2.evt file, extra rows are filled as -1
| Pixel properties | Quadrant properties | ||||||
|---|---|---|---|---|---|---|---|
| Quadrant | DetID | PixID | Counts | Sigma | Mean | Median | Sigma |
| A | 10 | 83 | 372420 | 2992.82 | 612 | 601 | 124.2 |
| A | 13 | 6 | 12805 | 98.23 | 612 | 601 | 124.2 |
| A | 12 | 189 | 12086 | 92.44 | 612 | 601 | 124.2 |
| B | 4 | 171 | 158928 | 1350.55 | 614 | 597 | 117.2 |
| B | 5 | 172 | 70225 | 593.92 | 614 | 597 | 117.2 |
| B | 0 | 229 | 19723 | 163.14 | 614 | 597 | 117.2 |
| C | 15 | 214 | 225715 | 1583.57 | 607 | 612 | 142.1 |
| C | 0 | 10 | 33366 | 230.42 | 607 | 612 | 142.1 |
| C | 0 | 239 | 29099 | 200.4 | 607 | 612 | 142.1 |
| D | 12 | 235 | 240907 | 1653.79 | 601 | 585 | 145.3 |
| D | 10 | 203 | 221721 | 1521.76 | 601 | 585 | 145.3 |
| D | 7 | 55 | 157200 | 1077.75 | 601 | 585 | 145.3 |
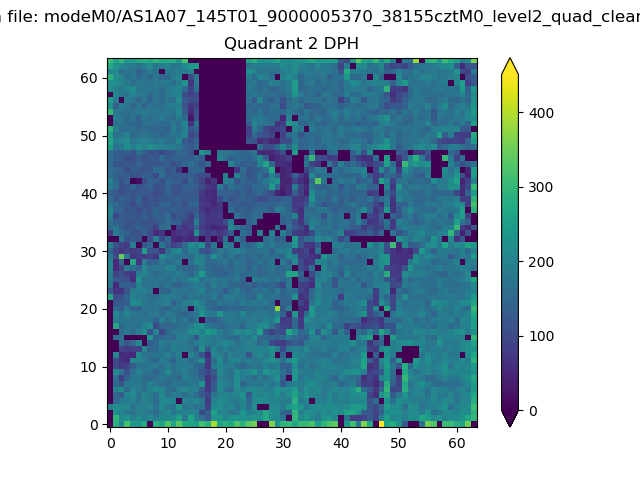
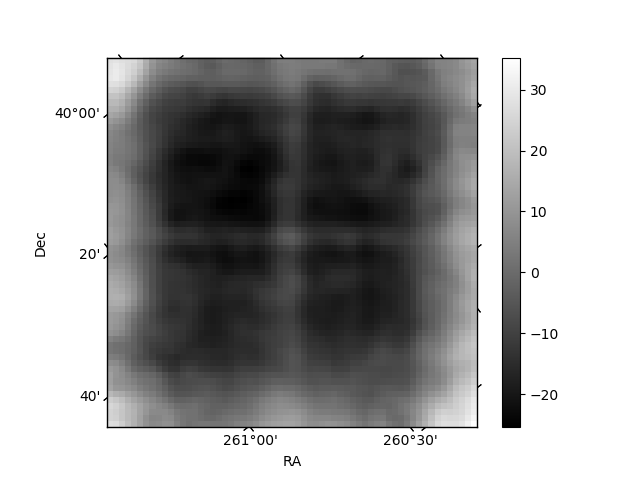
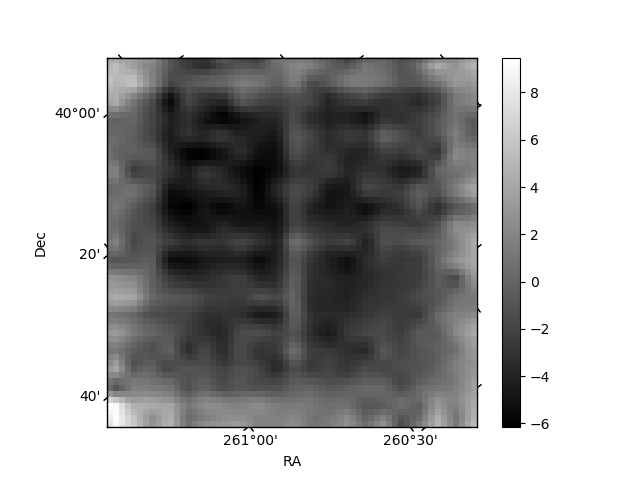
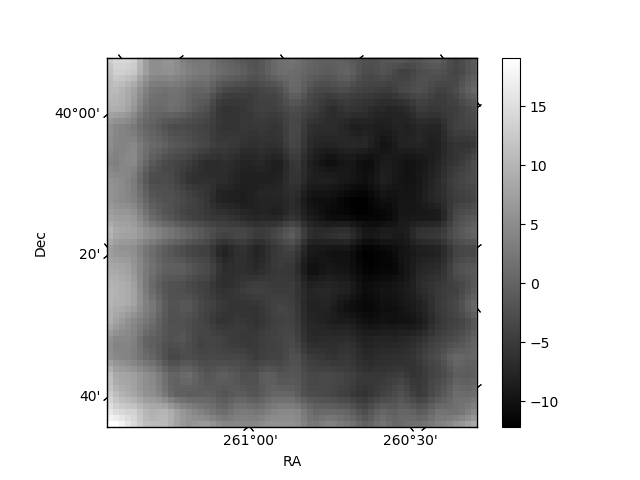
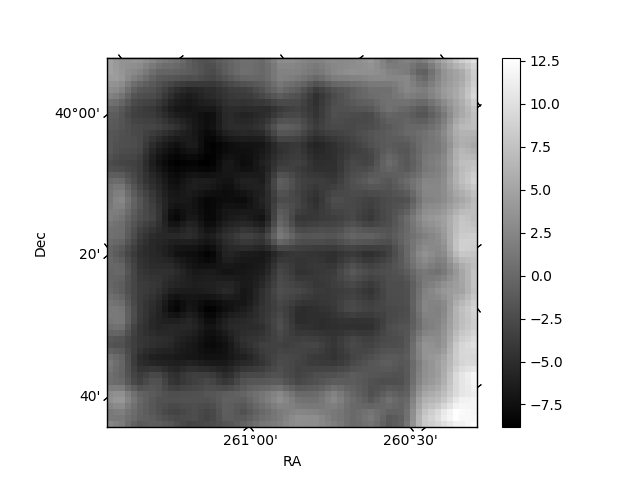
Histogram calculated using DETX and DETY for each event in the final _common_clean file
| Quadrant A | 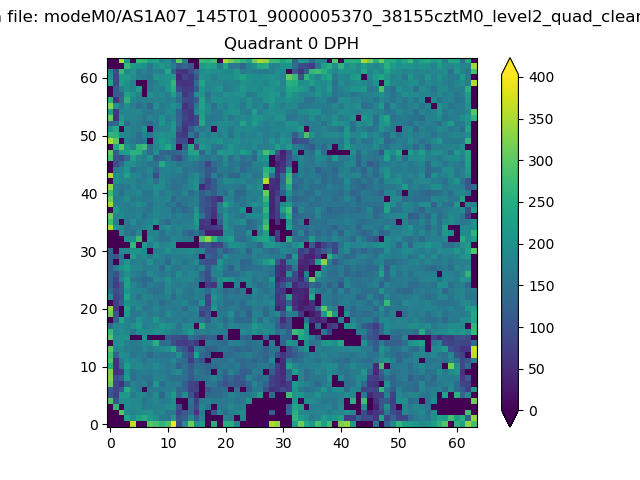 |
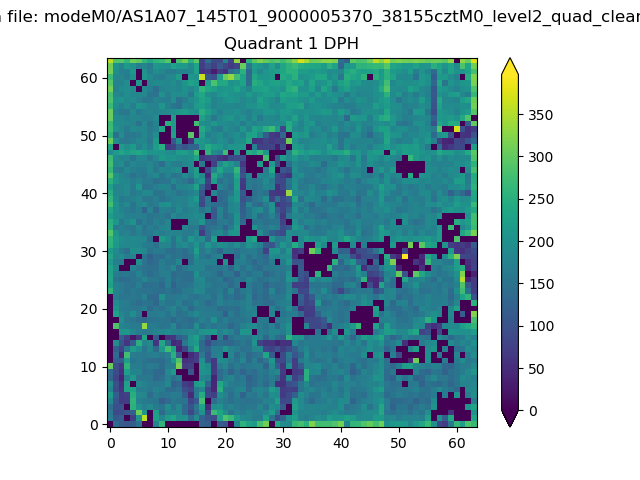 |
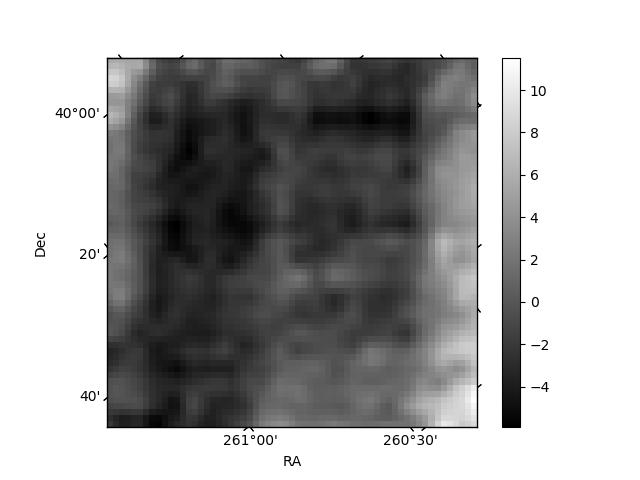
Quadrant B |
|---|---|---|---|
| Quadrant D | 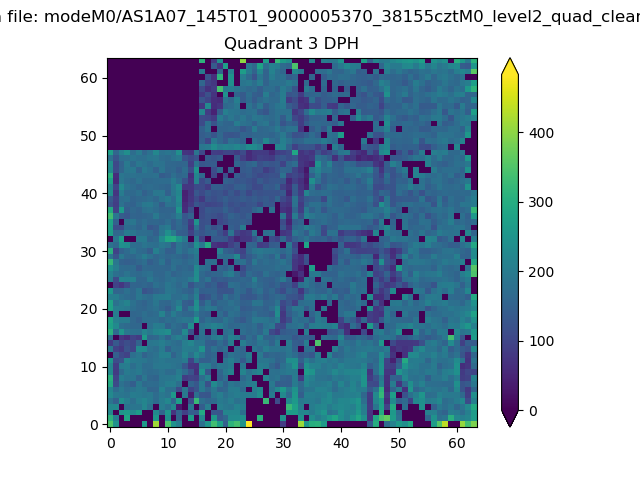 |
 |
Quadrant C |
| Plot type | Count rate plots | Images |
|---|---|---|
| Comparison with Poisson distribution Blue bars denote a histogram of data divided into 1 sec bins. Red curve is a Poisson curve with rate = median count rate of data. |
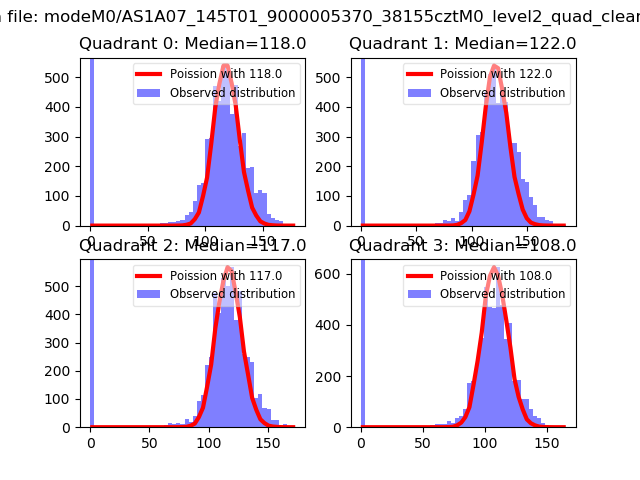 |
 |
| Quadrant-wise count rates Data is divided into 100 sec bins |
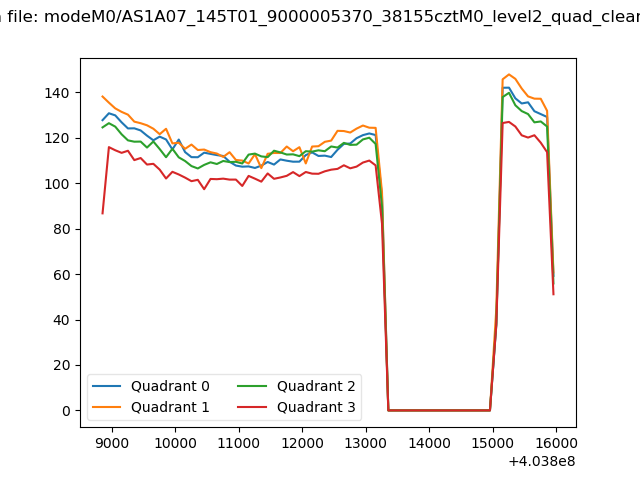 |
|
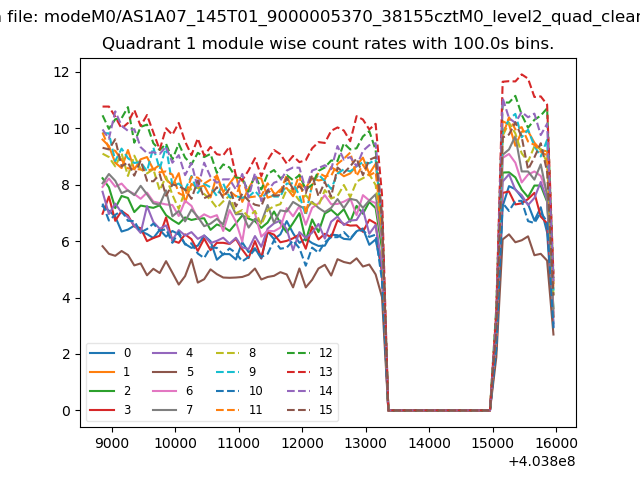
| Module-wise count rates for Quadrant A Data is divided into 100 sec bins |
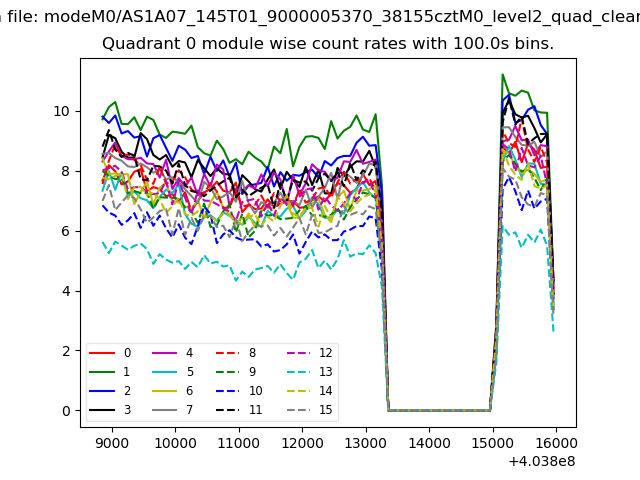 |
 |
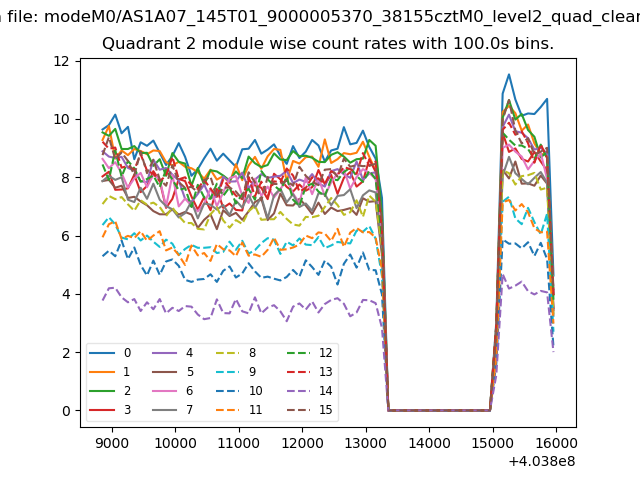
| Module-wise count rates for Quadrant B Data is divided into 100 sec bins |
 |
 |
| Module-wise count rates for Quadrant C Data is divided into 100 sec bins |
 |
 |
| Module-wise count rates for Quadrant D Data is divided into 100 sec bins |
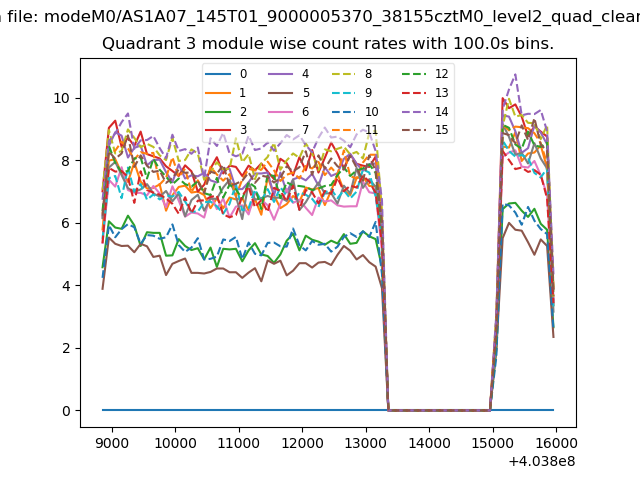 |
 |
| Parameter | Plot |
|---|---|
| CZT HV Monitor | 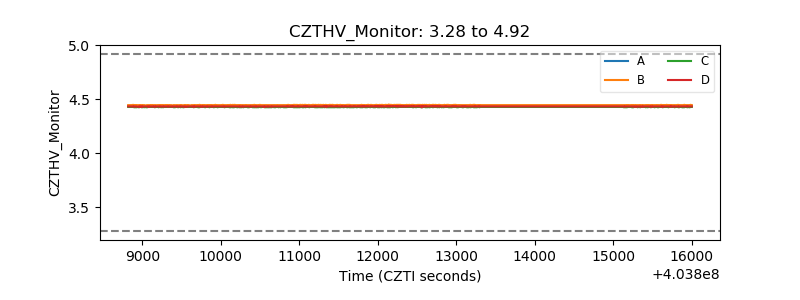 |
| D_VDD | 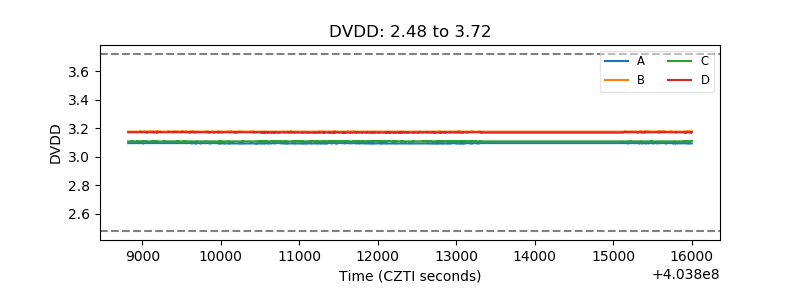 |
| Temperature 1 | 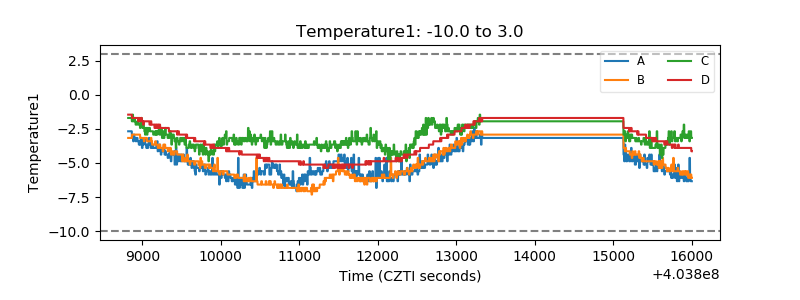 |
| Veto HV Monitor |  |
| Veto LLD | 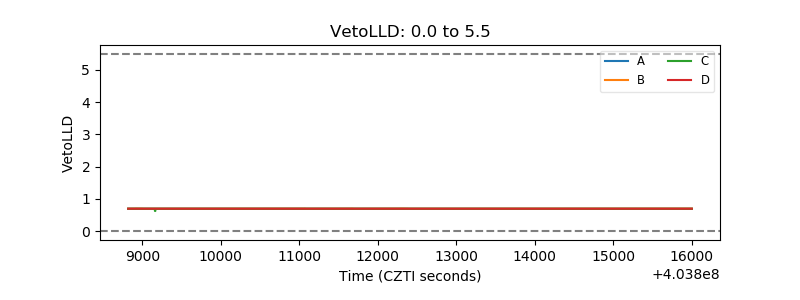 |
| Alpha Counter | 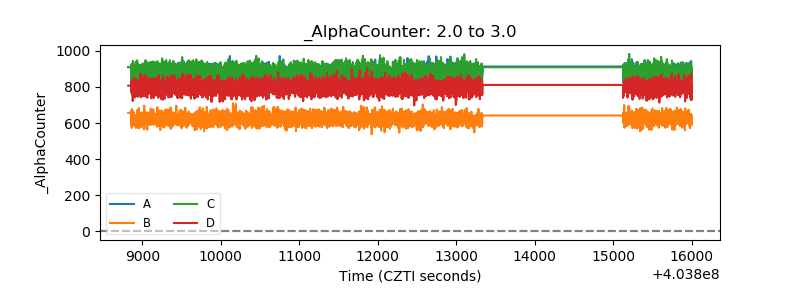 |
| _CPM_Rate | 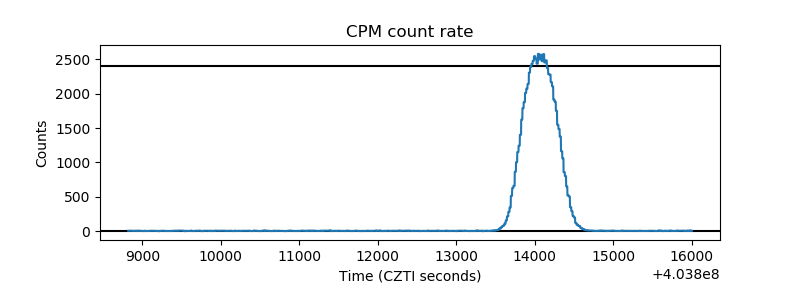 |
| CZT Counter | 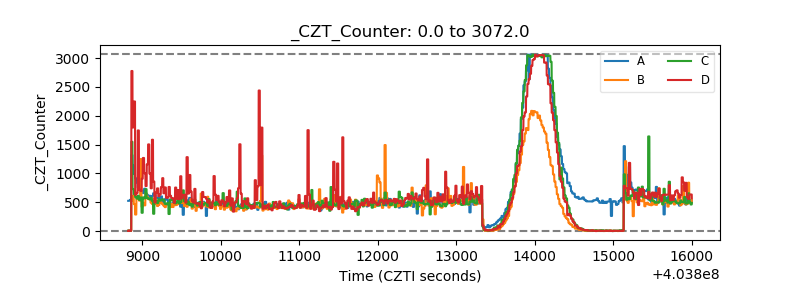 |
| +2.5 Volts monitor | 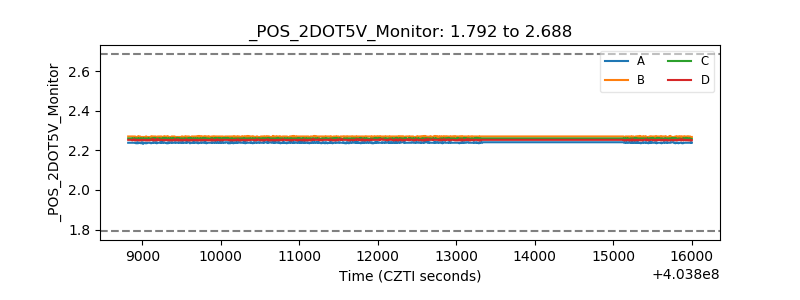 |
| +5 Volts monitor | 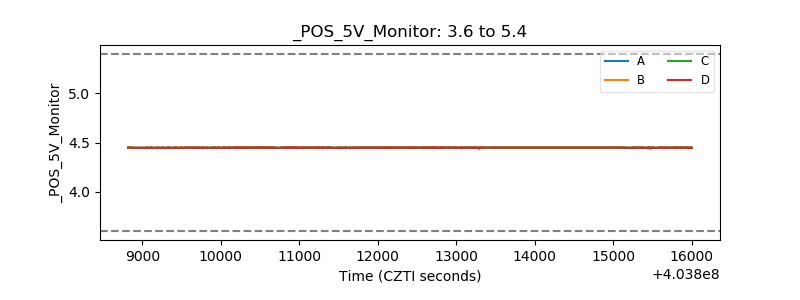 |
| _ROLL_ROT | 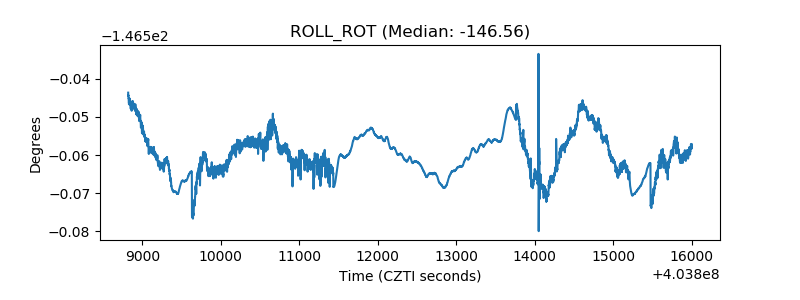 |
| _Roll_DEC | 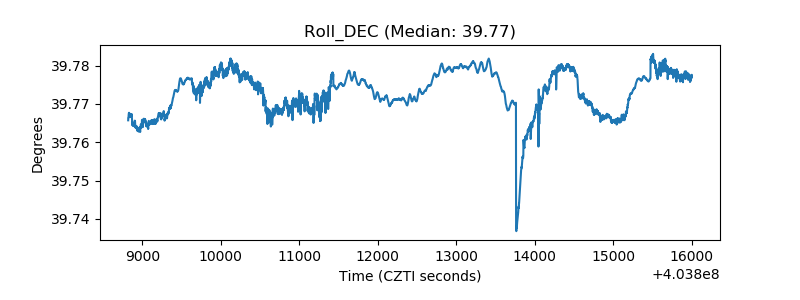 |
| _Roll_RA | 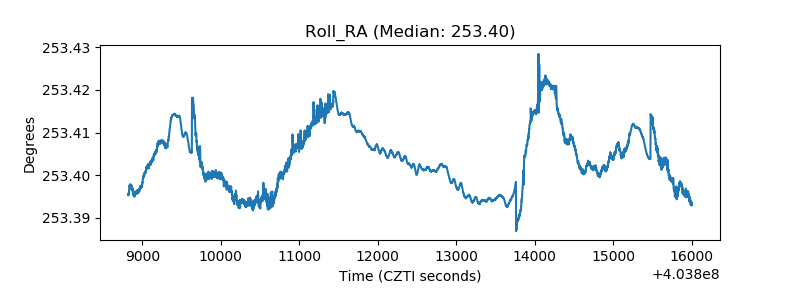 |
| Veto Counter | 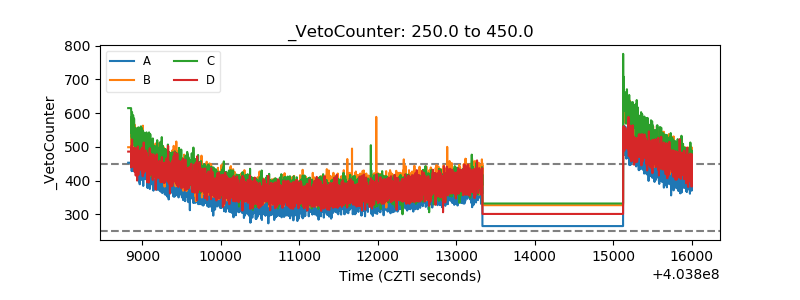 |