| Param | Original file | Final file |
|---|---|---|
| Filename | modeM0/AS1A07_145T01_9000005370_38156cztM0_level2.fits | modeM0/AS1A07_145T01_9000005370_38156cztM0_level2_quad_clean.evt |
| Size (bytes) | 327,844,800 | 99,800,640 |
| Size | 312.7 MB | 95.2 MB |
| Events in quadrant A | 2,847,473 | 672,176 |
| Events in quadrant B | 2,751,667 | 694,867 |
| Events in quadrant C | 2,801,228 | 665,861 |
| Events in quadrant D | 3,317,769 | 614,212 |
| Mode M9 | |||
|---|---|---|---|
| Quadrant | BADHDUFLAG | Total packets | Discarded packets |
| A | 0 | 30 | 0 |
| B | 0 | 30 | 0 |
| C | 0 | 30 | 0 |
| D | 0 | 31 | 0 |
| Mode SS | |||
|---|---|---|---|
| Quadrant | BADHDUFLAG | Total packets | Discarded packets |
| A | 0 | 108 | 0 |
| B | 0 | 108 | 0 |
| C | 0 | 108 | 0 |
| D | 0 | 108 | 0 |
| Mode M0 | |||
|---|---|---|---|
| Quadrant | BADHDUFLAG | Total packets | Discarded packets |
| A | 0 | 11681 | 3 |
| B | 0 | 11463 | 2 |
| C | 0 | 11433 | 2 |
| D | 0 | 13273 | 2 |
| Quadrant | Total seconds | Saturated seconds | Saturation percentage |
|---|---|---|---|
| A | 5362 | 11 | 0.205147% |
| B | 5362 | 53 | 0.988437% |
| C | 5362 | 16 | 0.298396% |
| D | 5362 | 42 | 0.783290% |
Noise dominated data is calculated using 1-second bins in cleaned event files. If a bin has >2000 counts, and if more than 50% of those come from <1% of pixels, then it is considered to be noise-dominated and hence unusable.
| Quadrant | # 1 sec bins | Bins with >0 counts | Bins with >2000 counts | High rate bins dominated by noise | Noise dominated (total time) | Noise dominated (detector-on time) | Marked lightcurve |
|---|---|---|---|---|---|---|---|
| A | 7275 | 5363 | 8 | 8 | 0.11% | 0.15% | 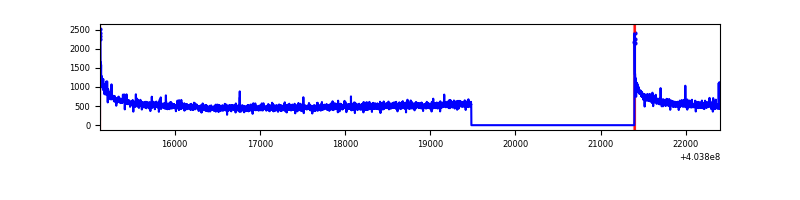 |
| B | 7275 | 5363 | 31 | 31 | 0.43% | 0.58% | 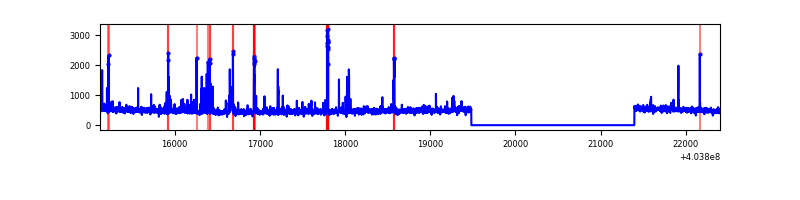 |
| C | 7275 | 5363 | 15 | 15 | 0.21% | 0.28% | 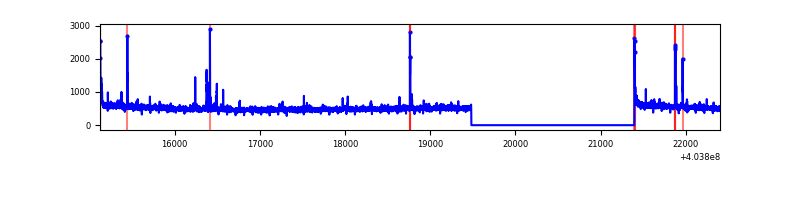 |
| D | 7275 | 5363 | 40 | 40 | 0.55% | 0.75% | 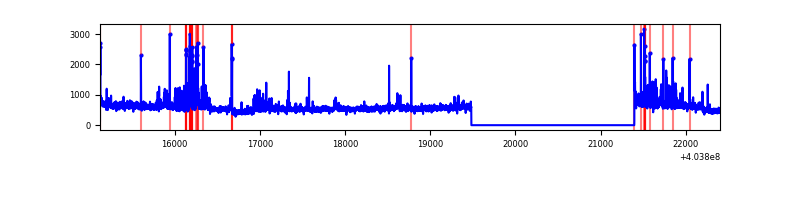 |
Top three noisy pixels from each quadrant. If the there are fewer than three noisy pixels in the level2.evt file, extra rows are filled as -1
| Pixel properties | Quadrant properties | ||||||
|---|---|---|---|---|---|---|---|
| Quadrant | DetID | PixID | Counts | Sigma | Mean | Median | Sigma |
| A | 10 | 83 | 365170 | 2866.18 | 631 | 620 | 127.2 |
| A | 12 | 189 | 12732 | 95.23 | 631 | 620 | 127.2 |
| A | 12 | 16 | 10333 | 76.37 | 631 | 620 | 127.2 |
| B | 4 | 171 | 130953 | 1081.29 | 635 | 617 | 120.5 |
| B | 5 | 172 | 98141 | 809.07 | 635 | 617 | 120.5 |
| B | 12 | 111 | 14660 | 116.5 | 635 | 617 | 120.5 |
| C | 15 | 214 | 225004 | 1546.83 | 627 | 633 | 145.1 |
| C | 0 | 10 | 29556 | 199.4 | 627 | 633 | 145.1 |
| C | 1 | 23 | 23387 | 156.87 | 627 | 633 | 145.1 |
| D | 10 | 203 | 448176 | 2953.95 | 621 | 605 | 151.5 |
| D | 7 | 55 | 224956 | 1480.71 | 621 | 605 | 151.5 |
| D | 13 | 249 | 80346 | 526.29 | 621 | 605 | 151.5 |
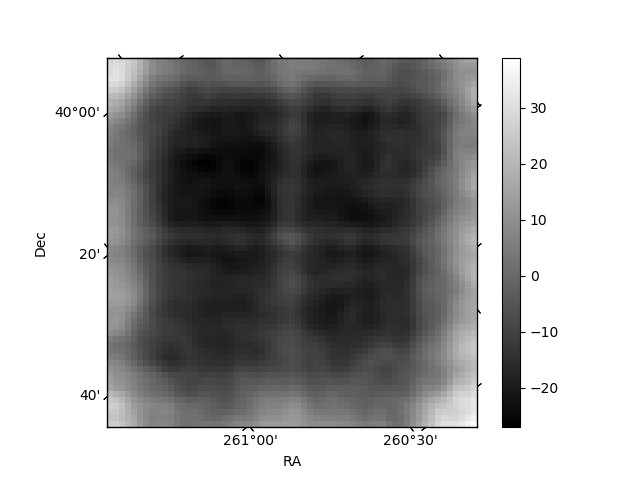
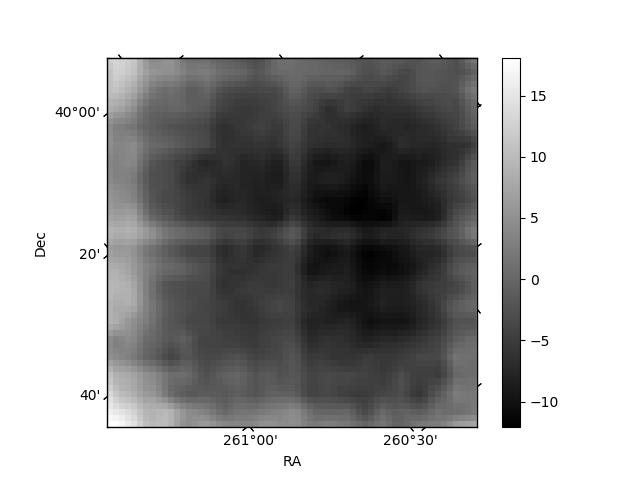
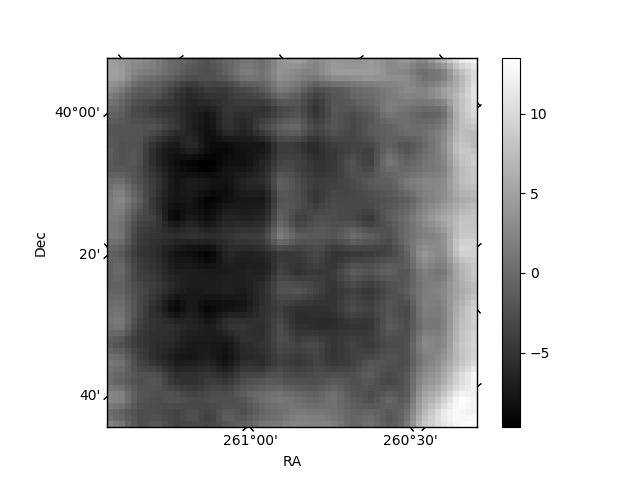
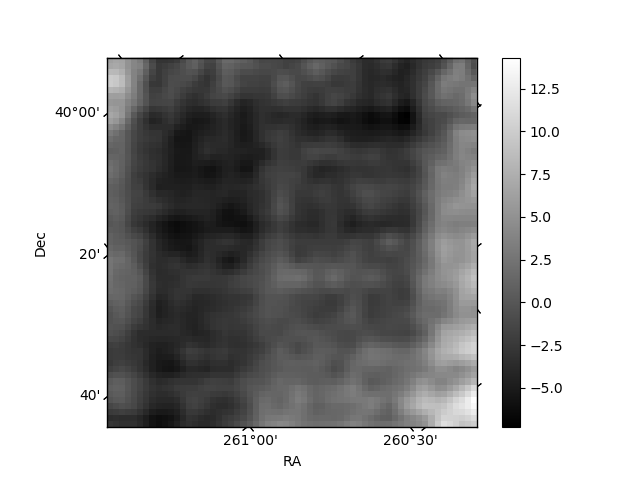
Histogram calculated using DETX and DETY for each event in the final _common_clean file
| Quadrant A | 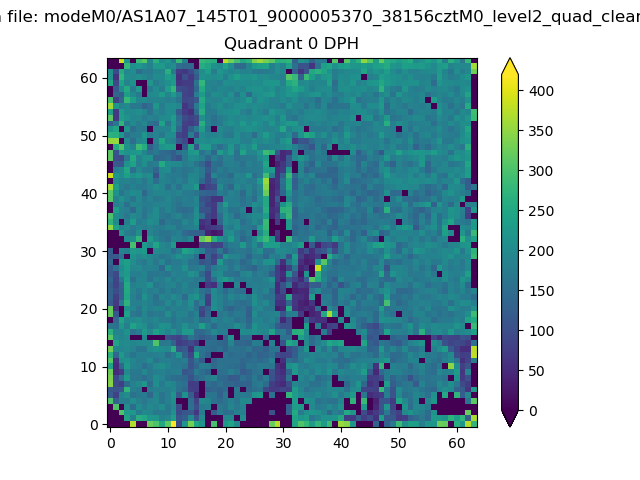 |
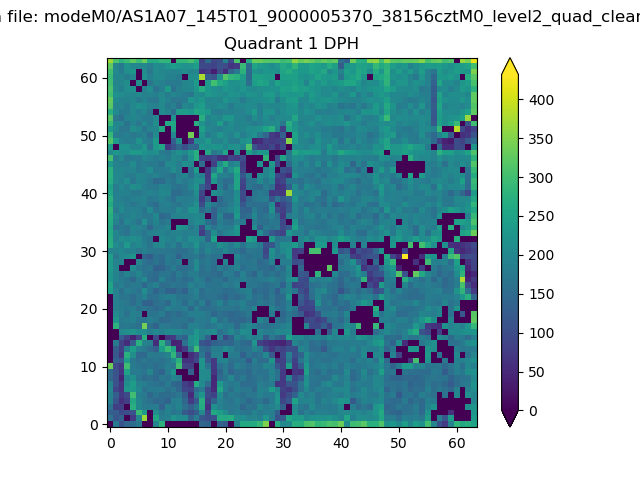 |
Quadrant B |
|---|---|---|---|
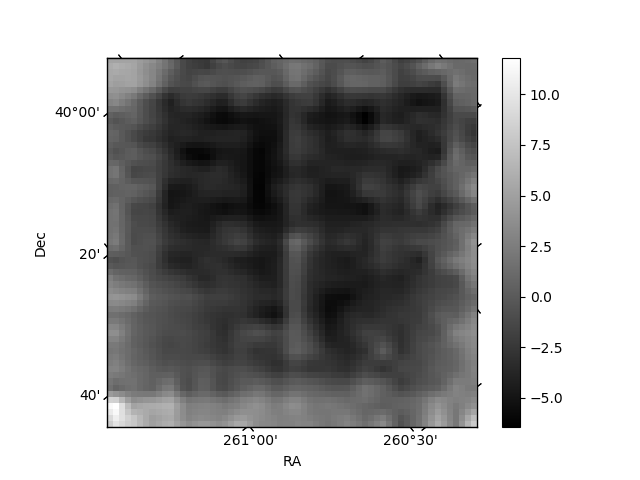
| Quadrant D |  |
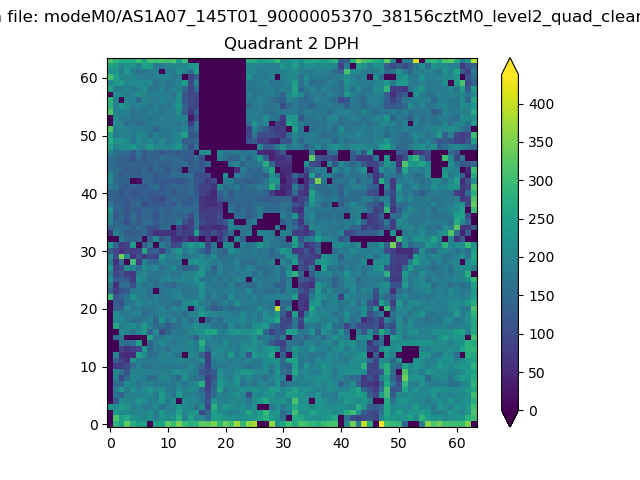 |
Quadrant C |
| Plot type | Count rate plots | Images |
|---|---|---|
| Comparison with Poisson distribution Blue bars denote a histogram of data divided into 1 sec bins. Red curve is a Poisson curve with rate = median count rate of data. |
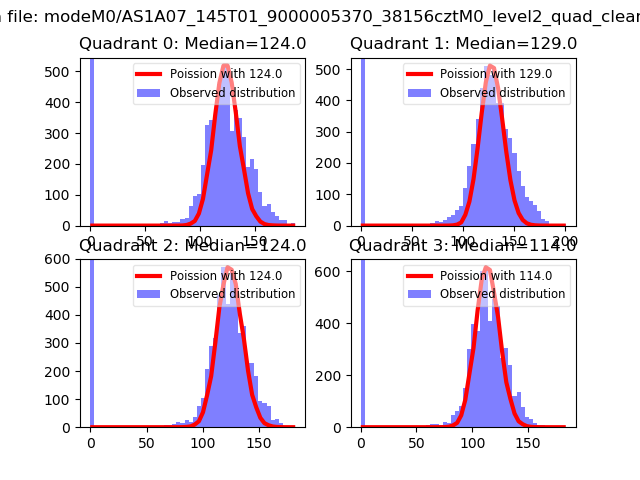 |
 |
| Quadrant-wise count rates Data is divided into 100 sec bins |
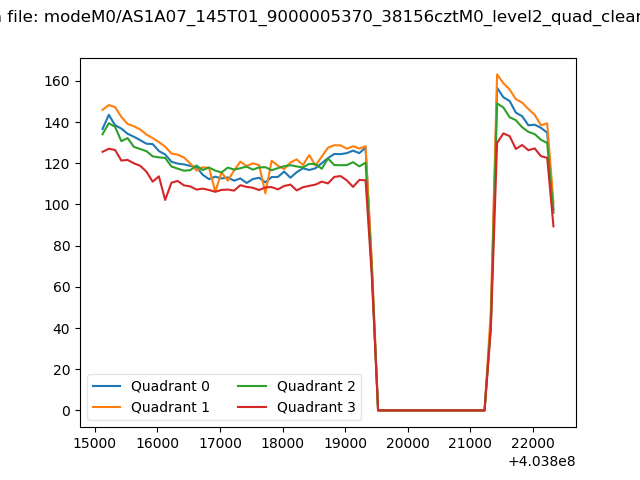 |
|
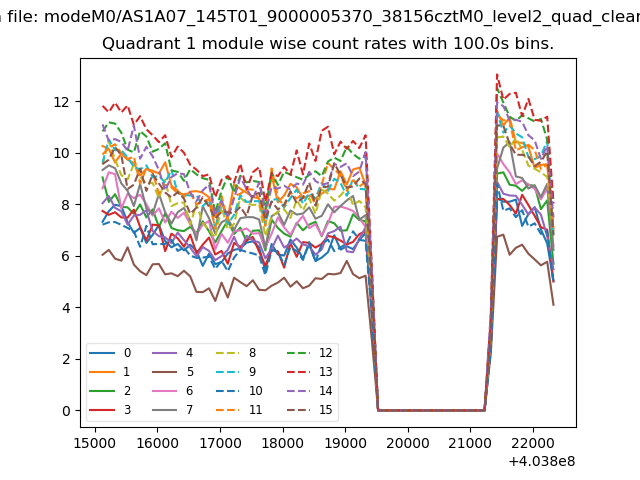
| Module-wise count rates for Quadrant A Data is divided into 100 sec bins |
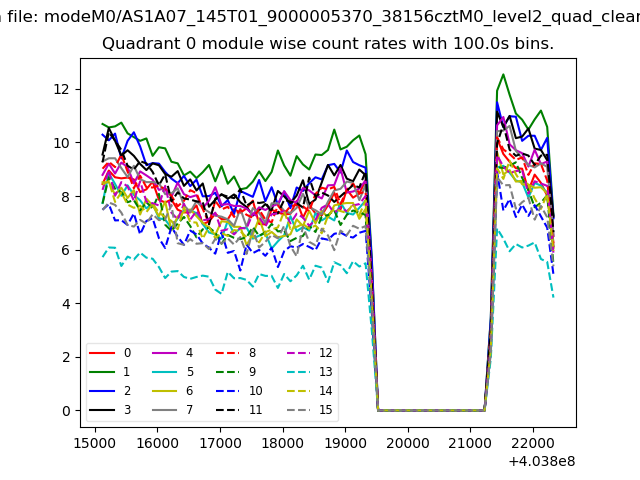 |
 |
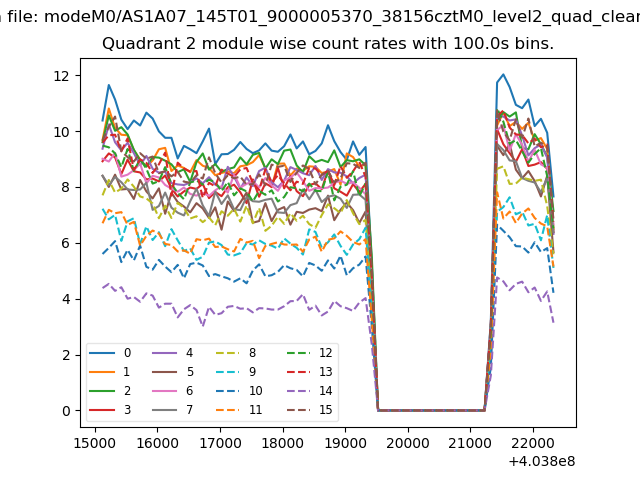
| Module-wise count rates for Quadrant B Data is divided into 100 sec bins |
 |
 |
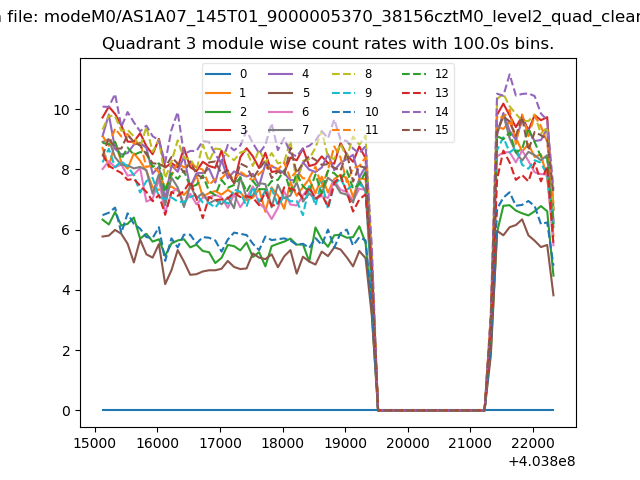
| Module-wise count rates for Quadrant C Data is divided into 100 sec bins |
 |
 |
| Module-wise count rates for Quadrant D Data is divided into 100 sec bins |
 |
 |
| Parameter | Plot |
|---|---|
| CZT HV Monitor | 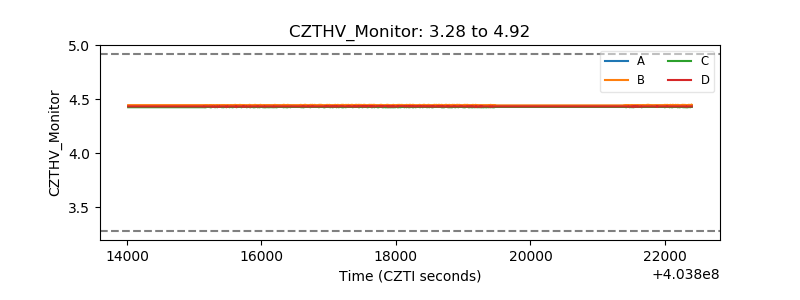 |
| D_VDD | 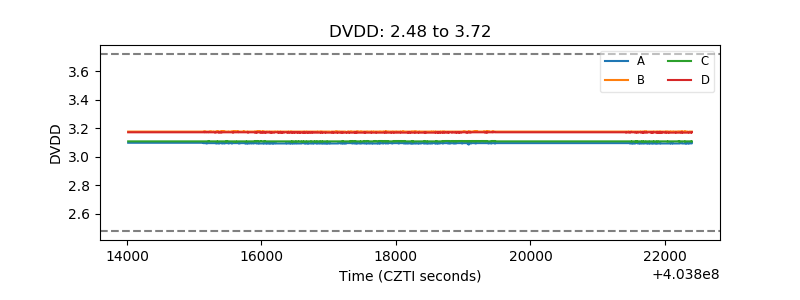 |
| Temperature 1 | 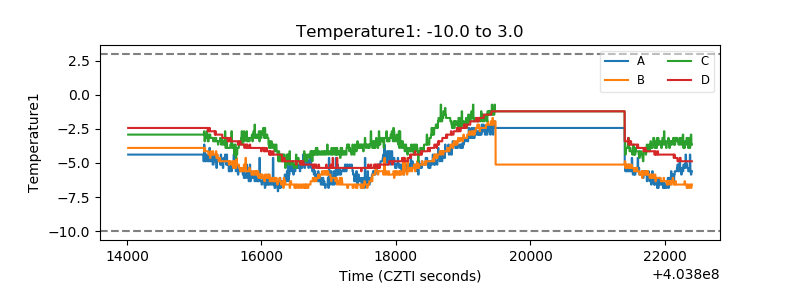 |
| Veto HV Monitor |  |
| Veto LLD | 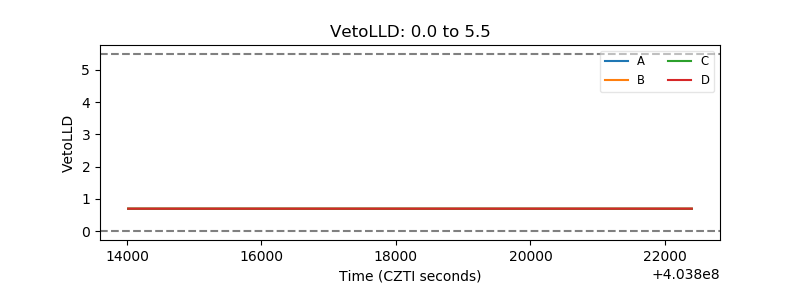 |
| Alpha Counter | 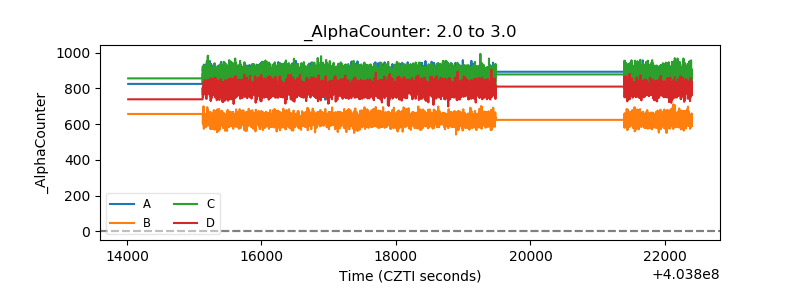 |
| _CPM_Rate | 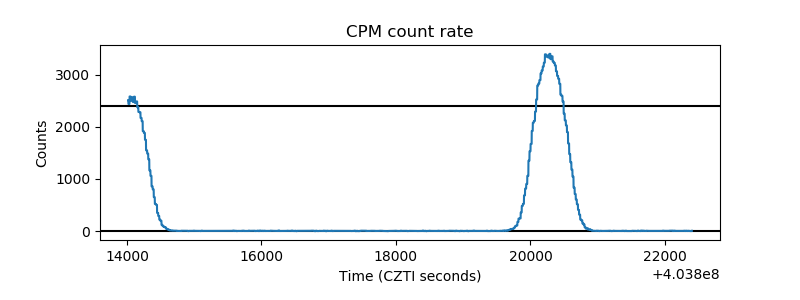 |
| CZT Counter | 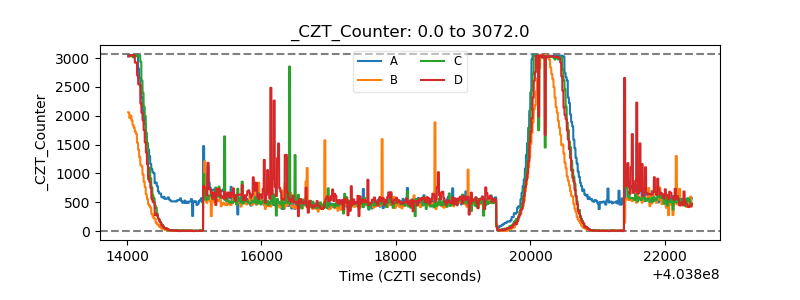 |
| +2.5 Volts monitor | 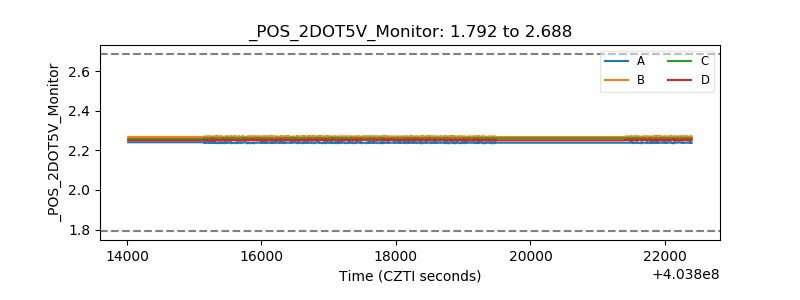 |
| +5 Volts monitor | 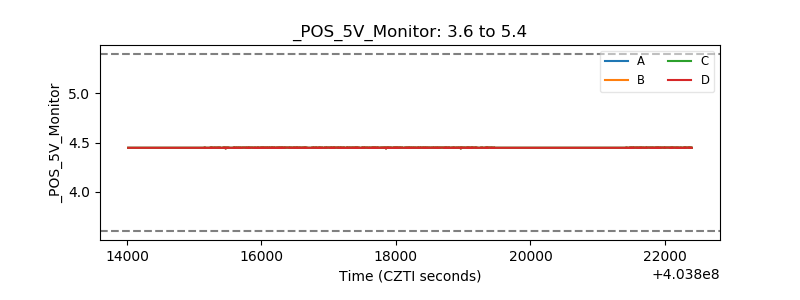 |
| _ROLL_ROT | 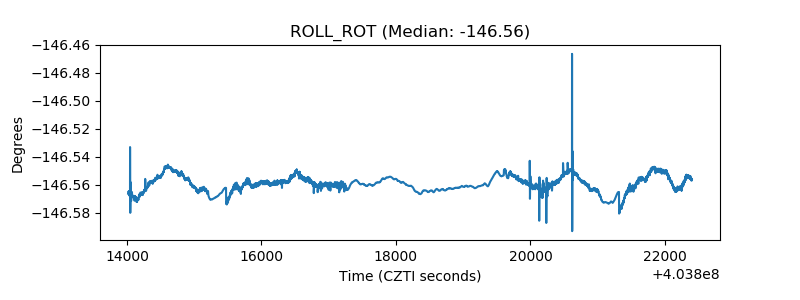 |
| _Roll_DEC | 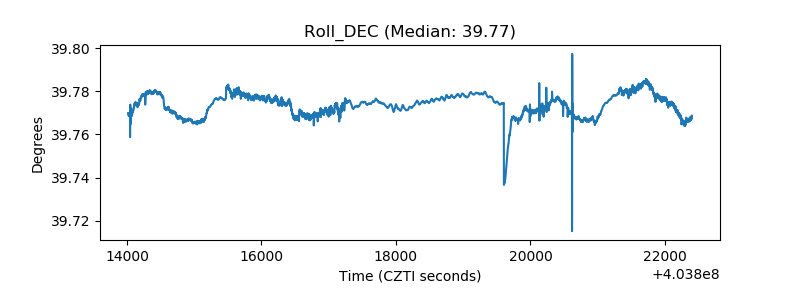 |
| _Roll_RA | 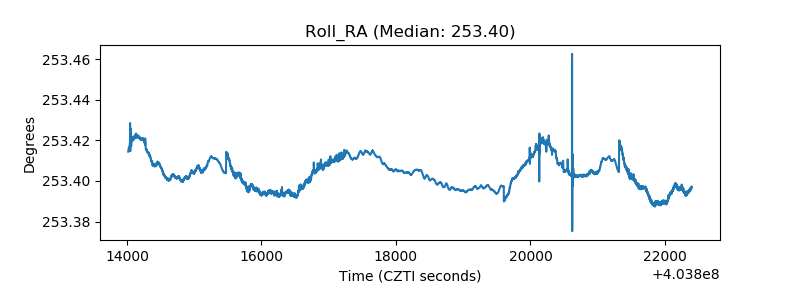 |
| Veto Counter | 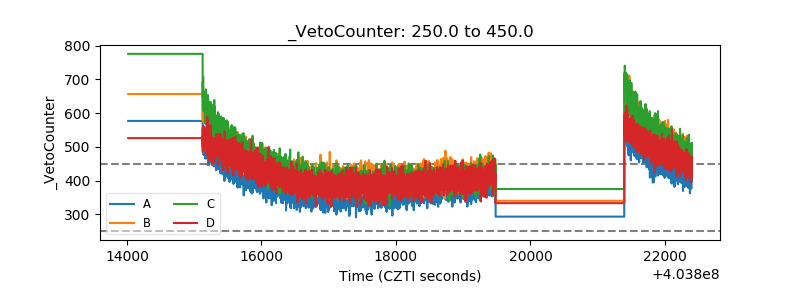 |