| Param | Original file | Final file |
|---|---|---|
| Filename | modeM0/AS1A07_145T01_9000005370_38157cztM0_level2.fits | modeM0/AS1A07_145T01_9000005370_38157cztM0_level2_quad_clean.evt |
| Size (bytes) | 332,233,920 | 101,626,560 |
| Size | 316.8 MB | 96.9 MB |
| Events in quadrant A | 2,909,210 | 689,927 |
| Events in quadrant B | 2,748,397 | 711,845 |
| Events in quadrant C | 2,771,171 | 680,785 |
| Events in quadrant D | 3,459,817 | 626,471 |
| Mode M9 | |||
|---|---|---|---|
| Quadrant | BADHDUFLAG | Total packets | Discarded packets |
| A | 0 | 31 | 0 |
| B | 0 | 31 | 0 |
| C | 0 | 31 | 0 |
| D | 0 | 32 | 0 |
| Mode SS | |||
|---|---|---|---|
| Quadrant | BADHDUFLAG | Total packets | Discarded packets |
| A | 0 | 108 | 0 |
| B | 0 | 108 | 0 |
| C | 0 | 108 | 0 |
| D | 0 | 108 | 0 |
| Mode M0 | |||
|---|---|---|---|
| Quadrant | BADHDUFLAG | Total packets | Discarded packets |
| A | 0 | 11724 | 3 |
| B | 0 | 11340 | 2 |
| C | 0 | 11187 | 2 |
| D | 0 | 13932 | 2 |
| Quadrant | Total seconds | Saturated seconds | Saturation percentage |
|---|---|---|---|
| A | 5263 | 15 | 0.285009% |
| B | 5263 | 46 | 0.874026% |
| C | 5263 | 11 | 0.209006% |
| D | 5263 | 27 | 0.513015% |
Noise dominated data is calculated using 1-second bins in cleaned event files. If a bin has >2000 counts, and if more than 50% of those come from <1% of pixels, then it is considered to be noise-dominated and hence unusable.
| Quadrant | # 1 sec bins | Bins with >0 counts | Bins with >2000 counts | High rate bins dominated by noise | Noise dominated (total time) | Noise dominated (detector-on time) | Marked lightcurve |
|---|---|---|---|---|---|---|---|
| A | 7296 | 5264 | 10 | 10 | 0.14% | 0.19% | 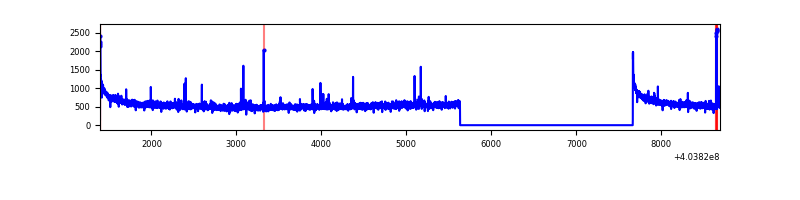 |
| B | 7296 | 5264 | 30 | 30 | 0.41% | 0.57% | 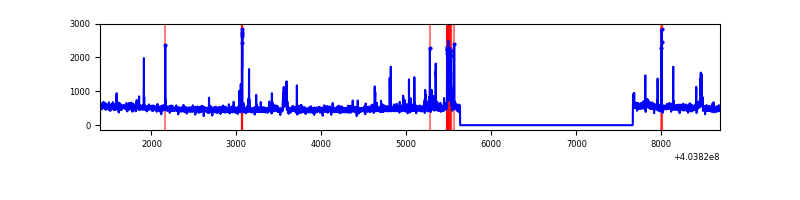 |
| C | 7296 | 5264 | 11 | 11 | 0.15% | 0.21% | 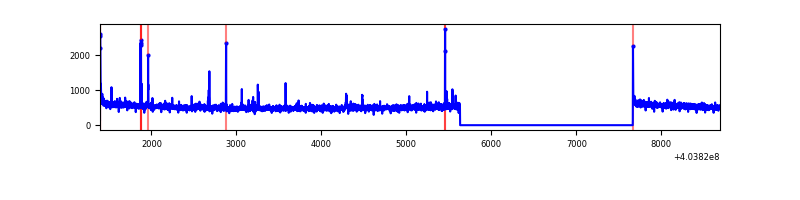 |
| D | 7296 | 5264 | 22 | 22 | 0.30% | 0.42% | 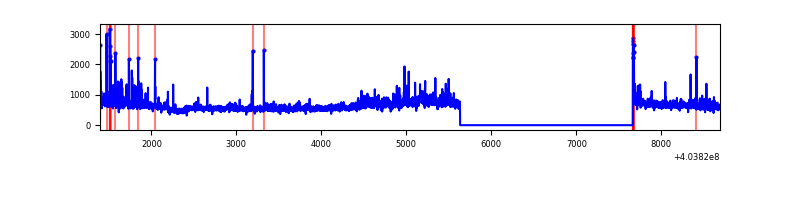 |
Top three noisy pixels from each quadrant. If the there are fewer than three noisy pixels in the level2.evt file, extra rows are filled as -1
| Pixel properties | Quadrant properties | ||||||
|---|---|---|---|---|---|---|---|
| Quadrant | DetID | PixID | Counts | Sigma | Mean | Median | Sigma |
| A | 10 | 83 | 354323 | 2779.49 | 636 | 624 | 127.3 |
| A | 9 | 143 | 30729 | 236.58 | 636 | 624 | 127.3 |
| A | 12 | 189 | 26533 | 203.6 | 636 | 624 | 127.3 |
| B | 4 | 171 | 115432 | 950.47 | 640 | 622 | 120.8 |
| B | 5 | 172 | 87265 | 717.29 | 640 | 622 | 120.8 |
| B | 5 | 184 | 16164 | 128.67 | 640 | 622 | 120.8 |
| C | 15 | 214 | 221049 | 1512.53 | 630 | 636 | 145.7 |
| C | 14 | 254 | 44011 | 297.65 | 630 | 636 | 145.7 |
| C | 0 | 10 | 24912 | 166.59 | 630 | 636 | 145.7 |
| D | 10 | 203 | 482832 | 3226.41 | 622 | 607 | 149.5 |
| D | 12 | 235 | 211659 | 1412.08 | 622 | 607 | 149.5 |
| D | 7 | 223 | 147878 | 985.34 | 622 | 607 | 149.5 |
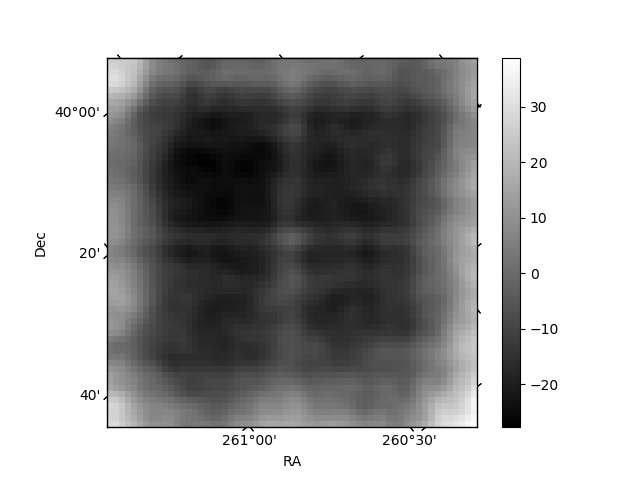
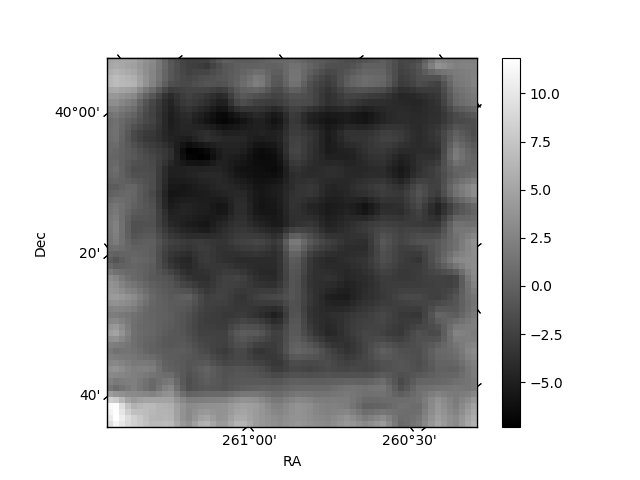
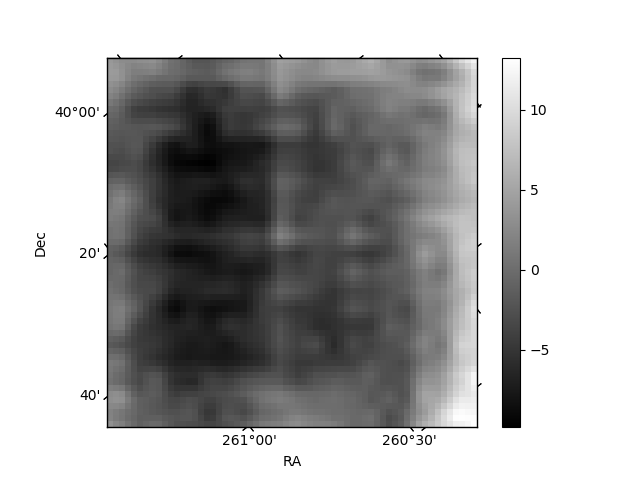
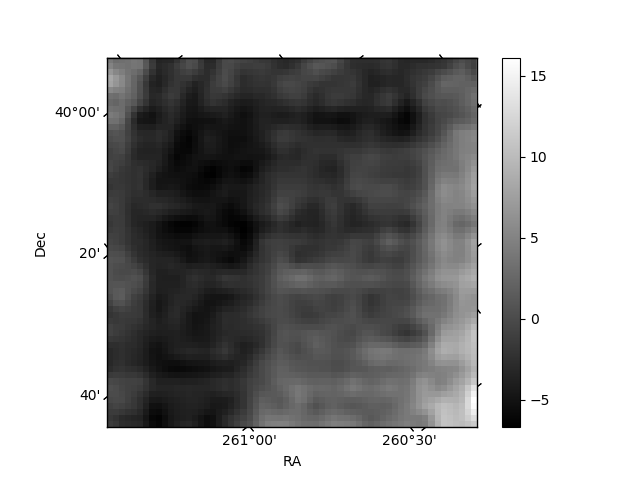
Histogram calculated using DETX and DETY for each event in the final _common_clean file
| Quadrant A | 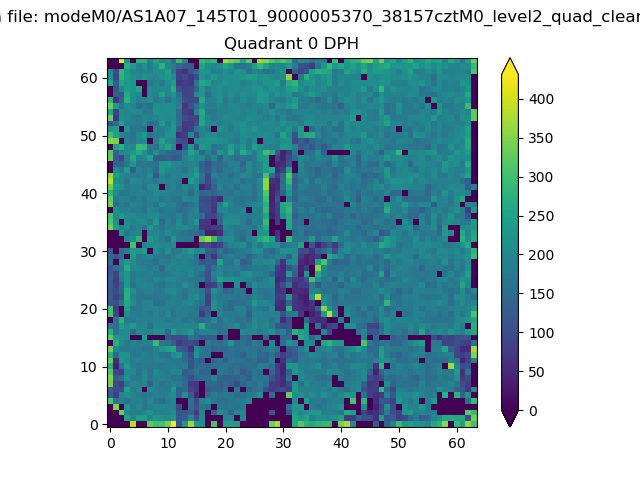 |
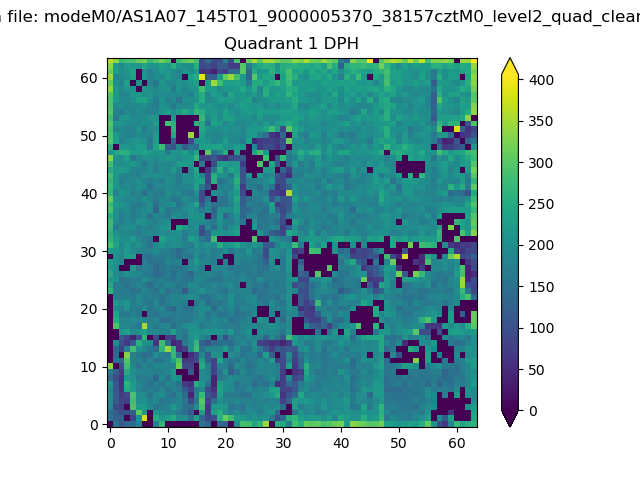 |
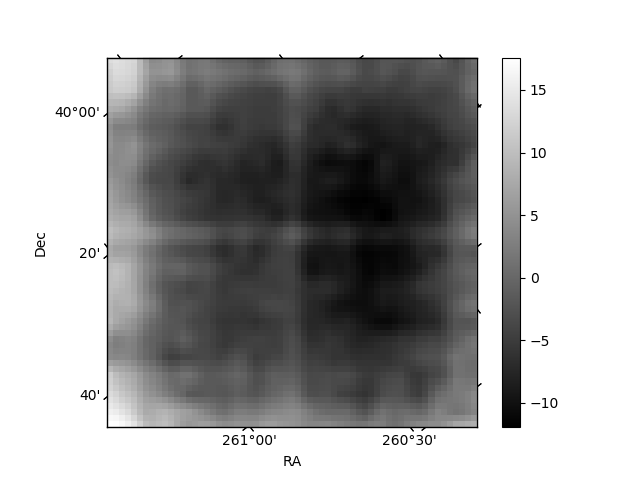
Quadrant B |
|---|---|---|---|
| Quadrant D | 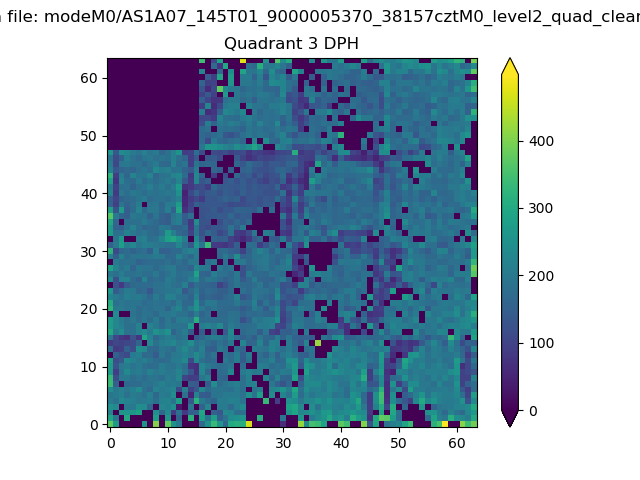 |
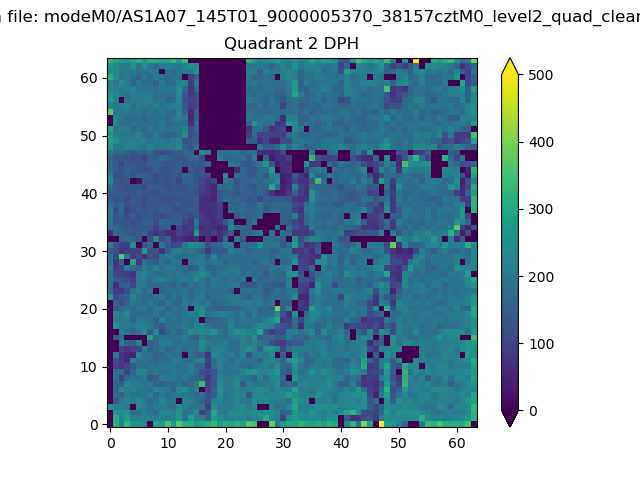 |
Quadrant C |
| Plot type | Count rate plots | Images |
|---|---|---|
| Comparison with Poisson distribution Blue bars denote a histogram of data divided into 1 sec bins. Red curve is a Poisson curve with rate = median count rate of data. |
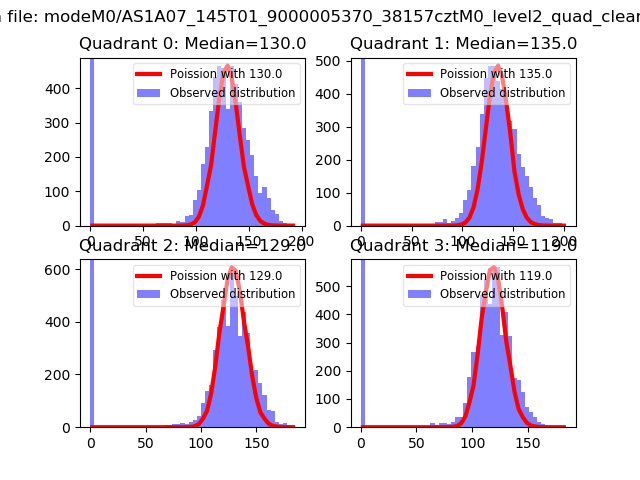 |
 |
| Quadrant-wise count rates Data is divided into 100 sec bins |
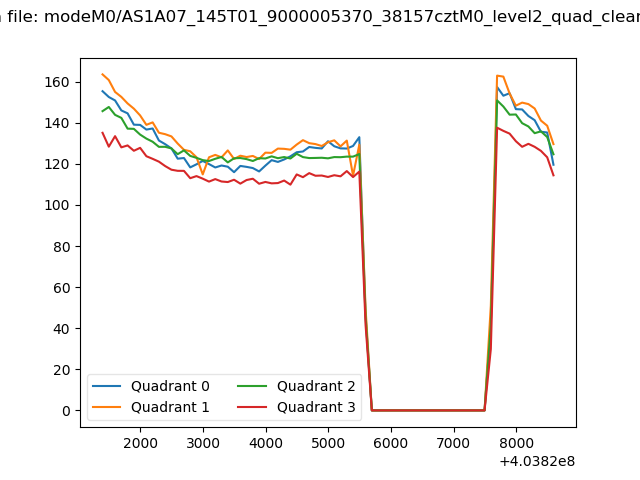 |
|
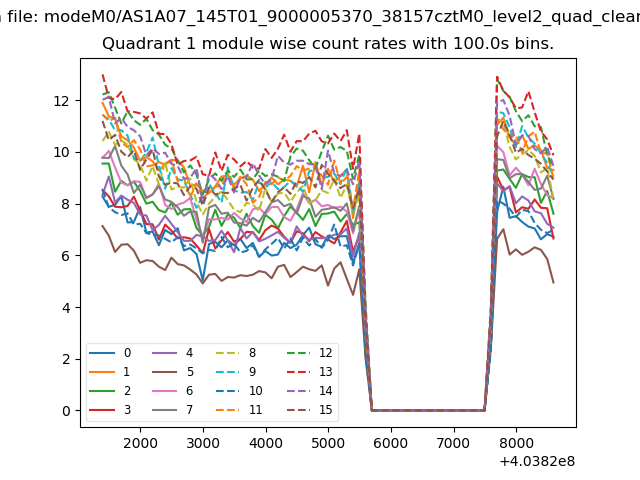
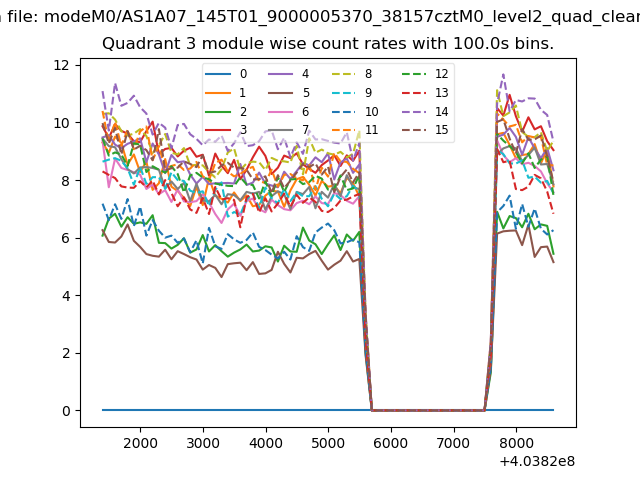
| Module-wise count rates for Quadrant A Data is divided into 100 sec bins |
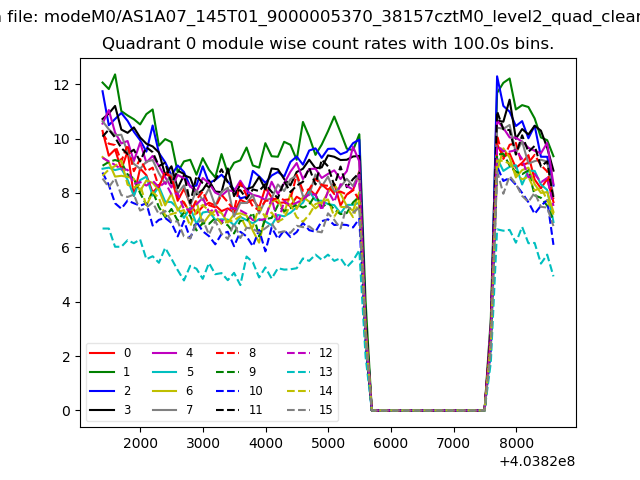 |
 |
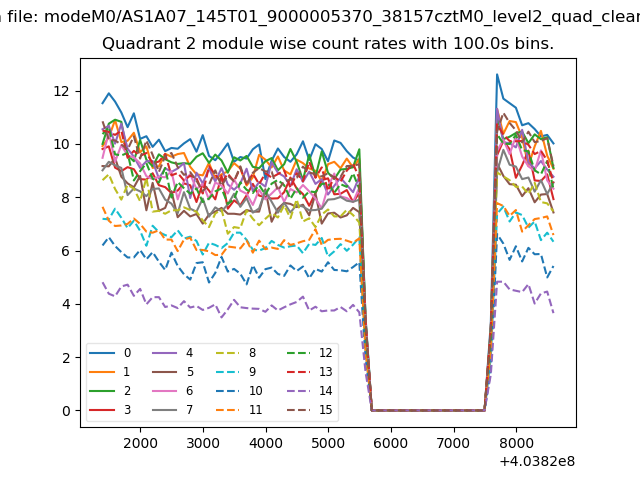
| Module-wise count rates for Quadrant B Data is divided into 100 sec bins |
 |
 |
| Module-wise count rates for Quadrant C Data is divided into 100 sec bins |
 |
 |
| Module-wise count rates for Quadrant D Data is divided into 100 sec bins |
 |
 |
| Parameter | Plot |
|---|---|
| CZT HV Monitor | 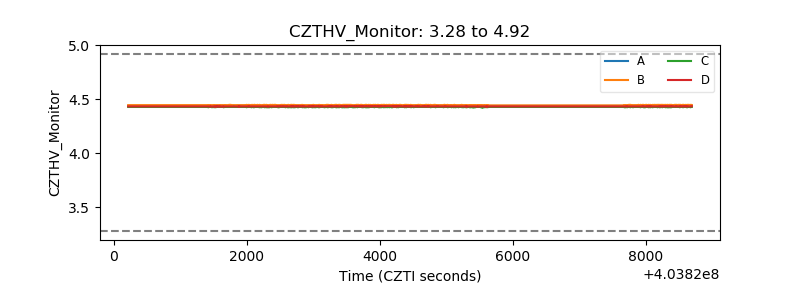 |
| D_VDD | 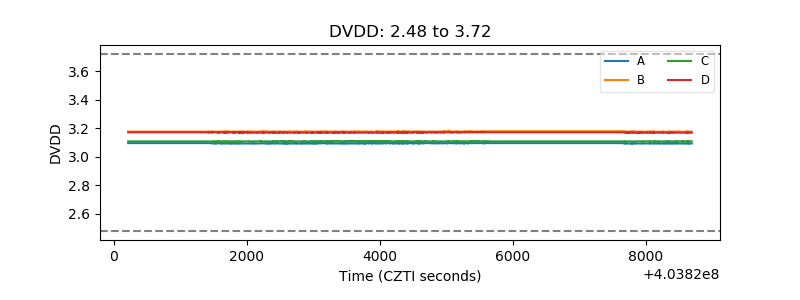 |
| Temperature 1 | 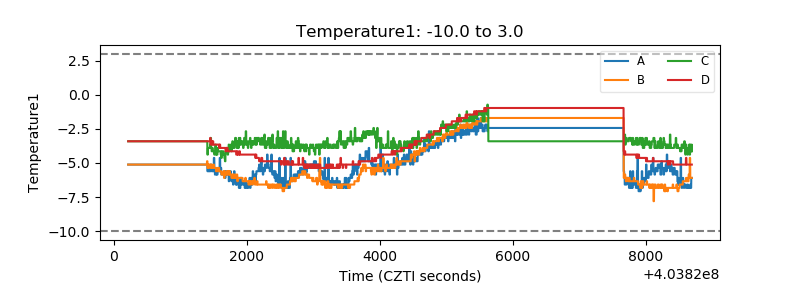 |
| Veto HV Monitor | 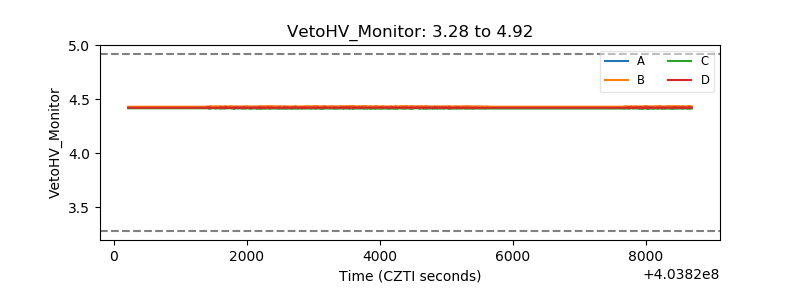 |
| Veto LLD | 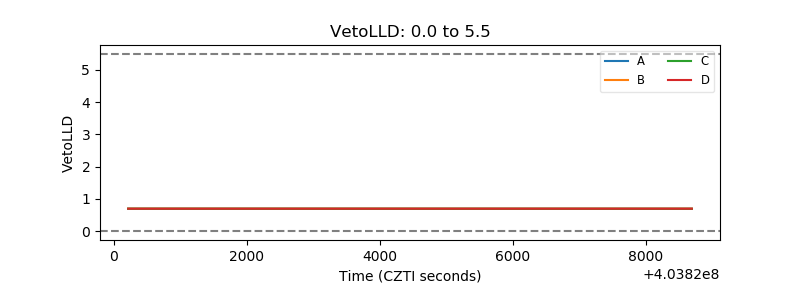 |
| Alpha Counter | 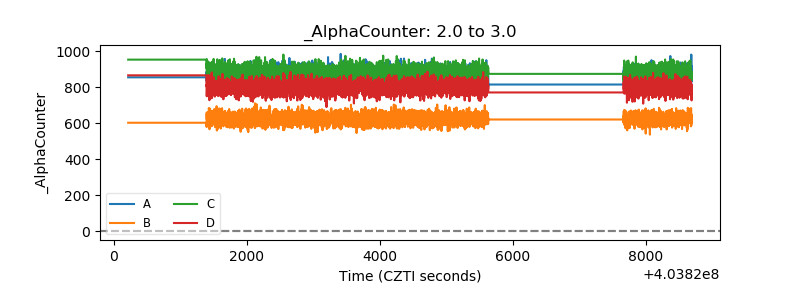 |
| _CPM_Rate | 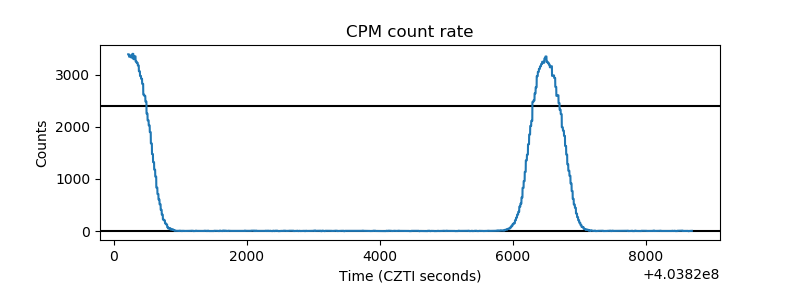 |
| CZT Counter | 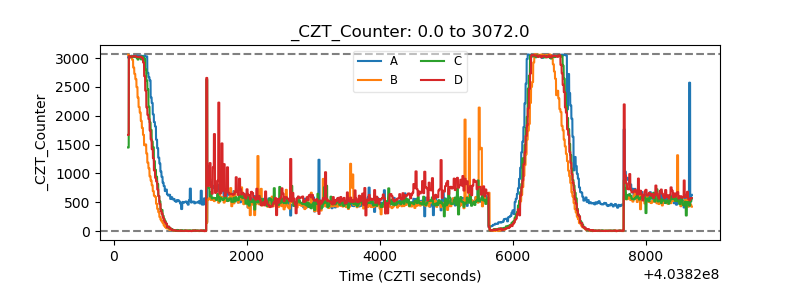 |
| +2.5 Volts monitor | 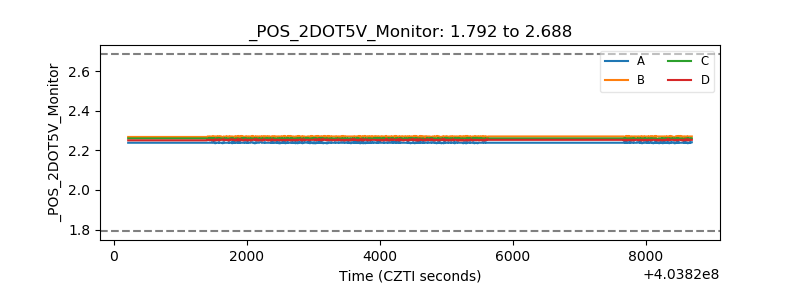 |
| +5 Volts monitor | 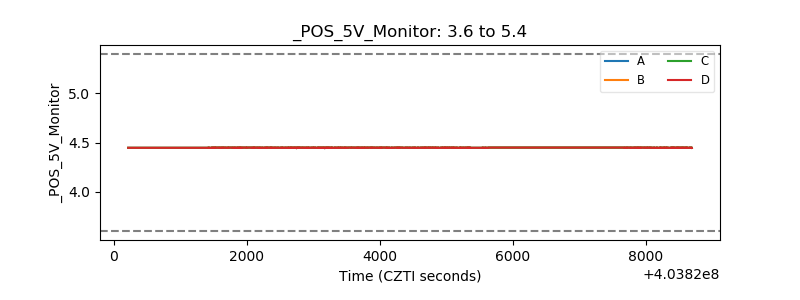 |
| _ROLL_ROT | 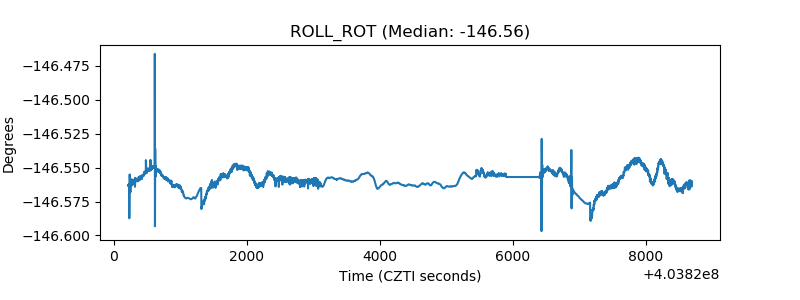 |
| _Roll_DEC | 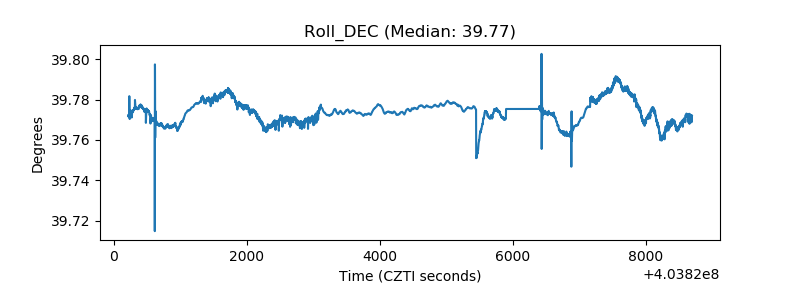 |
| _Roll_RA | 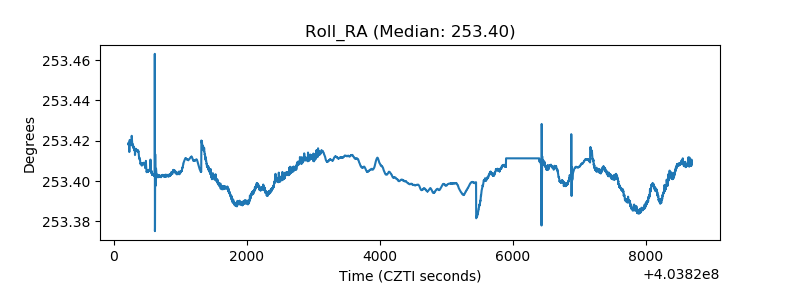 |
| Veto Counter | 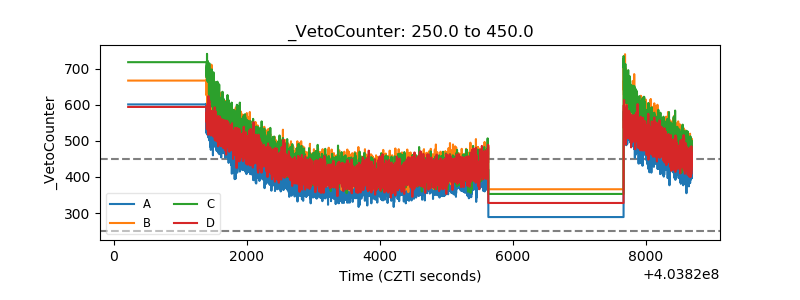 |