| Param | Original file | Final file |
|---|---|---|
| Filename | modeM0/AS1A07_145T01_9000005370_38158cztM0_level2.fits | modeM0/AS1A07_145T01_9000005370_38158cztM0_level2_quad_clean.evt |
| Size (bytes) | 323,372,160 | 100,319,040 |
| Size | 308.4 MB | 95.7 MB |
| Events in quadrant A | 2,944,979 | 680,265 |
| Events in quadrant B | 2,714,559 | 705,574 |
| Events in quadrant C | 2,683,105 | 672,200 |
| Events in quadrant D | 3,225,446 | 618,729 |
| Mode M9 | |||
|---|---|---|---|
| Quadrant | BADHDUFLAG | Total packets | Discarded packets |
| A | 0 | 34 | 0 |
| B | 0 | 34 | 0 |
| C | 0 | 34 | 0 |
| D | 0 | 35 | 0 |
| Mode SS | |||
|---|---|---|---|
| Quadrant | BADHDUFLAG | Total packets | Discarded packets |
| A | 0 | 104 | 0 |
| B | 0 | 104 | 0 |
| C | 0 | 104 | 0 |
| D | 0 | 104 | 0 |
| Mode M0 | |||
|---|---|---|---|
| Quadrant | BADHDUFLAG | Total packets | Discarded packets |
| A | 0 | 11763 | 3 |
| B | 0 | 11166 | 2 |
| C | 0 | 10808 | 2 |
| D | 0 | 13107 | 2 |
| Quadrant | Total seconds | Saturated seconds | Saturation percentage |
|---|---|---|---|
| A | 5163 | 21 | 0.406740% |
| B | 5163 | 41 | 0.794112% |
| C | 5163 | 9 | 0.174317% |
| D | 5163 | 26 | 0.503583% |
Noise dominated data is calculated using 1-second bins in cleaned event files. If a bin has >2000 counts, and if more than 50% of those come from <1% of pixels, then it is considered to be noise-dominated and hence unusable.
| Quadrant | # 1 sec bins | Bins with >0 counts | Bins with >2000 counts | High rate bins dominated by noise | Noise dominated (total time) | Noise dominated (detector-on time) | Marked lightcurve |
|---|---|---|---|---|---|---|---|
| A | 7286 | 5164 | 13 | 13 | 0.18% | 0.25% | 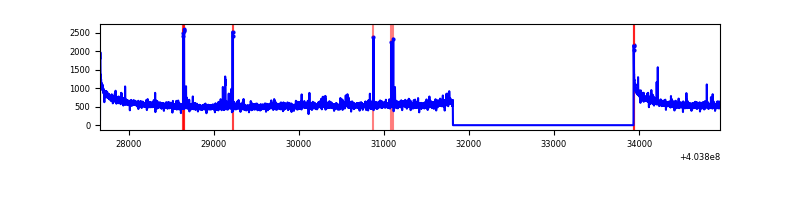 |
| B | 7286 | 5164 | 26 | 26 | 0.36% | 0.50% | 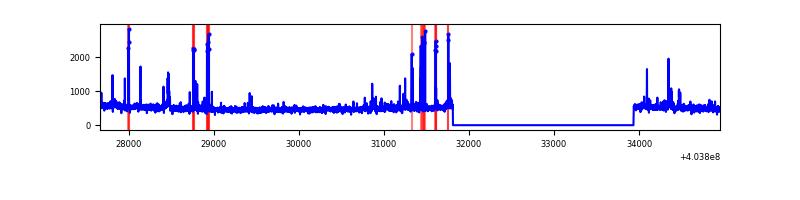 |
| C | 7286 | 5164 | 5 | 5 | 0.07% | 0.10% | 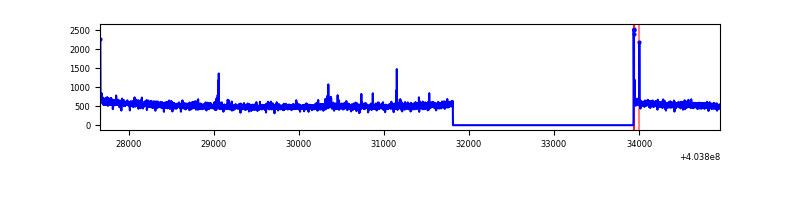 |
| D | 7286 | 5164 | 22 | 22 | 0.30% | 0.43% | 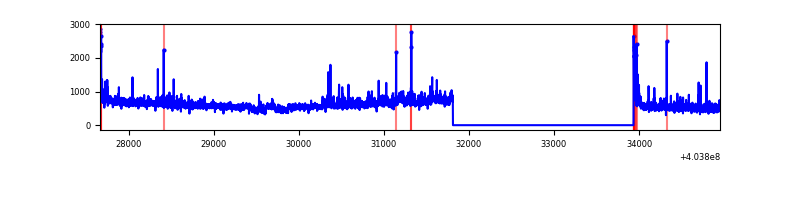 |
Top three noisy pixels from each quadrant. If the there are fewer than three noisy pixels in the level2.evt file, extra rows are filled as -1
| Pixel properties | Quadrant properties | ||||||
|---|---|---|---|---|---|---|---|
| Quadrant | DetID | PixID | Counts | Sigma | Mean | Median | Sigma |
| A | 10 | 83 | 357342 | 2842.41 | 629 | 621 | 125.5 |
| A | 12 | 16 | 49670 | 390.83 | 629 | 621 | 125.5 |
| A | 9 | 143 | 46642 | 366.7 | 629 | 621 | 125.5 |
| B | 4 | 171 | 120231 | 1003.56 | 630 | 615 | 119.2 |
| B | 5 | 172 | 56574 | 469.49 | 630 | 615 | 119.2 |
| B | 15 | 85 | 25065 | 205.13 | 630 | 615 | 119.2 |
| C | 15 | 214 | 217394 | 1531.18 | 617 | 623 | 141.6 |
| C | 2 | 16 | 21724 | 149.05 | 617 | 623 | 141.6 |
| C | 0 | 10 | 21048 | 144.27 | 617 | 623 | 141.6 |
| D | 10 | 203 | 385610 | 2610.98 | 611 | 593 | 147.5 |
| D | 12 | 235 | 158003 | 1067.47 | 611 | 593 | 147.5 |
| D | 7 | 223 | 107091 | 722.21 | 611 | 593 | 147.5 |
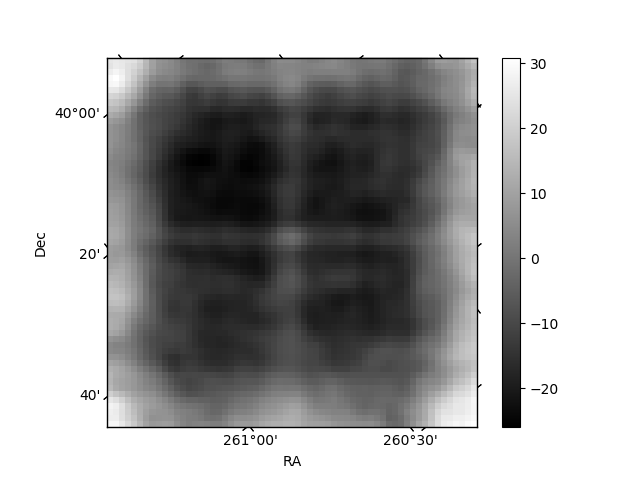
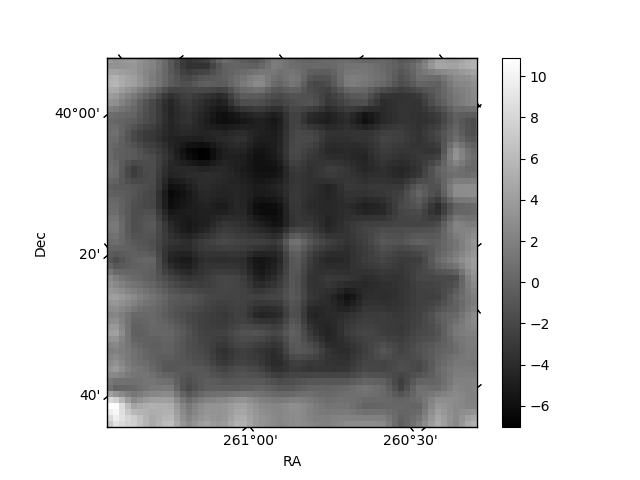
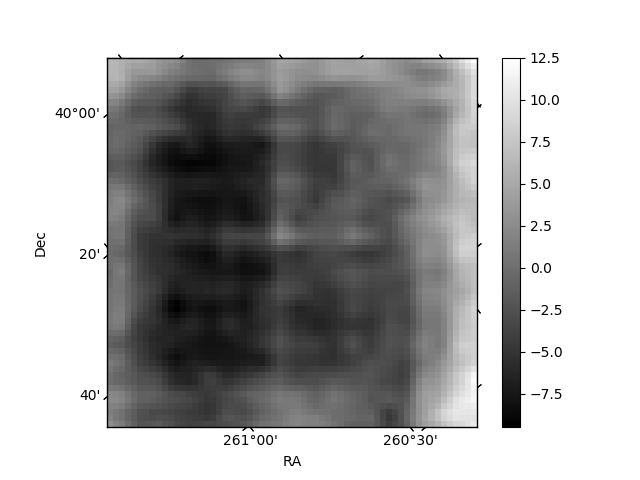
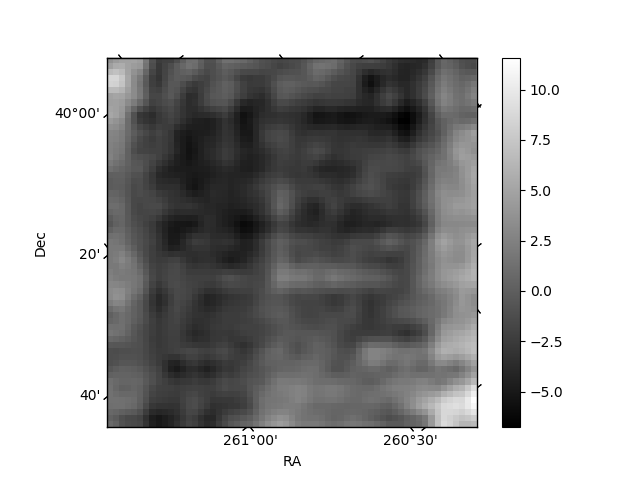
Histogram calculated using DETX and DETY for each event in the final _common_clean file
| Quadrant A | 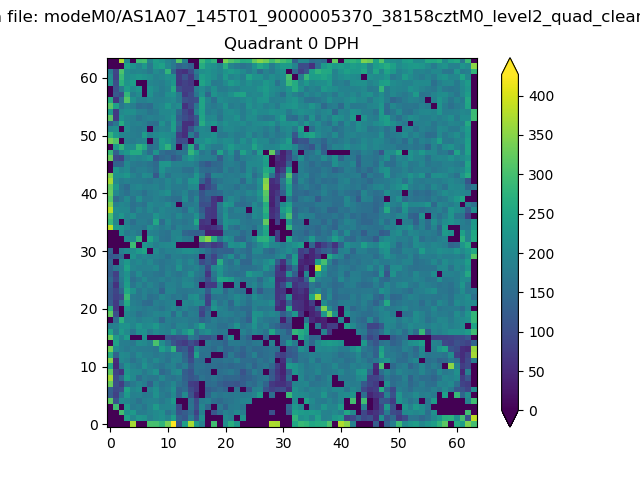 |
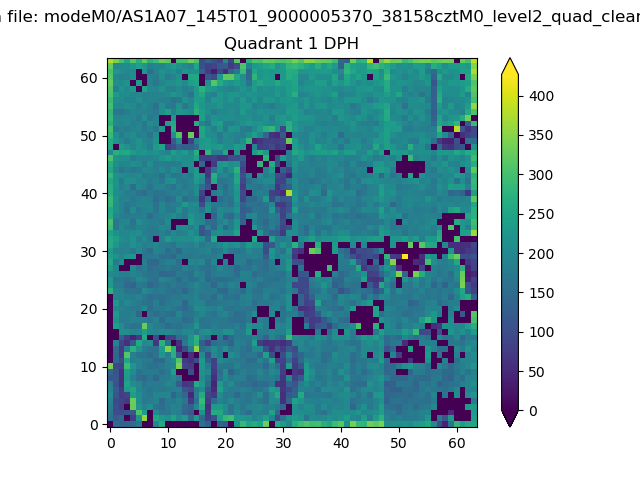 |
Quadrant B |
|---|---|---|---|
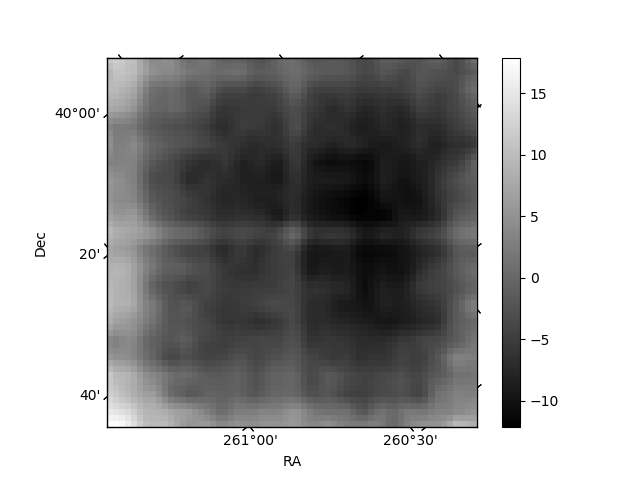
| Quadrant D | 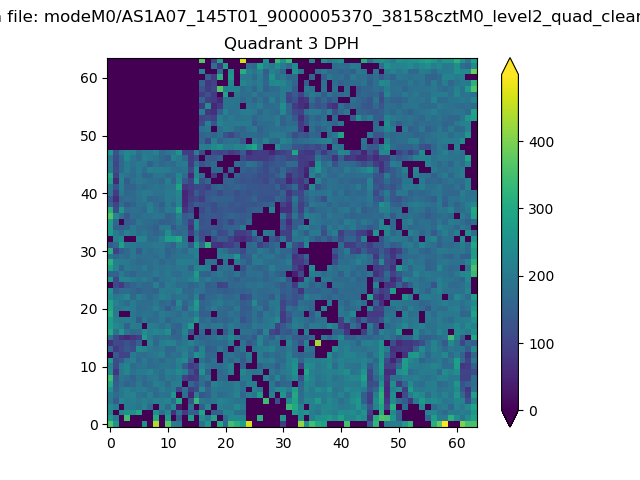 |
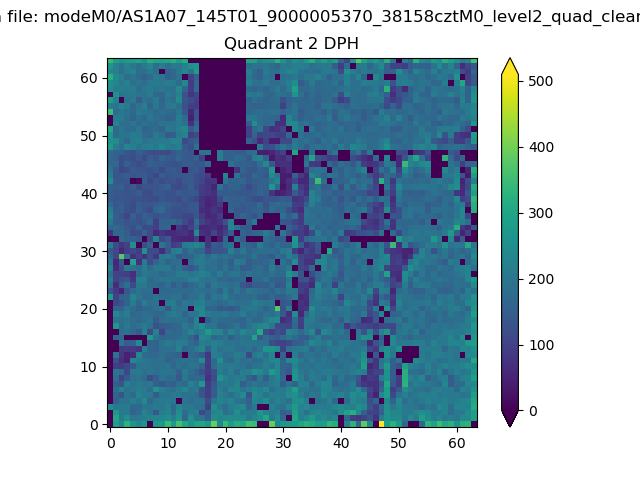 |
Quadrant C |
| Plot type | Count rate plots | Images |
|---|---|---|
| Comparison with Poisson distribution Blue bars denote a histogram of data divided into 1 sec bins. Red curve is a Poisson curve with rate = median count rate of data. |
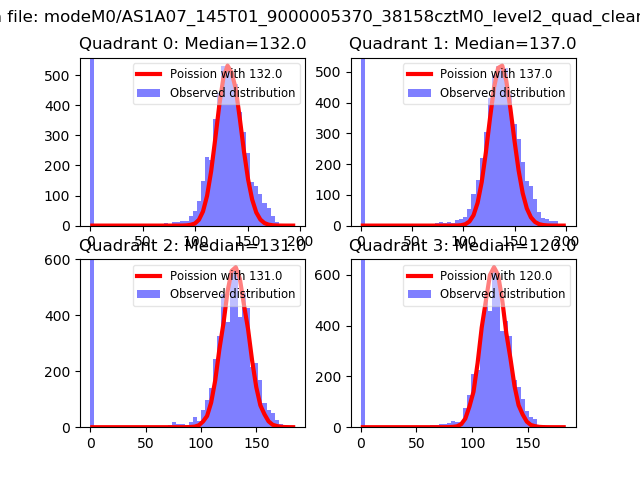 |
 |
| Quadrant-wise count rates Data is divided into 100 sec bins |
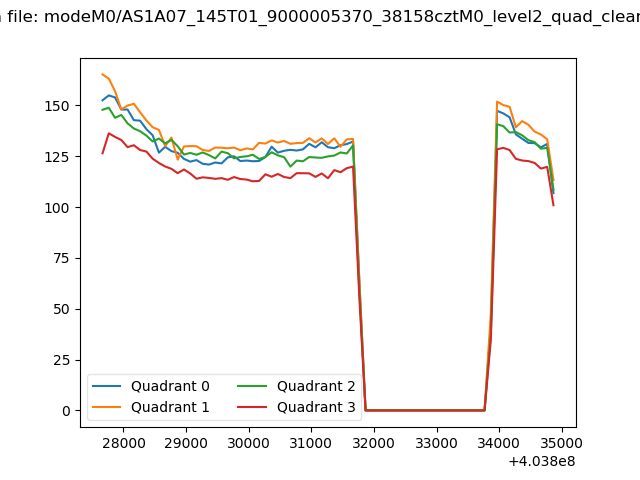 |
|
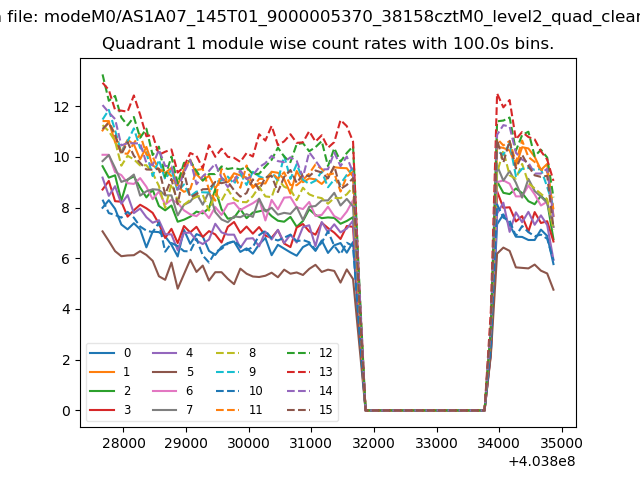
| Module-wise count rates for Quadrant A Data is divided into 100 sec bins |
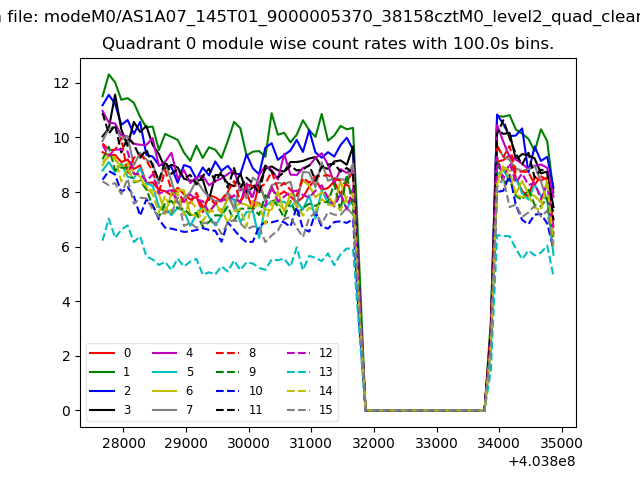 |
 |
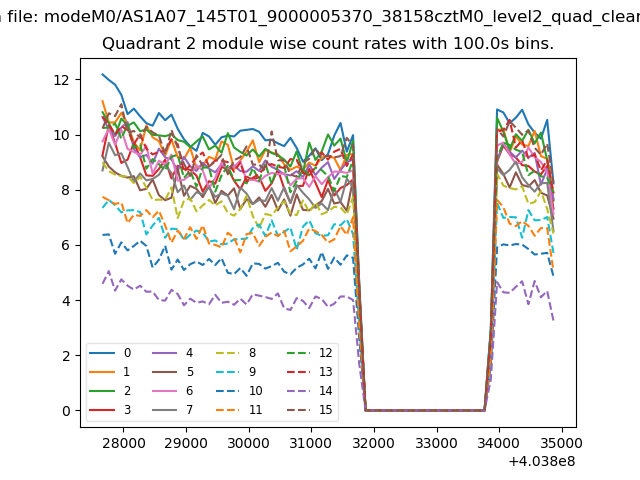
| Module-wise count rates for Quadrant B Data is divided into 100 sec bins |
 |
 |
| Module-wise count rates for Quadrant C Data is divided into 100 sec bins |
 |
 |
| Module-wise count rates for Quadrant D Data is divided into 100 sec bins |
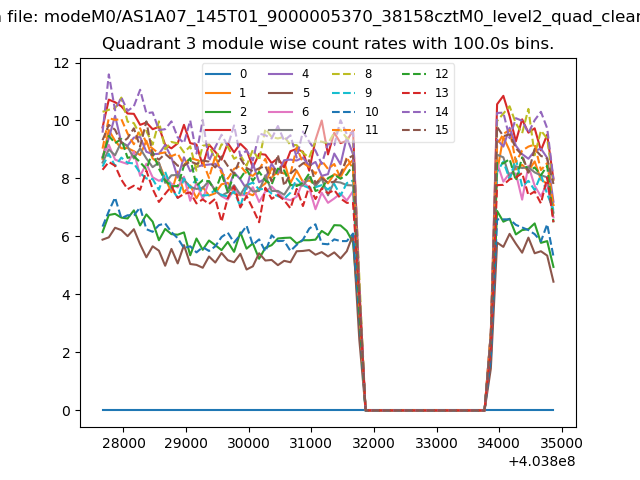 |
 |
| Parameter | Plot |
|---|---|
| CZT HV Monitor | 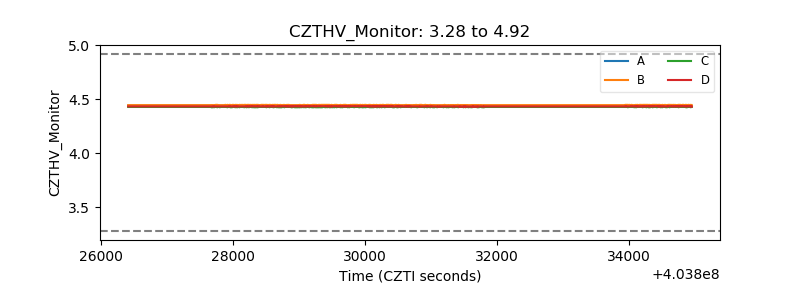 |
| D_VDD | 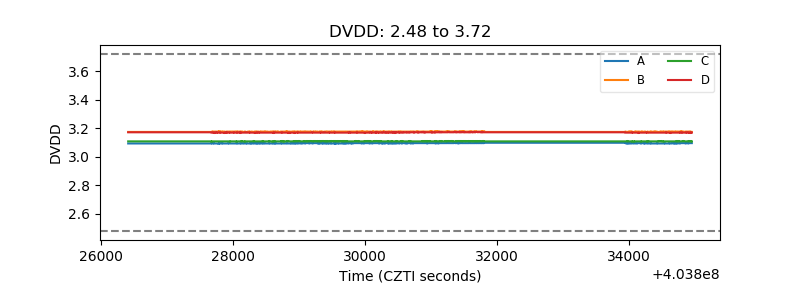 |
| Temperature 1 | 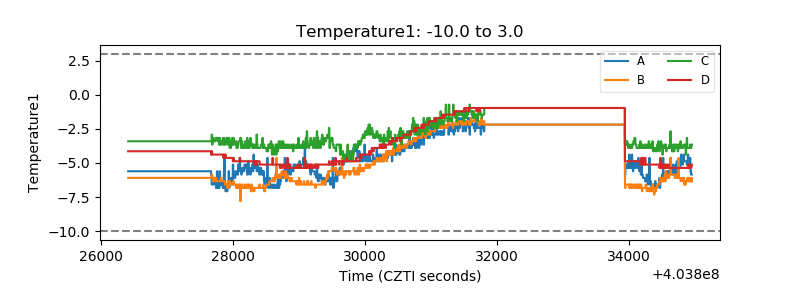 |
| Veto HV Monitor | 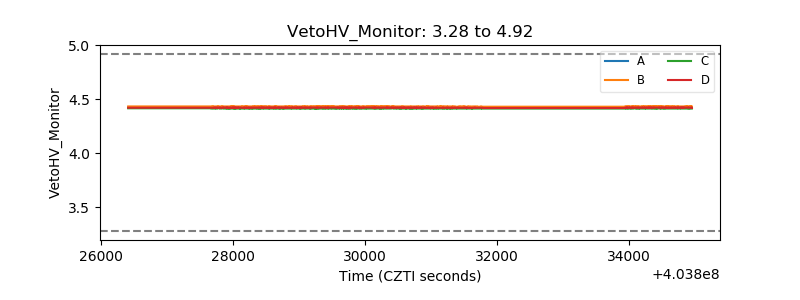 |
| Veto LLD | 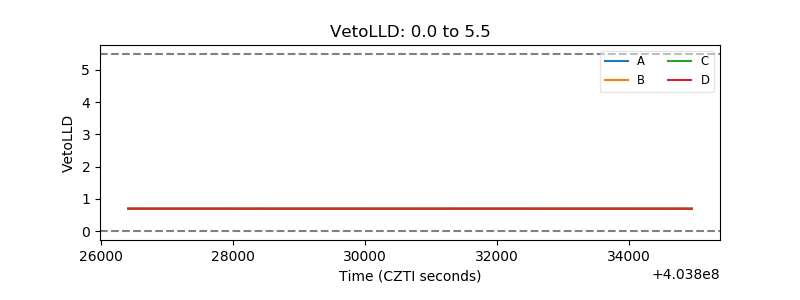 |
| Alpha Counter | 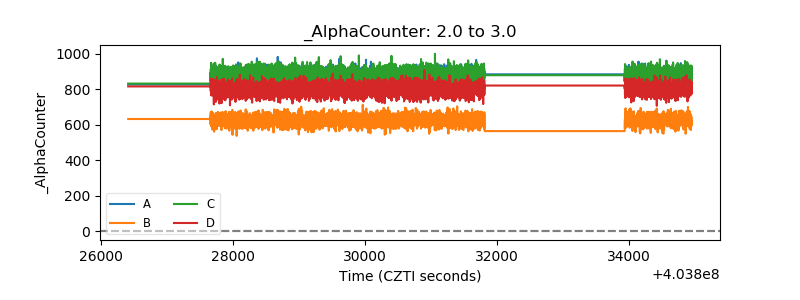 |
| _CPM_Rate | 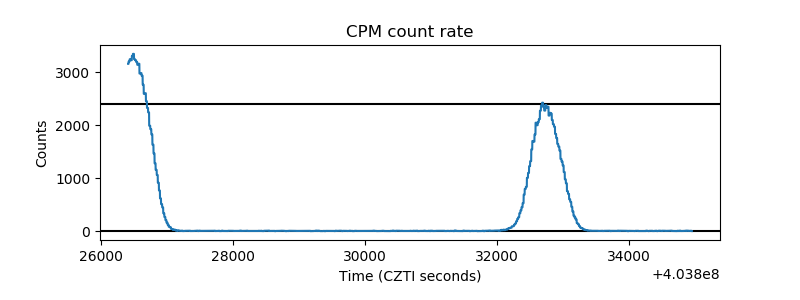 |
| CZT Counter | 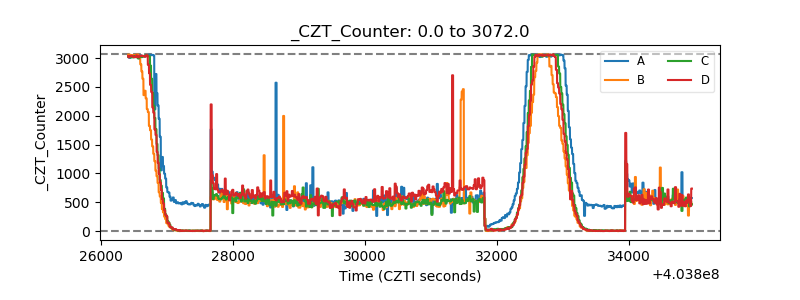 |
| +2.5 Volts monitor | 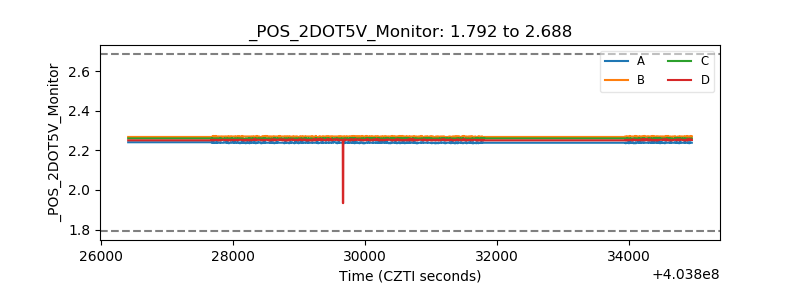 |
| +5 Volts monitor | 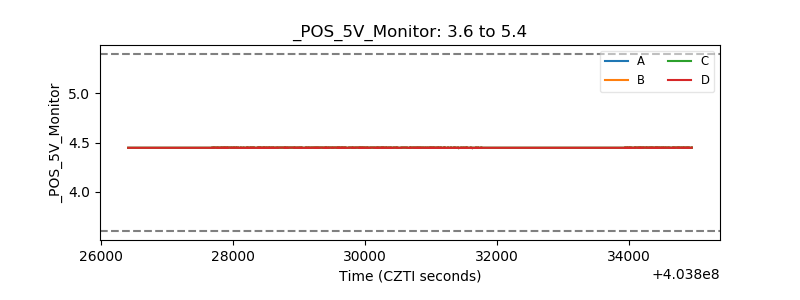 |
| _ROLL_ROT | 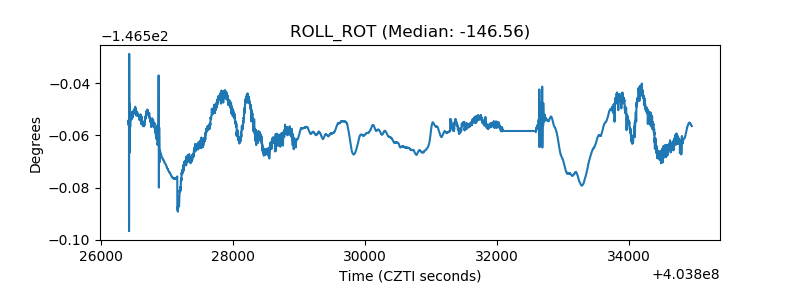 |
| _Roll_DEC | 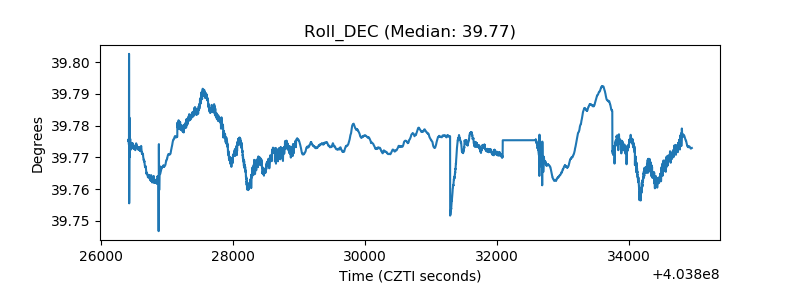 |
| _Roll_RA | 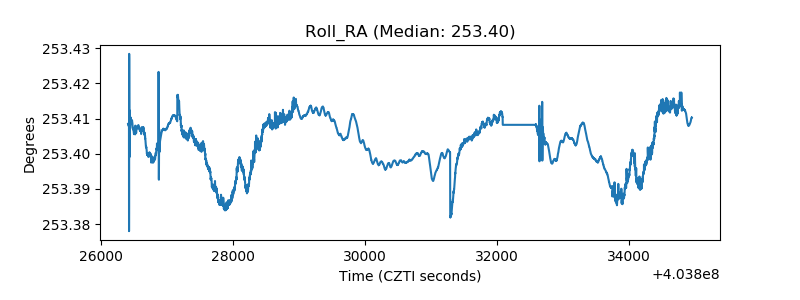 |
| Veto Counter | 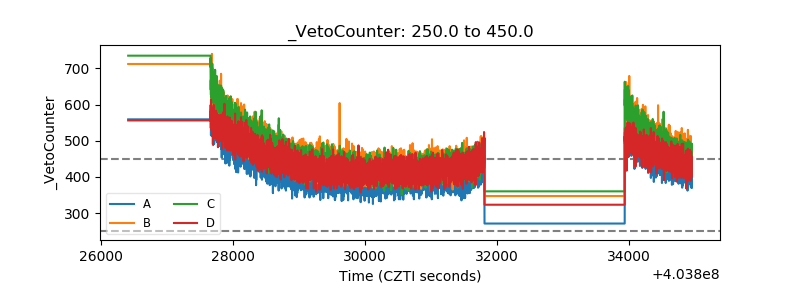 |