| Param | Original file | Final file |
|---|---|---|
| Filename | modeM0/AS1A07_145T01_9000005370_38159cztM0_level2.fits | modeM0/AS1A07_145T01_9000005370_38159cztM0_level2_quad_clean.evt |
| Size (bytes) | 377,660,160 | 90,624,960 |
| Size | 360.2 MB | 86.4 MB |
| Events in quadrant A | 2,783,596 | 643,861 |
| Events in quadrant B | 3,338,624 | 633,590 |
| Events in quadrant C | 2,566,769 | 633,857 |
| Events in quadrant D | 4,896,713 | 478,872 |
| Mode M9 | |||
|---|---|---|---|
| Quadrant | BADHDUFLAG | Total packets | Discarded packets |
| A | 0 | 34 | 0 |
| B | 0 | 34 | 0 |
| C | 0 | 34 | 0 |
| D | 0 | 35 | 0 |
| Mode SS | |||
|---|---|---|---|
| Quadrant | BADHDUFLAG | Total packets | Discarded packets |
| A | 0 | 102 | 0 |
| B | 0 | 102 | 0 |
| C | 0 | 102 | 0 |
| D | 0 | 102 | 0 |
| Mode M0 | |||
|---|---|---|---|
| Quadrant | BADHDUFLAG | Total packets | Discarded packets |
| A | 0 | 11123 | 3 |
| B | 0 | 12981 | 2 |
| C | 0 | 10491 | 2 |
| D | 0 | 17805 | 2 |
| Quadrant | Total seconds | Saturated seconds | Saturation percentage |
|---|---|---|---|
| A | 5058 | 7 | 0.138395% |
| B | 5058 | 281 | 5.555556% |
| C | 5058 | 10 | 0.197707% |
| D | 5058 | 989 | 19.553183% |
Noise dominated data is calculated using 1-second bins in cleaned event files. If a bin has >2000 counts, and if more than 50% of those come from <1% of pixels, then it is considered to be noise-dominated and hence unusable.
| Quadrant | # 1 sec bins | Bins with >0 counts | Bins with >2000 counts | High rate bins dominated by noise | Noise dominated (total time) | Noise dominated (detector-on time) | Marked lightcurve |
|---|---|---|---|---|---|---|---|
| A | 7181 | 5059 | 5 | 5 | 0.07% | 0.10% | 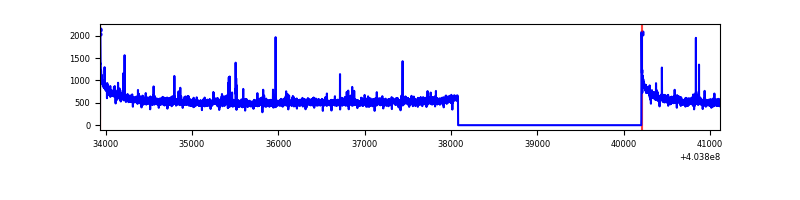 |
| B | 7181 | 5058 | 262 | 262 | 3.65% | 5.18% | 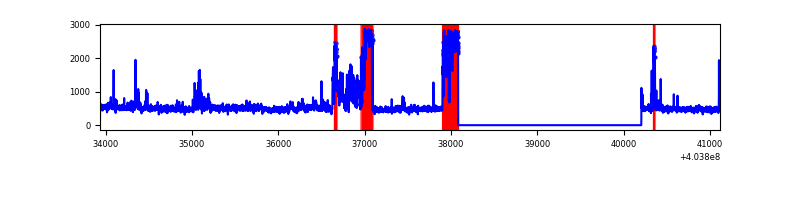 |
| C | 7181 | 5059 | 7 | 7 | 0.10% | 0.14% | 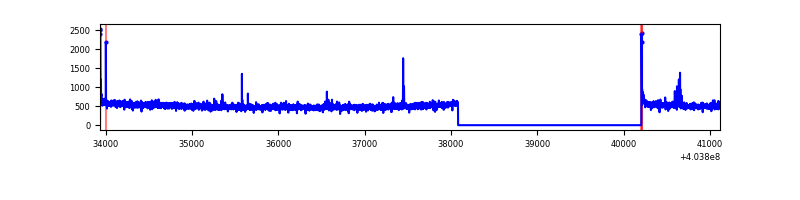 |
| D | 7181 | 5058 | 1006 | 1006 | 14.01% | 19.89% | 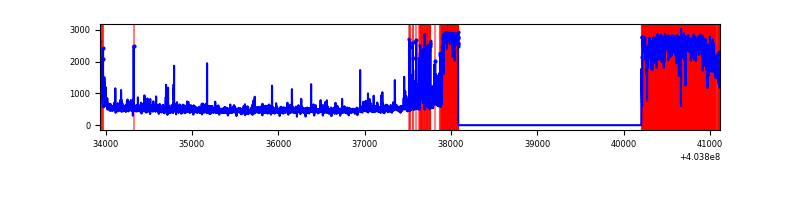 |
Top three noisy pixels from each quadrant. If the there are fewer than three noisy pixels in the level2.evt file, extra rows are filled as -1
| Pixel properties | Quadrant properties | ||||||
|---|---|---|---|---|---|---|---|
| Quadrant | DetID | PixID | Counts | Sigma | Mean | Median | Sigma |
| A | 10 | 83 | 355212 | 2915.28 | 605 | 595 | 121.6 |
| A | 13 | 6 | 20771 | 165.87 | 605 | 595 | 121.6 |
| A | 10 | 248 | 20326 | 162.21 | 605 | 595 | 121.6 |
| B | 5 | 184 | 962226 | 8683.12 | 582 | 569 | 110.8 |
| B | 4 | 171 | 36740 | 326.6 | 582 | 569 | 110.8 |
| B | 5 | 172 | 36291 | 322.55 | 582 | 569 | 110.8 |
| C | 15 | 214 | 211079 | 1549.31 | 588 | 593 | 135.9 |
| C | 0 | 10 | 27265 | 196.32 | 588 | 593 | 135.9 |
| C | 14 | 254 | 22982 | 164.8 | 588 | 593 | 135.9 |
| D | 10 | 203 | 2358042 | 18240.11 | 533 | 519 | 129.2 |
| D | 12 | 233 | 142686 | 1099.94 | 533 | 519 | 129.2 |
| D | 13 | 249 | 97916 | 753.56 | 533 | 519 | 129.2 |
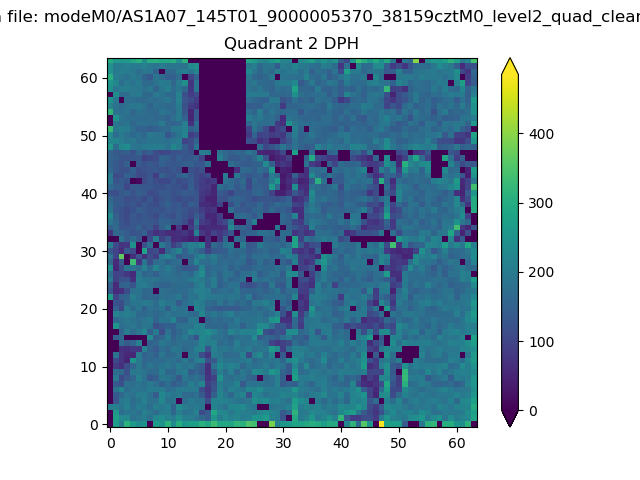
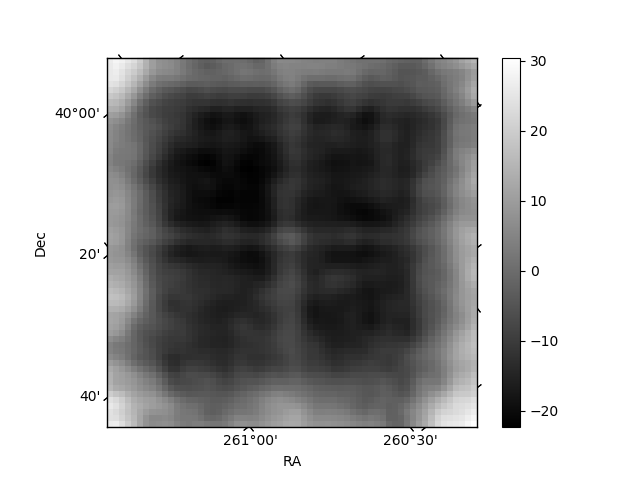
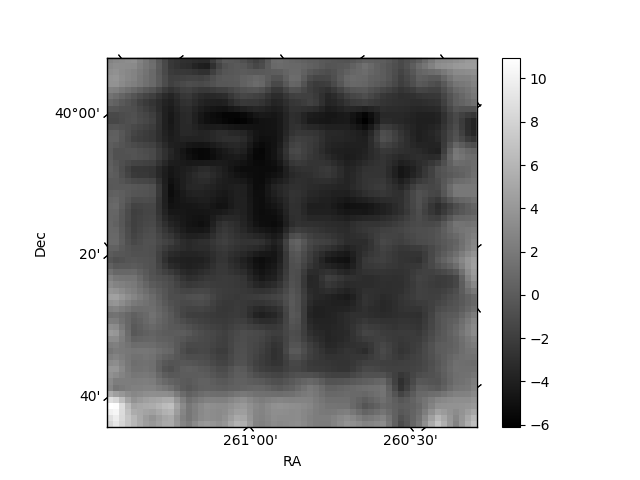
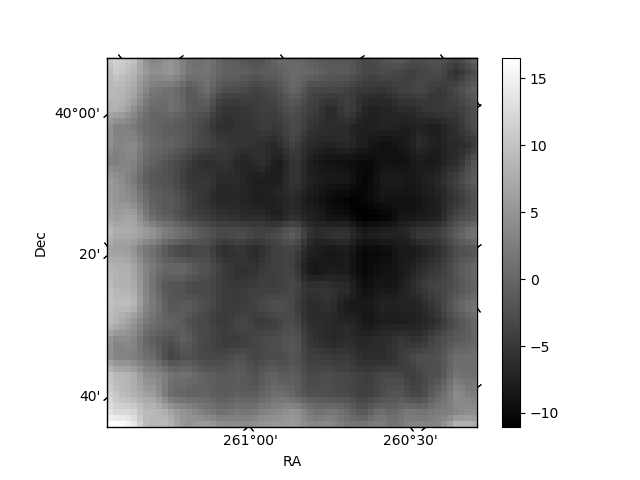
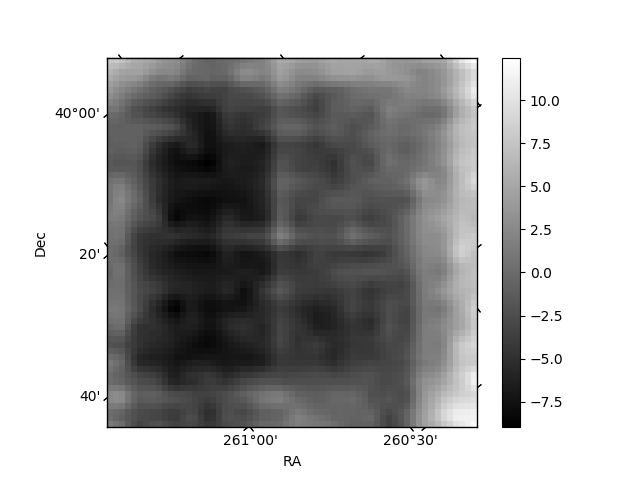
Histogram calculated using DETX and DETY for each event in the final _common_clean file
| Quadrant A | 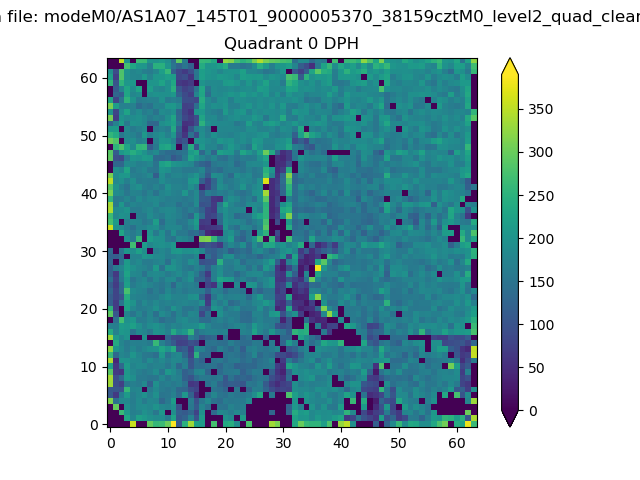 |
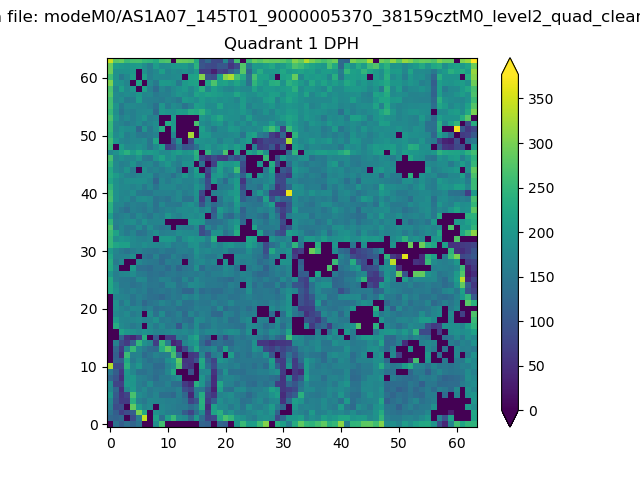 |
Quadrant B |
|---|---|---|---|
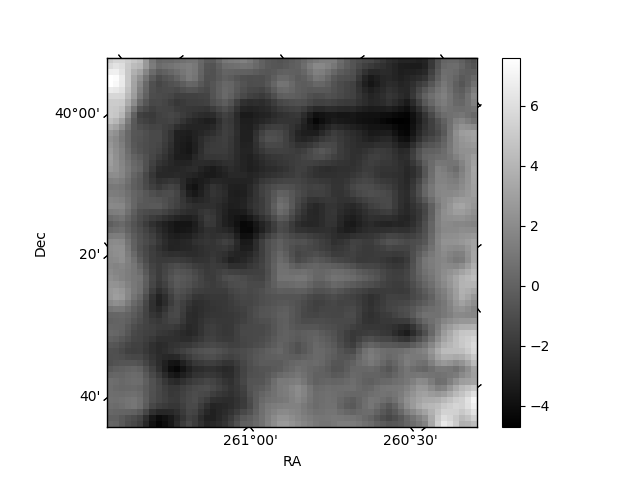
| Quadrant D | 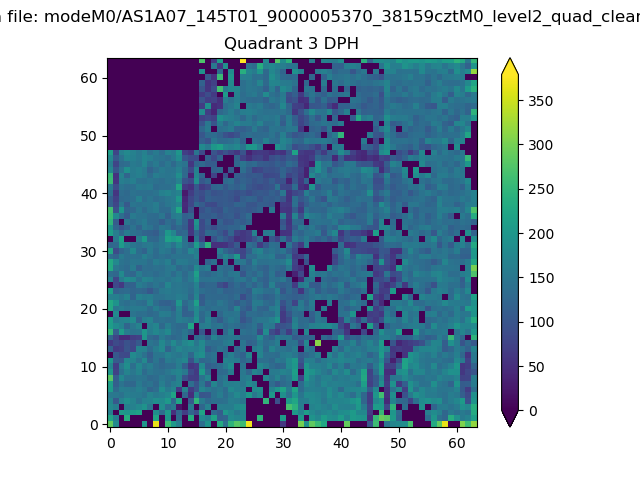 |
 |
Quadrant C |
| Plot type | Count rate plots | Images |
|---|---|---|
| Comparison with Poisson distribution Blue bars denote a histogram of data divided into 1 sec bins. Red curve is a Poisson curve with rate = median count rate of data. |
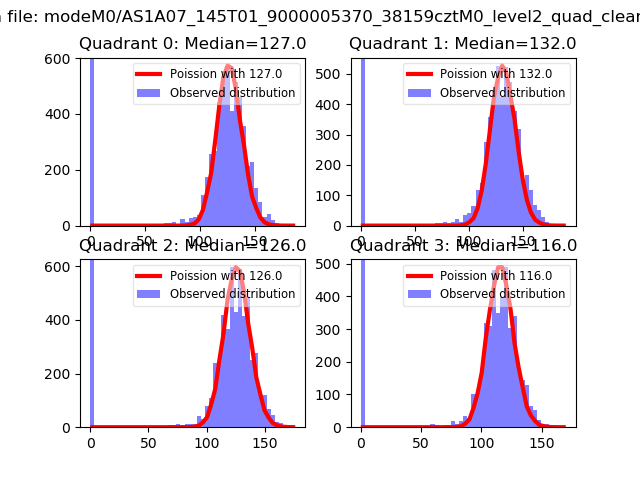 |
 |
| Quadrant-wise count rates Data is divided into 100 sec bins |
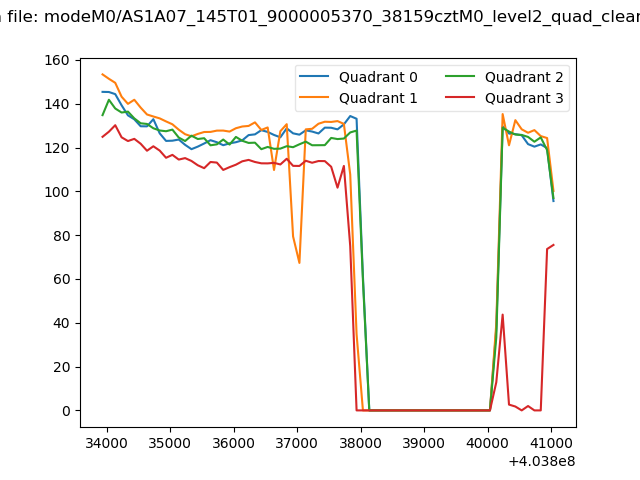 |
|
| Module-wise count rates for Quadrant A Data is divided into 100 sec bins |
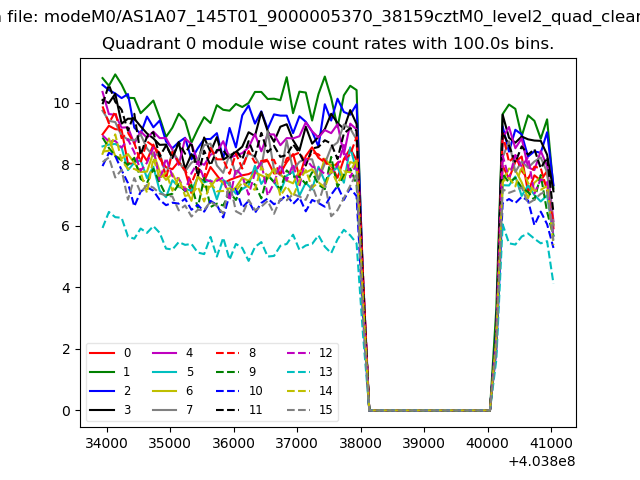 |
 |
| Module-wise count rates for Quadrant B Data is divided into 100 sec bins |
 |
 |
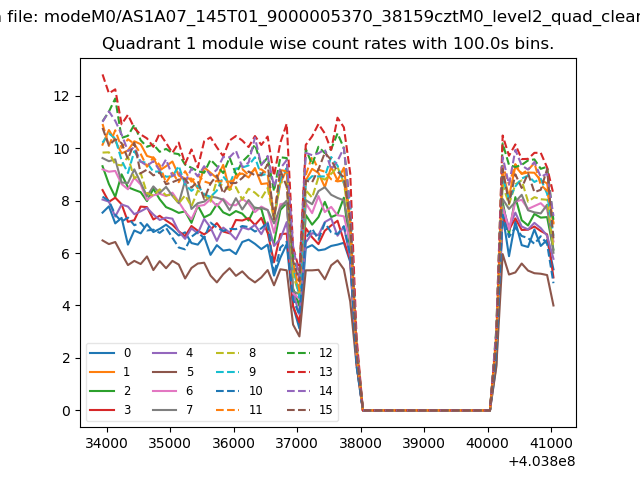
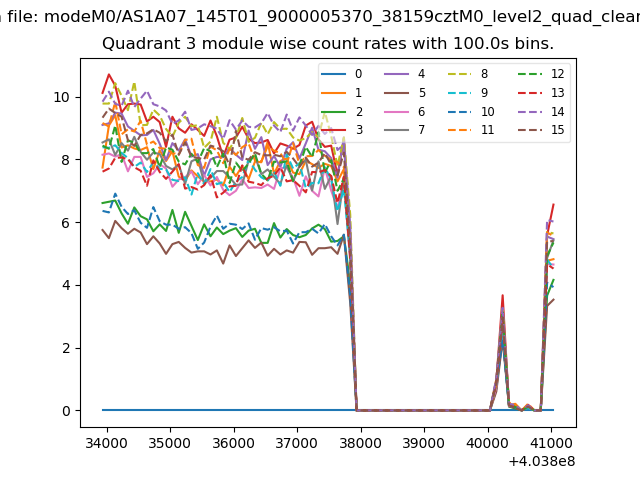
| Module-wise count rates for Quadrant C Data is divided into 100 sec bins |
 |
 |
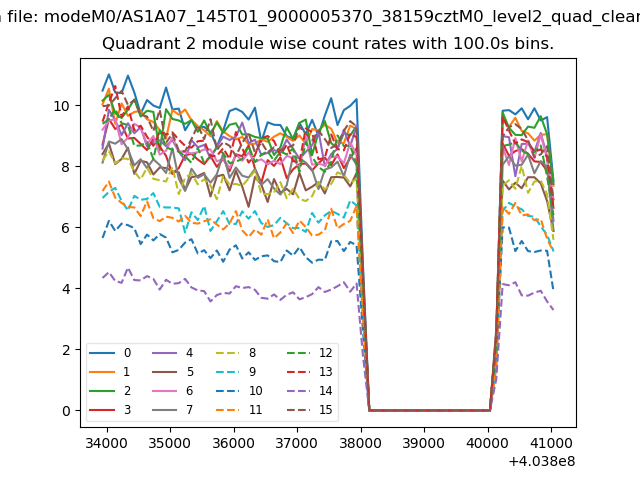
| Module-wise count rates for Quadrant D Data is divided into 100 sec bins |
 |
 |
| Parameter | Plot |
|---|---|
| CZT HV Monitor | 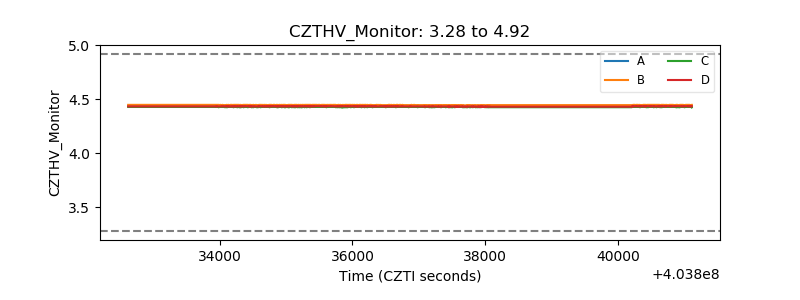 |
| D_VDD | 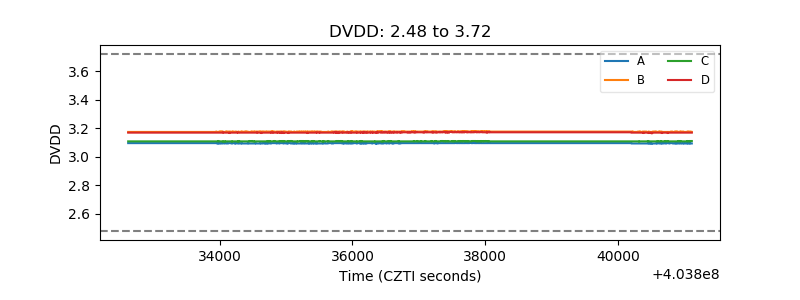 |
| Temperature 1 | 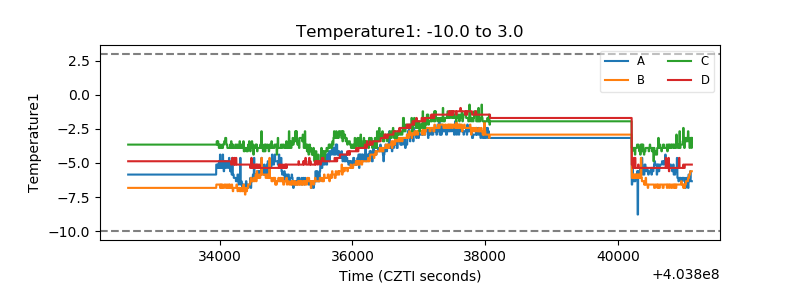 |
| Veto HV Monitor | 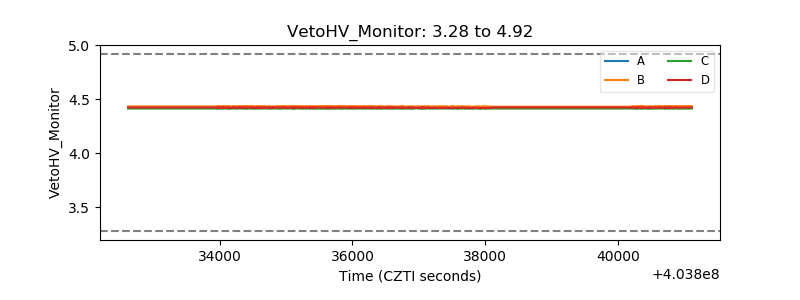 |
| Veto LLD | 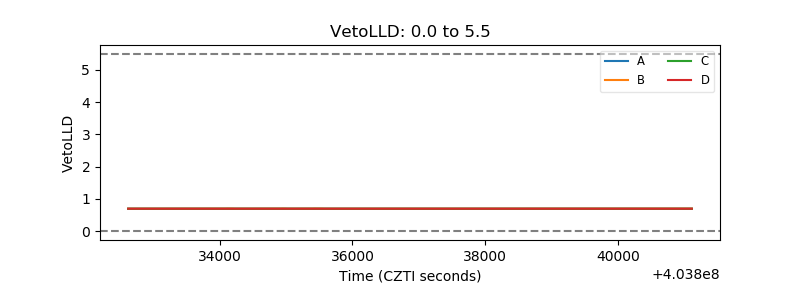 |
| Alpha Counter | 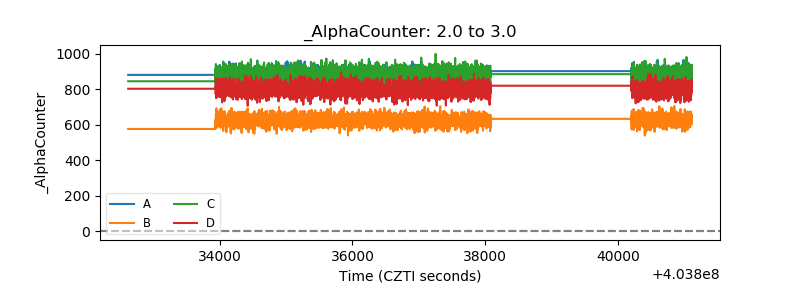 |
| _CPM_Rate | 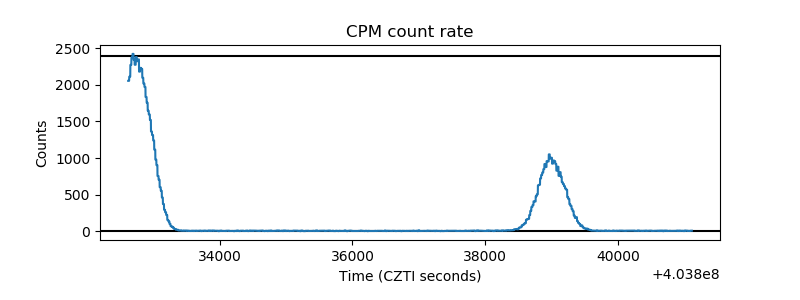 |
| CZT Counter | 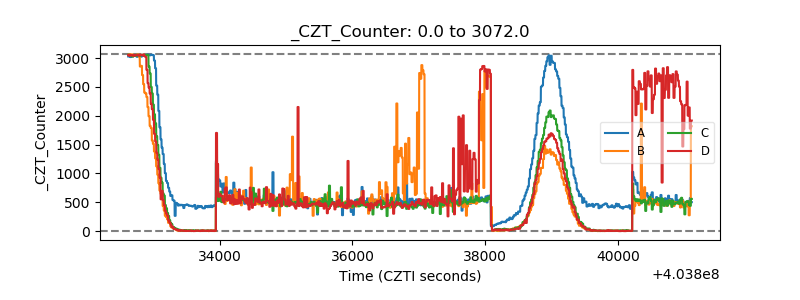 |
| +2.5 Volts monitor | 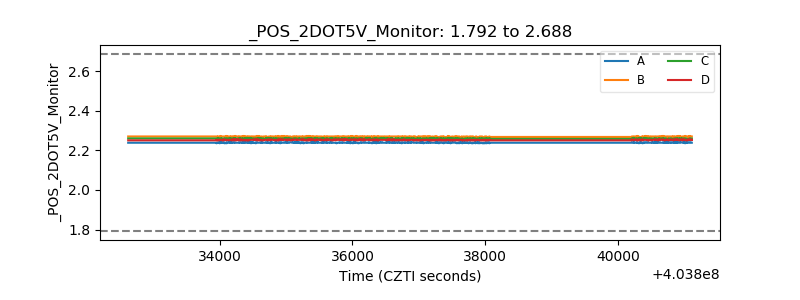 |
| +5 Volts monitor |  |
| _ROLL_ROT | 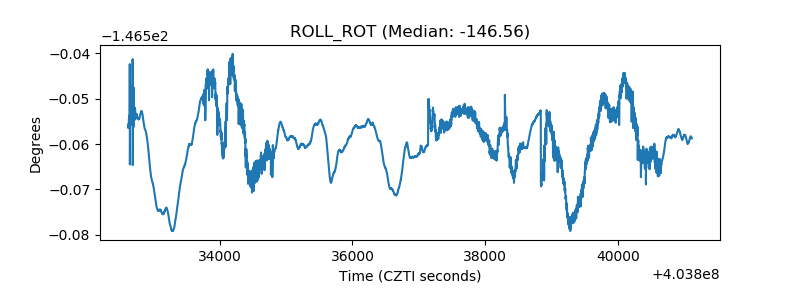 |
| _Roll_DEC | 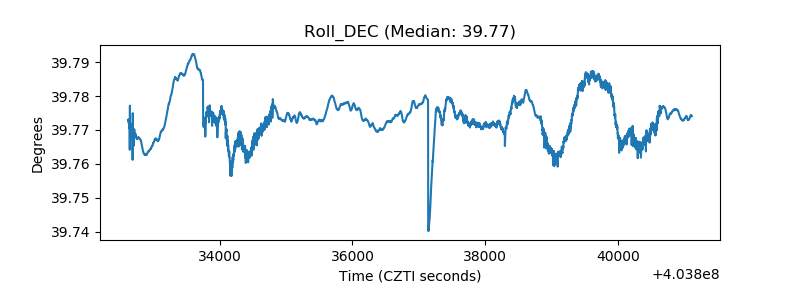 |
| _Roll_RA | 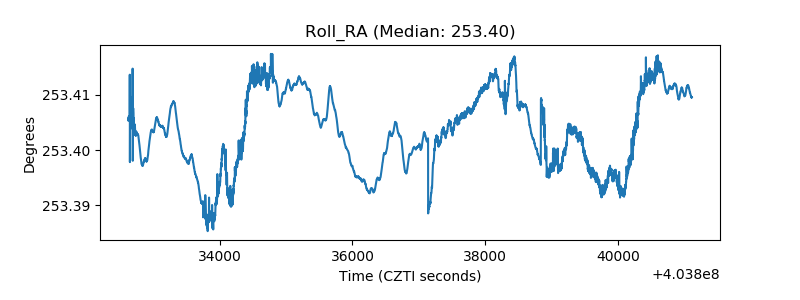 |
| Veto Counter | 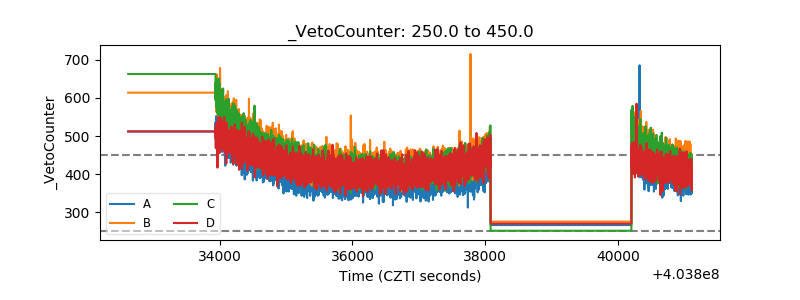 |