| Param | Original file | Final file |
|---|---|---|
| Filename | modeM0/AS1A07_145T01_9000005370_38160cztM0_level2.fits | modeM0/AS1A07_145T01_9000005370_38160cztM0_level2_quad_clean.evt |
| Size (bytes) | 520,580,160 | 77,016,960 |
| Size | 496.5 MB | 73.4 MB |
| Events in quadrant A | 2,667,617 | 609,925 |
| Events in quadrant B | 2,552,888 | 623,650 |
| Events in quadrant C | 2,468,589 | 597,723 |
| Events in quadrant D | 11,186,979 | 146,378 |
| Mode M9 | |||
|---|---|---|---|
| Quadrant | BADHDUFLAG | Total packets | Discarded packets |
| A | 0 | 35 | 0 |
| B | 0 | 35 | 0 |
| C | 0 | 35 | 0 |
| D | 0 | 36 | 0 |
| Mode SS | |||
|---|---|---|---|
| Quadrant | BADHDUFLAG | Total packets | Discarded packets |
| A | 0 | 104 | 0 |
| B | 0 | 104 | 0 |
| C | 0 | 104 | 0 |
| D | 0 | 104 | 0 |
| Mode M0 | |||
|---|---|---|---|
| Quadrant | BADHDUFLAG | Total packets | Discarded packets |
| A | 0 | 10888 | 3 |
| B | 0 | 10844 | 2 |
| C | 0 | 10347 | 2 |
| D | 0 | 36591 | 2 |
| Quadrant | Total seconds | Saturated seconds | Saturation percentage |
|---|---|---|---|
| A | 5055 | 8 | 0.158259% |
| B | 5055 | 54 | 1.068249% |
| C | 5055 | 8 | 0.158259% |
| D | 5055 | 3789 | 74.955490% |
Noise dominated data is calculated using 1-second bins in cleaned event files. If a bin has >2000 counts, and if more than 50% of those come from <1% of pixels, then it is considered to be noise-dominated and hence unusable.
| Quadrant | # 1 sec bins | Bins with >0 counts | Bins with >2000 counts | High rate bins dominated by noise | Noise dominated (total time) | Noise dominated (detector-on time) | Marked lightcurve |
|---|---|---|---|---|---|---|---|
| A | 7088 | 5056 | 6 | 6 | 0.08% | 0.12% | 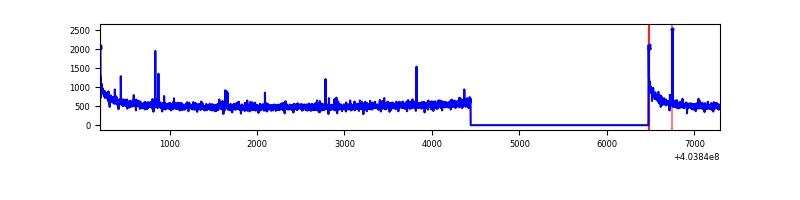 |
| B | 7088 | 5056 | 33 | 33 | 0.47% | 0.65% | 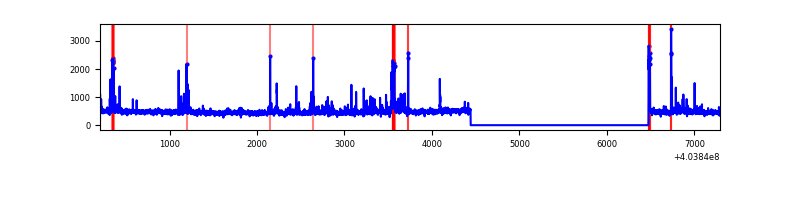 |
| C | 7088 | 5056 | 5 | 5 | 0.07% | 0.10% | 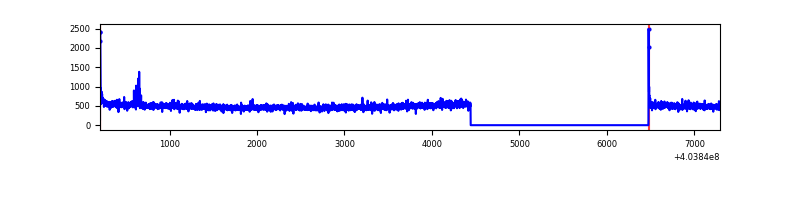 |
| D | 7088 | 5056 | 3890 | 3890 | 54.88% | 76.94% | 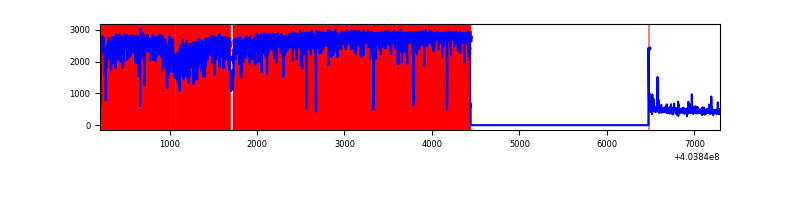 |
Top three noisy pixels from each quadrant. If the there are fewer than three noisy pixels in the level2.evt file, extra rows are filled as -1
| Pixel properties | Quadrant properties | ||||||
|---|---|---|---|---|---|---|---|
| Quadrant | DetID | PixID | Counts | Sigma | Mean | Median | Sigma |
| A | 10 | 83 | 359079 | 3054.09 | 585 | 574 | 117.4 |
| A | 12 | 189 | 14594 | 119.44 | 585 | 574 | 117.4 |
| A | 10 | 248 | 14298 | 116.91 | 585 | 574 | 117.4 |
| B | 4 | 171 | 157230 | 1410.21 | 580 | 564 | 111.1 |
| B | 15 | 85 | 60678 | 541.11 | 580 | 564 | 111.1 |
| B | 5 | 172 | 46237 | 411.12 | 580 | 564 | 111.1 |
| C | 15 | 214 | 212188 | 1598.66 | 567 | 571 | 132.4 |
| C | 0 | 10 | 25187 | 185.96 | 567 | 571 | 132.4 |
| C | 14 | 254 | 15747 | 114.65 | 567 | 571 | 132.4 |
| D | 10 | 203 | 9705343 | 117237.73 | 338 | 330 | 82.8 |
| D | 12 | 233 | 56848 | 682.74 | 338 | 330 | 82.8 |
| D | 12 | 235 | 33455 | 400.15 | 338 | 330 | 82.8 |
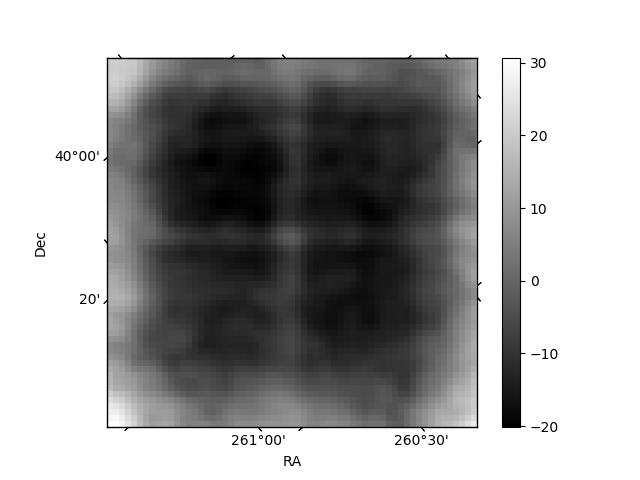
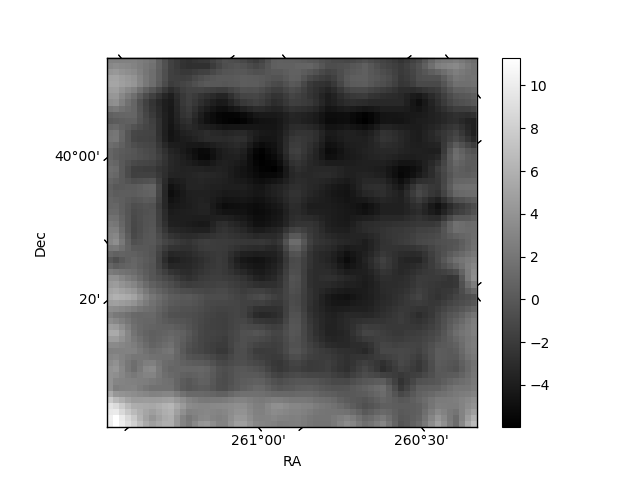
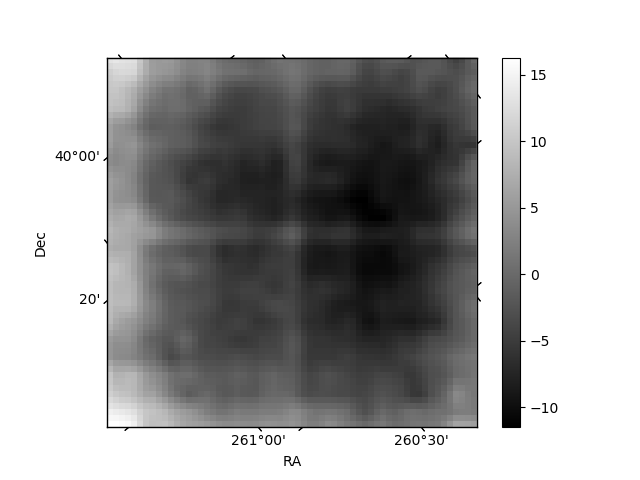
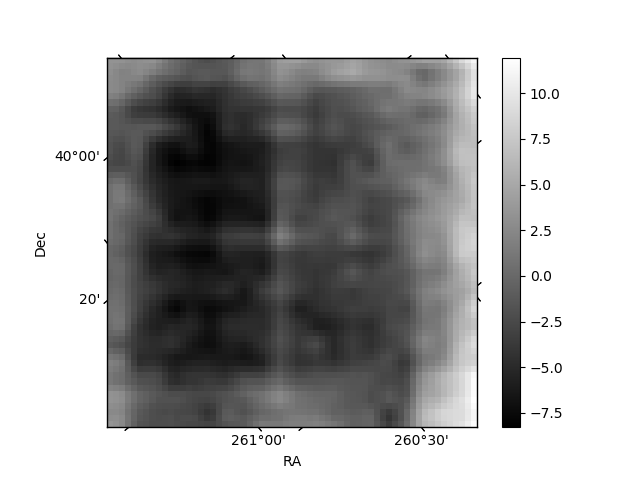
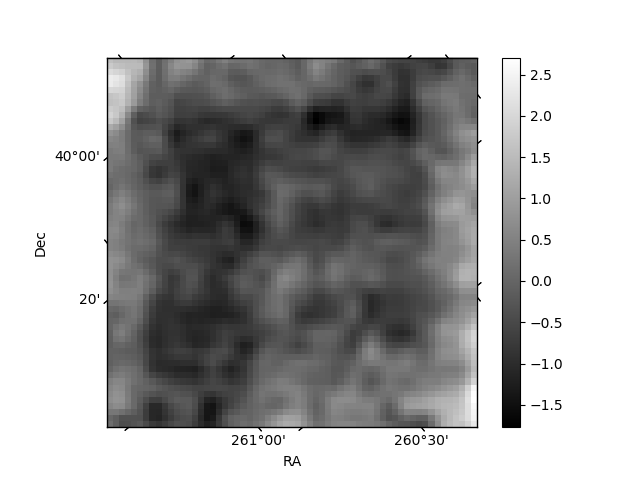
Histogram calculated using DETX and DETY for each event in the final _common_clean file
| Quadrant A | 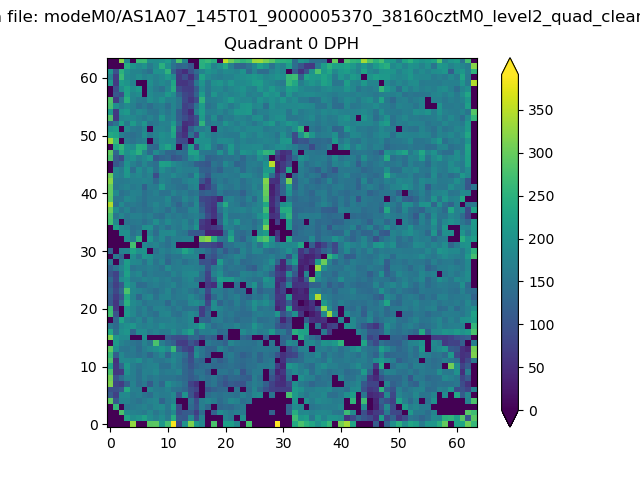 |
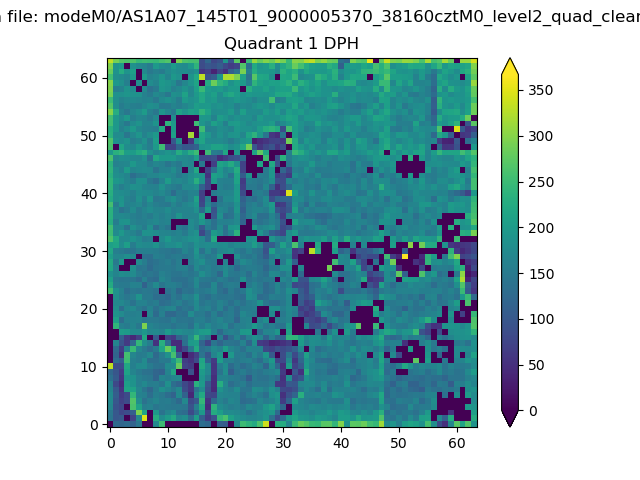 |
Quadrant B |
|---|---|---|---|
| Quadrant D | 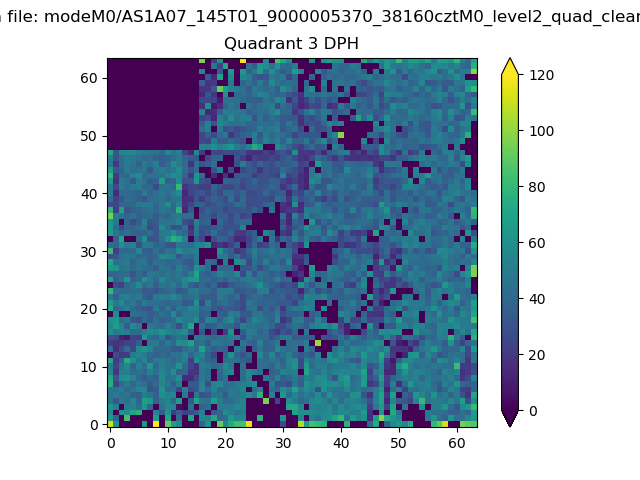 |
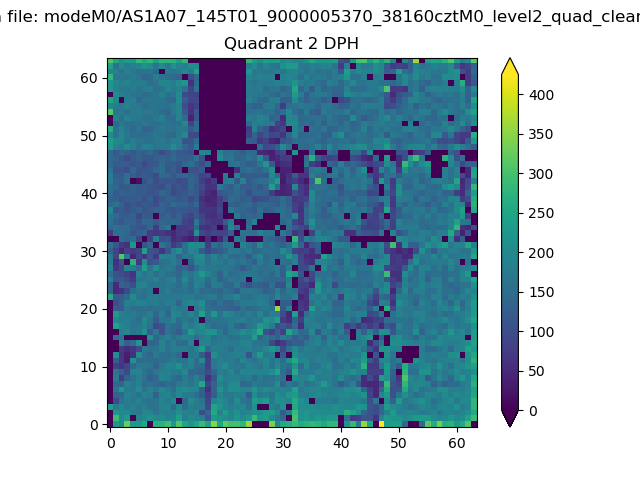 |
Quadrant C |
| Plot type | Count rate plots | Images |
|---|---|---|
| Comparison with Poisson distribution Blue bars denote a histogram of data divided into 1 sec bins. Red curve is a Poisson curve with rate = median count rate of data. |
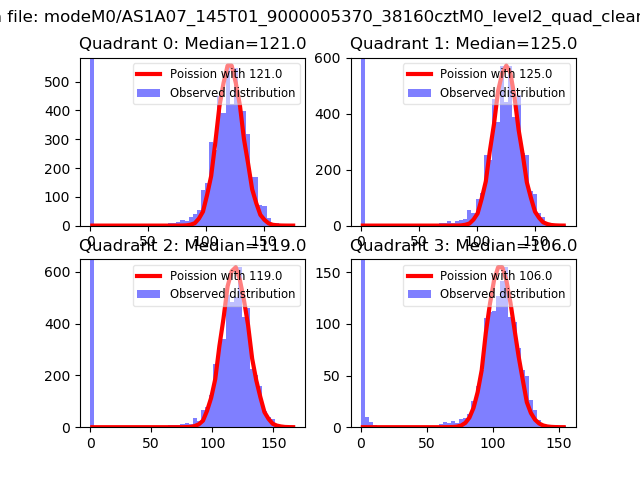 |
 |
| Quadrant-wise count rates Data is divided into 100 sec bins |
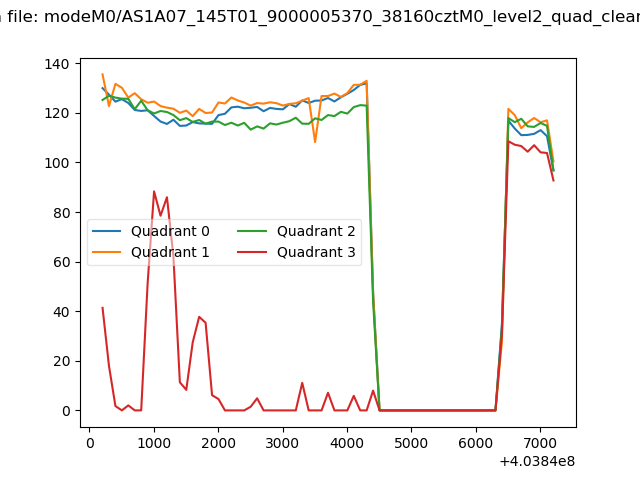 |
|
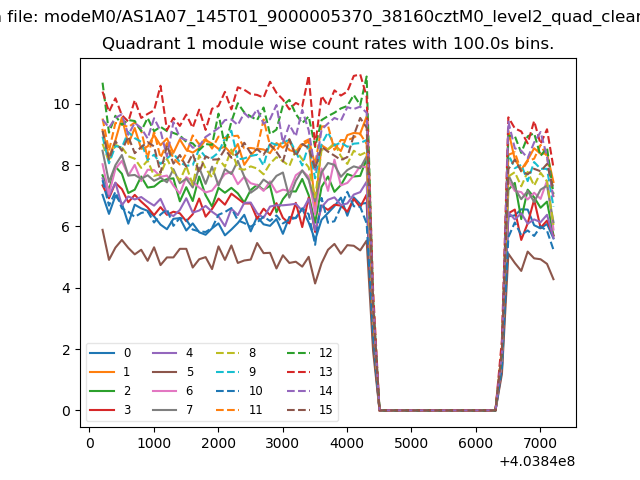
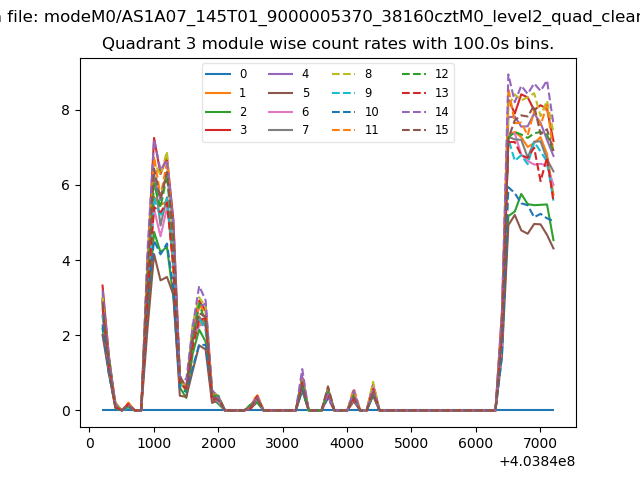
| Module-wise count rates for Quadrant A Data is divided into 100 sec bins |
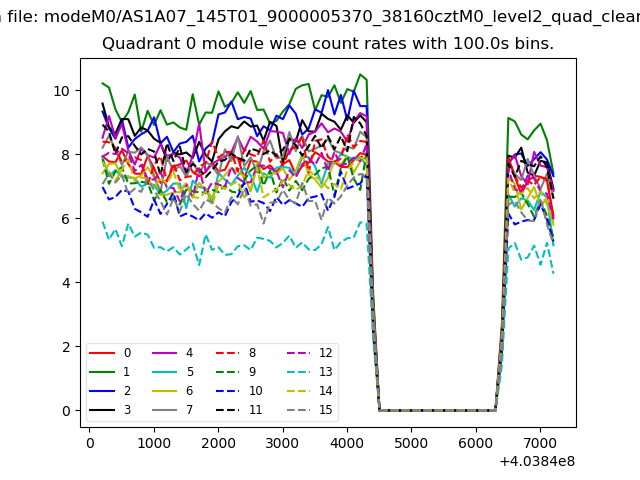 |
 |
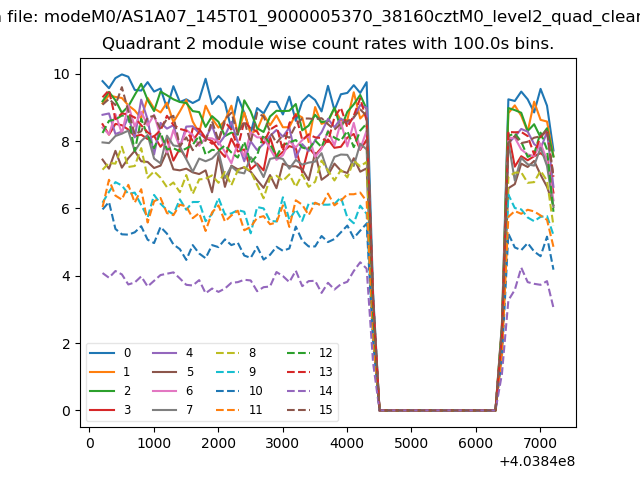
| Module-wise count rates for Quadrant B Data is divided into 100 sec bins |
 |
 |
| Module-wise count rates for Quadrant C Data is divided into 100 sec bins |
 |
 |
| Module-wise count rates for Quadrant D Data is divided into 100 sec bins |
 |
 |
| Parameter | Plot |
|---|---|
| CZT HV Monitor |  |
| D_VDD | 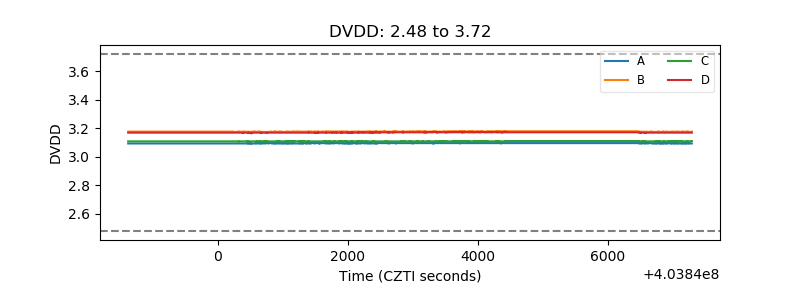 |
| Temperature 1 | 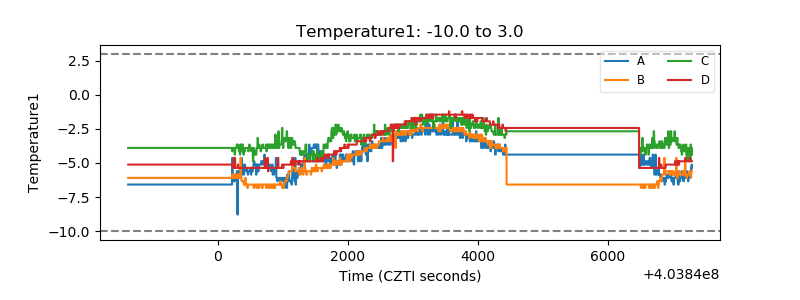 |
| Veto HV Monitor | 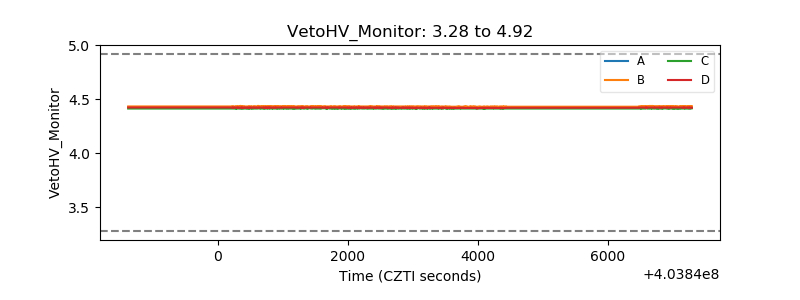 |
| Veto LLD | 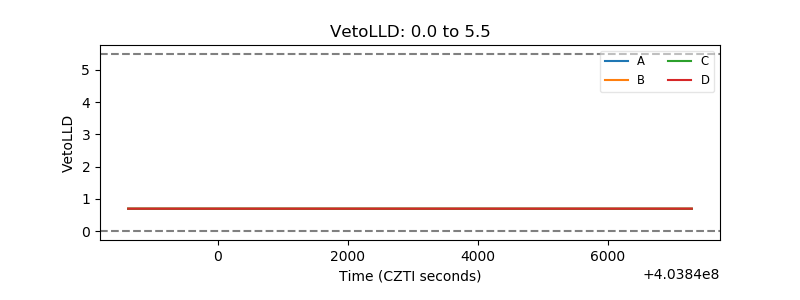 |
| Alpha Counter | 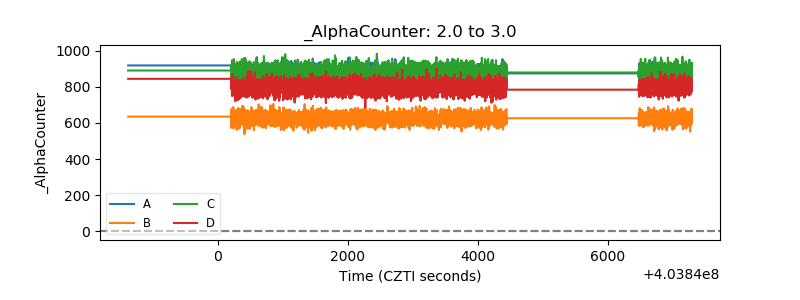 |
| _CPM_Rate | 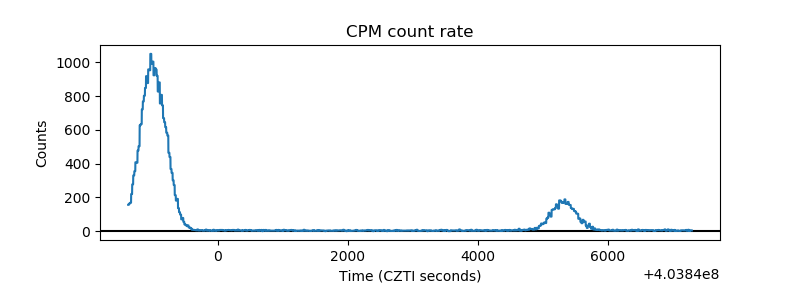 |
| CZT Counter | 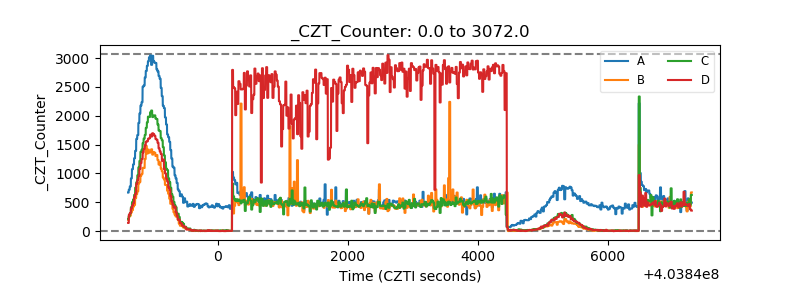 |
| +2.5 Volts monitor | 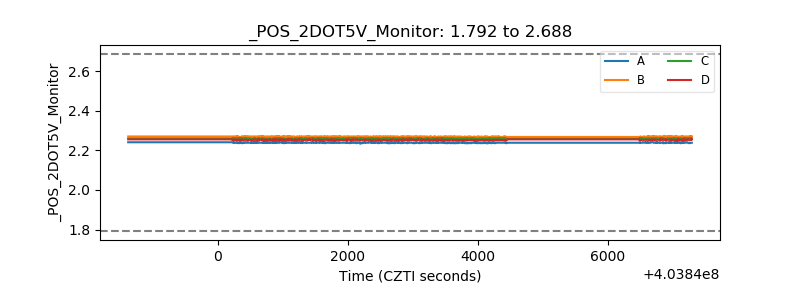 |
| +5 Volts monitor | 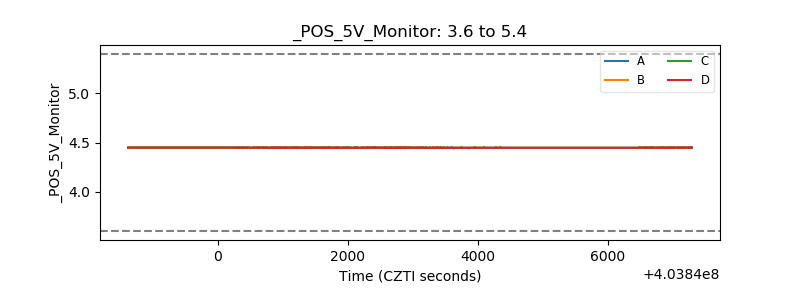 |
| _ROLL_ROT | 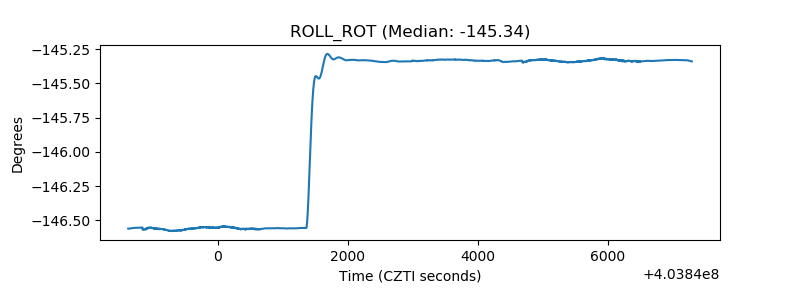 |
| _Roll_DEC | 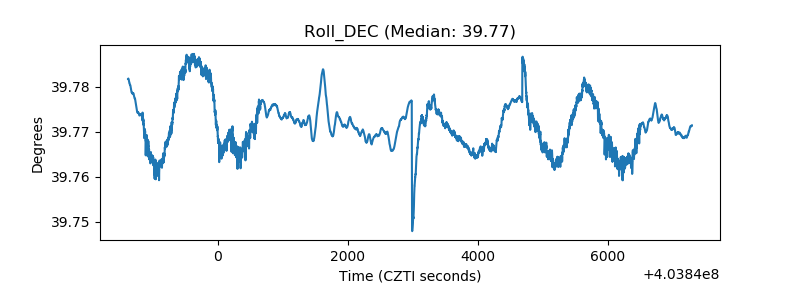 |
| _Roll_RA | 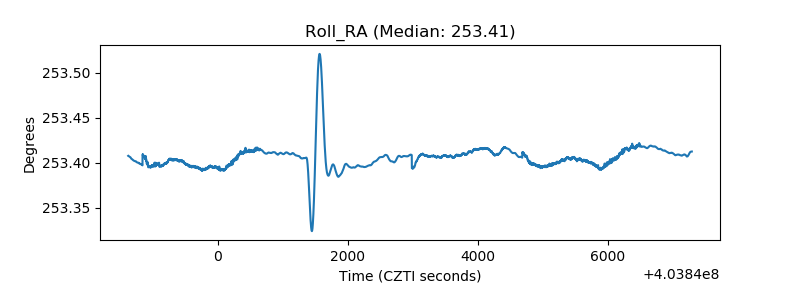 |
| Veto Counter | 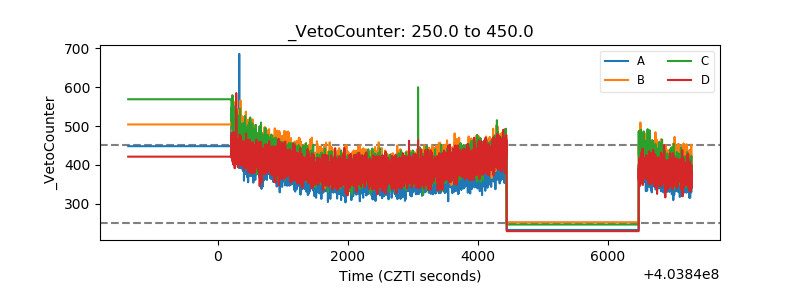 |