| Param | Original file | Final file |
|---|---|---|
| Filename | modeM0/AS1A07_145T01_9000005370_38161cztM0_level2.fits | modeM0/AS1A07_145T01_9000005370_38161cztM0_level2_quad_clean.evt |
| Size (bytes) | 297,964,800 | 91,581,120 |
| Size | 284.2 MB | 87.3 MB |
| Events in quadrant A | 2,736,831 | 612,615 |
| Events in quadrant B | 2,517,007 | 630,409 |
| Events in quadrant C | 2,540,028 | 603,430 |
| Events in quadrant D | 2,822,588 | 555,508 |
| Mode M9 | |||
|---|---|---|---|
| Quadrant | BADHDUFLAG | Total packets | Discarded packets |
| A | 0 | 26 | 0 |
| B | 0 | 26 | 0 |
| C | 0 | 26 | 0 |
| D | 0 | 27 | 0 |
| Mode SS | |||
|---|---|---|---|
| Quadrant | BADHDUFLAG | Total packets | Discarded packets |
| A | 0 | 108 | 0 |
| B | 0 | 108 | 0 |
| C | 0 | 108 | 0 |
| D | 0 | 108 | 0 |
| Mode M0 | |||
|---|---|---|---|
| Quadrant | BADHDUFLAG | Total packets | Discarded packets |
| A | 0 | 11269 | 3 |
| B | 0 | 11086 | 2 |
| C | 0 | 10794 | 2 |
| D | 0 | 11854 | 2 |
| Quadrant | Total seconds | Saturated seconds | Saturation percentage |
|---|---|---|---|
| A | 5301 | 14 | 0.264101% |
| B | 5301 | 46 | 0.867761% |
| C | 5301 | 7 | 0.132051% |
| D | 5301 | 31 | 0.584795% |
Noise dominated data is calculated using 1-second bins in cleaned event files. If a bin has >2000 counts, and if more than 50% of those come from <1% of pixels, then it is considered to be noise-dominated and hence unusable.
| Quadrant | # 1 sec bins | Bins with >0 counts | Bins with >2000 counts | High rate bins dominated by noise | Noise dominated (total time) | Noise dominated (detector-on time) | Marked lightcurve |
|---|---|---|---|---|---|---|---|
| A | 7064 | 5302 | 8 | 8 | 0.11% | 0.15% | 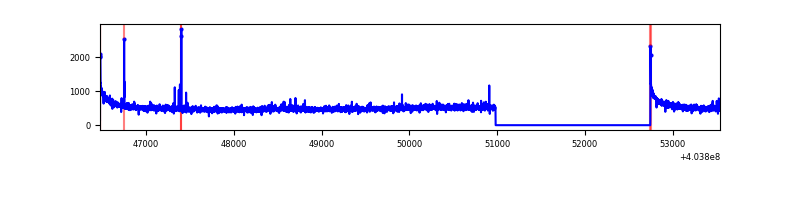 |
| B | 7064 | 5302 | 23 | 23 | 0.33% | 0.43% | 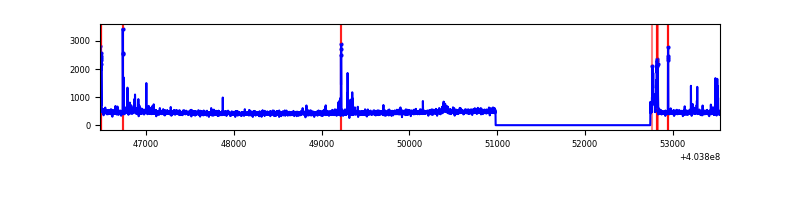 |
| C | 7064 | 5302 | 4 | 4 | 0.06% | 0.08% | 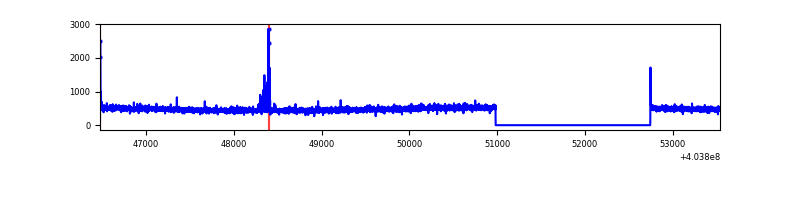 |
| D | 7064 | 5302 | 31 | 31 | 0.44% | 0.58% | 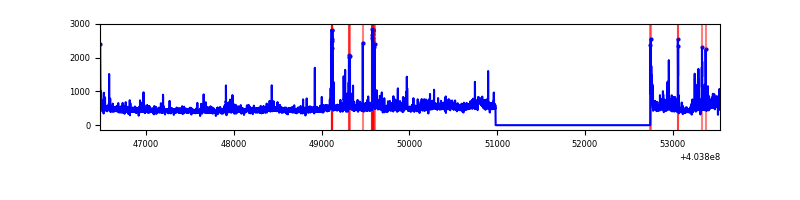 |
Top three noisy pixels from each quadrant. If the there are fewer than three noisy pixels in the level2.evt file, extra rows are filled as -1
| Pixel properties | Quadrant properties | ||||||
|---|---|---|---|---|---|---|---|
| Quadrant | DetID | PixID | Counts | Sigma | Mean | Median | Sigma |
| A | 10 | 83 | 366120 | 3000.51 | 600 | 588 | 121.8 |
| A | 12 | 189 | 24678 | 197.75 | 600 | 588 | 121.8 |
| A | 9 | 143 | 12859 | 100.73 | 600 | 588 | 121.8 |
| B | 4 | 171 | 108991 | 934.75 | 596 | 582 | 116.0 |
| B | 5 | 172 | 63794 | 545.04 | 596 | 582 | 116.0 |
| B | 12 | 111 | 14444 | 119.52 | 596 | 582 | 116.0 |
| C | 15 | 214 | 223248 | 1644.21 | 581 | 584 | 135.4 |
| C | 1 | 23 | 32927 | 238.83 | 581 | 584 | 135.4 |
| C | 0 | 10 | 14691 | 104.17 | 581 | 584 | 135.4 |
| D | 12 | 235 | 131597 | 922.57 | 582 | 568 | 142.0 |
| D | 2 | 250 | 101338 | 709.52 | 582 | 568 | 142.0 |
| D | 13 | 171 | 76844 | 537.06 | 582 | 568 | 142.0 |
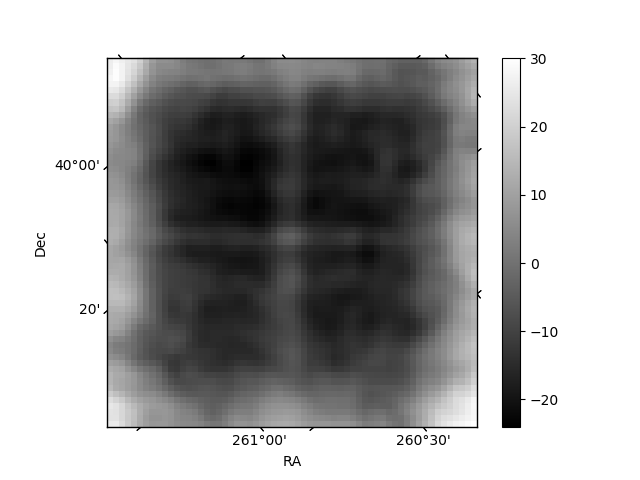
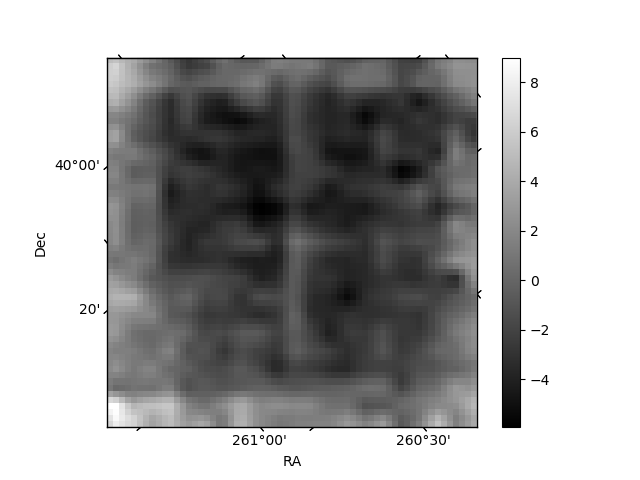
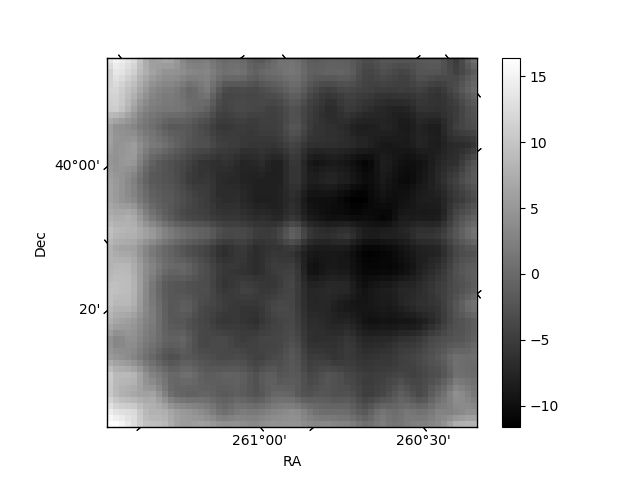
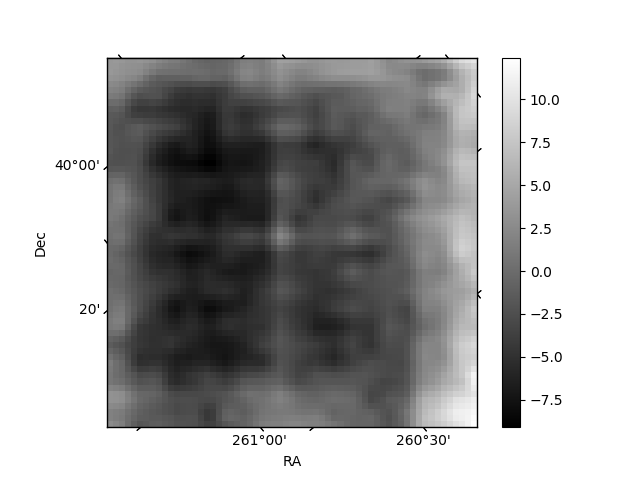
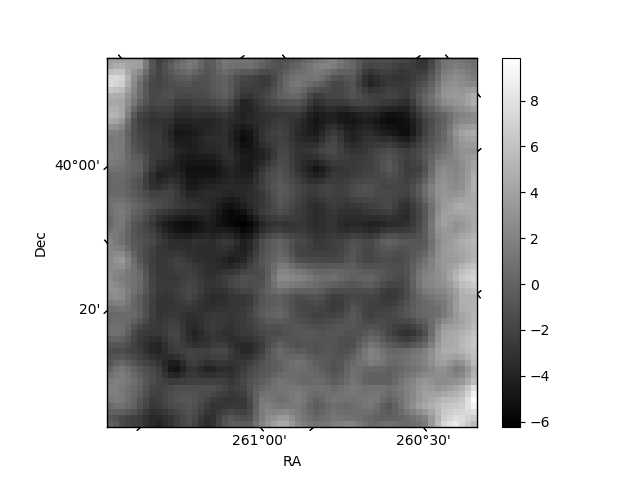
Histogram calculated using DETX and DETY for each event in the final _common_clean file
| Quadrant A | 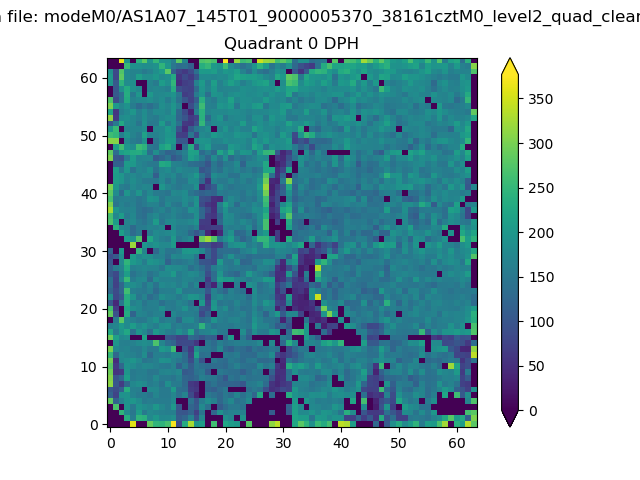 |
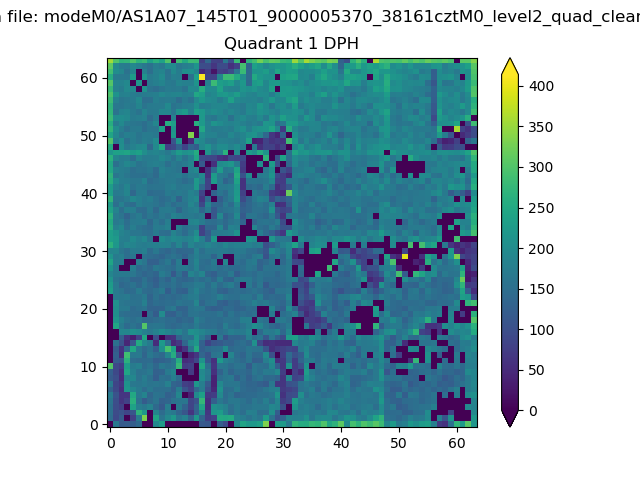 |
Quadrant B |
|---|---|---|---|
| Quadrant D | 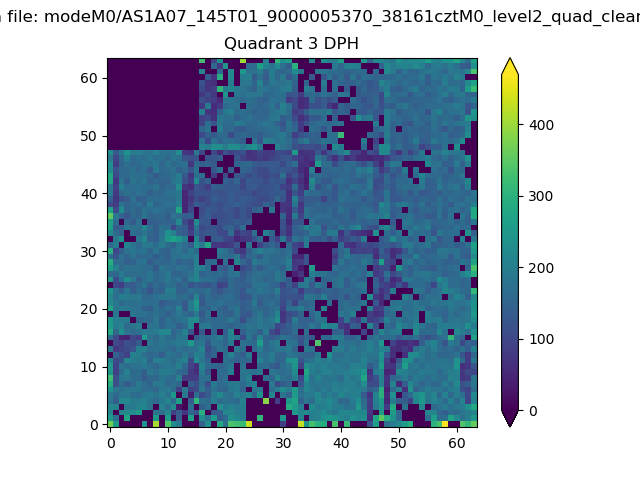 |
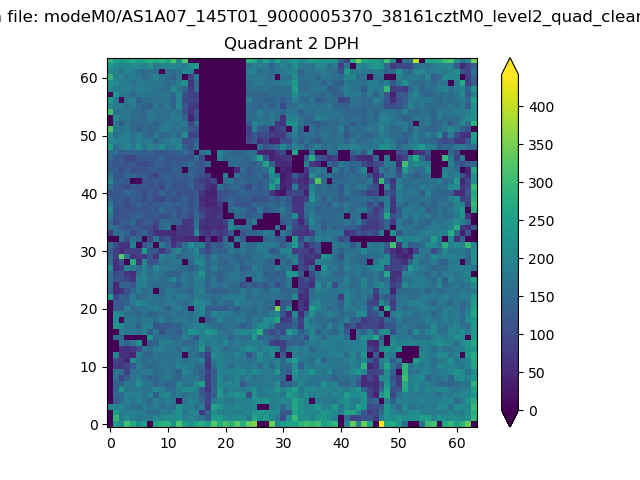 |
Quadrant C |
| Plot type | Count rate plots | Images |
|---|---|---|
| Comparison with Poisson distribution Blue bars denote a histogram of data divided into 1 sec bins. Red curve is a Poisson curve with rate = median count rate of data. |
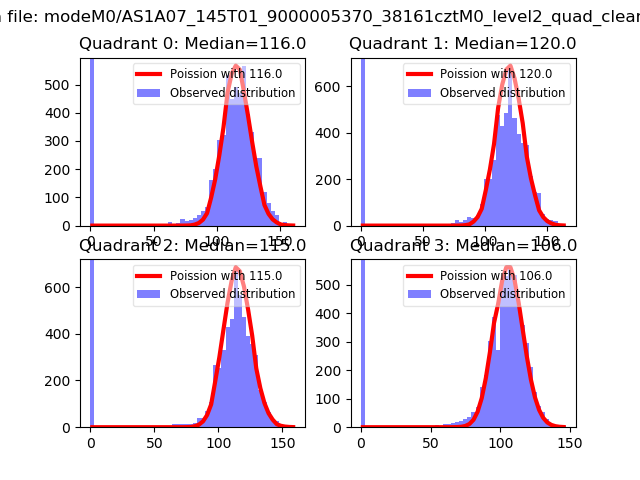 |
 |
| Quadrant-wise count rates Data is divided into 100 sec bins |
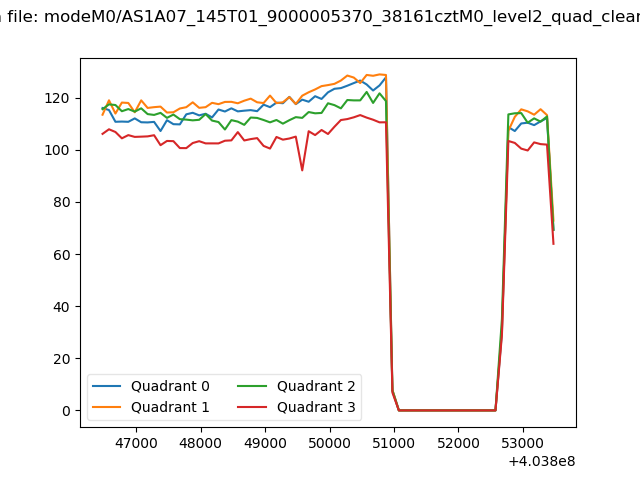 |
|
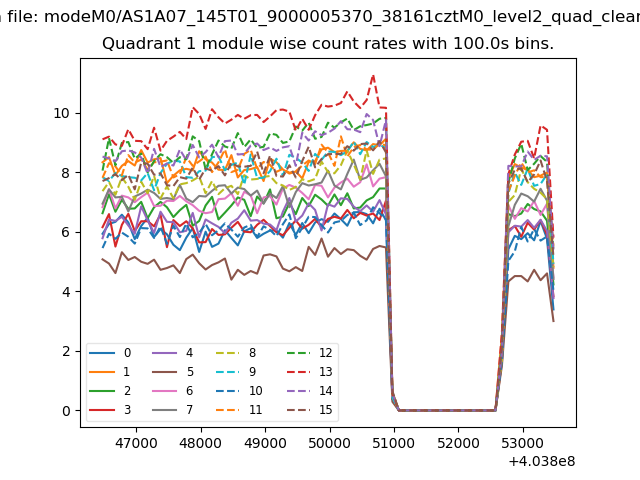
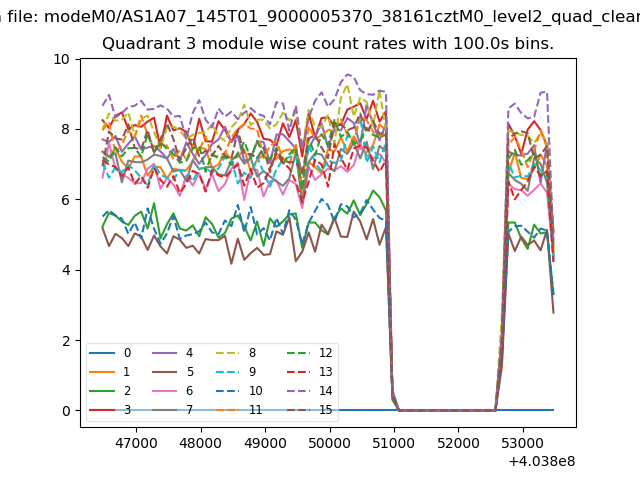
| Module-wise count rates for Quadrant A Data is divided into 100 sec bins |
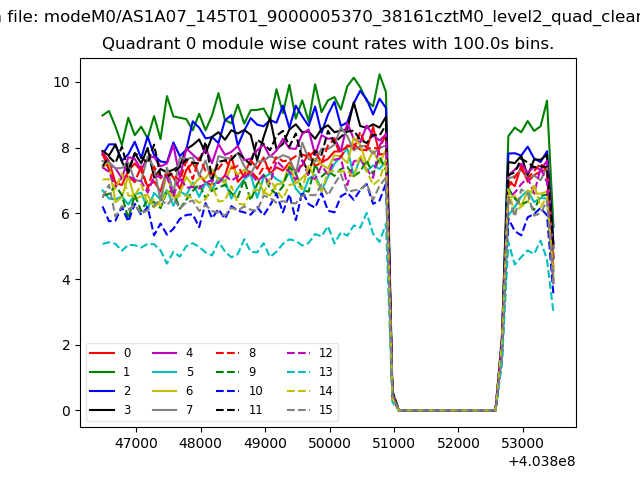 |
 |
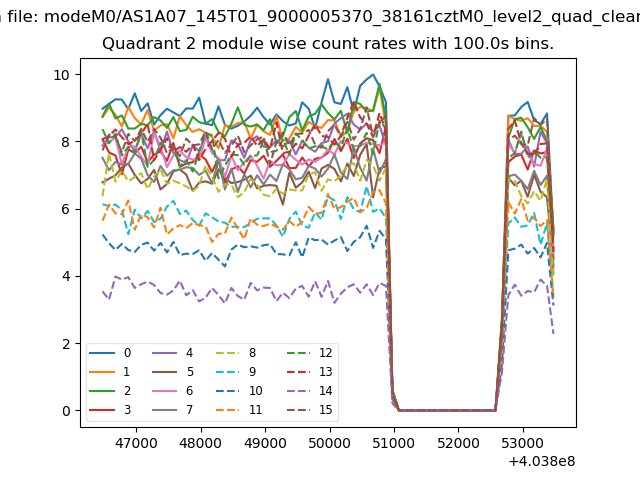
| Module-wise count rates for Quadrant B Data is divided into 100 sec bins |
 |
 |
| Module-wise count rates for Quadrant C Data is divided into 100 sec bins |
 |
 |
| Module-wise count rates for Quadrant D Data is divided into 100 sec bins |
 |
 |
| Parameter | Plot |
|---|---|
| CZT HV Monitor | 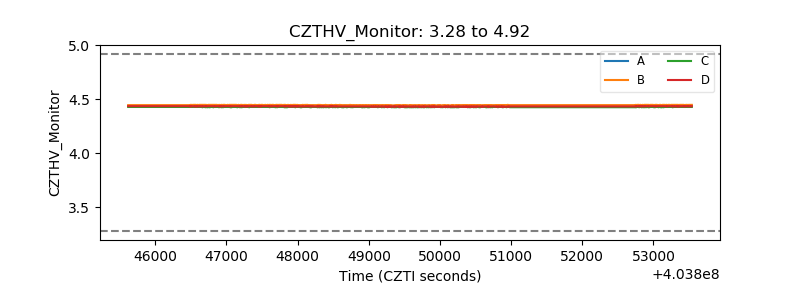 |
| D_VDD | 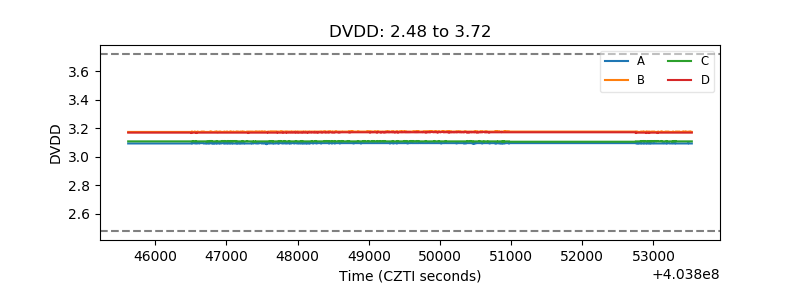 |
| Temperature 1 | 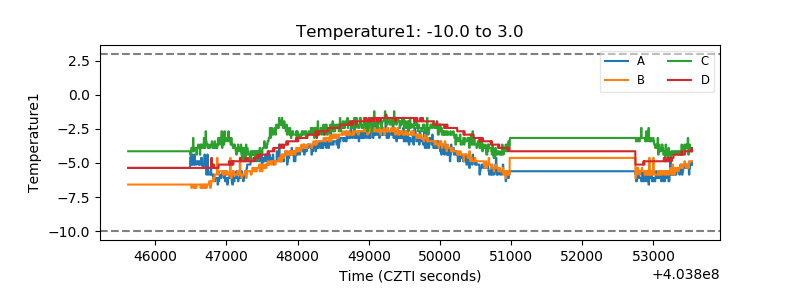 |
| Veto HV Monitor | 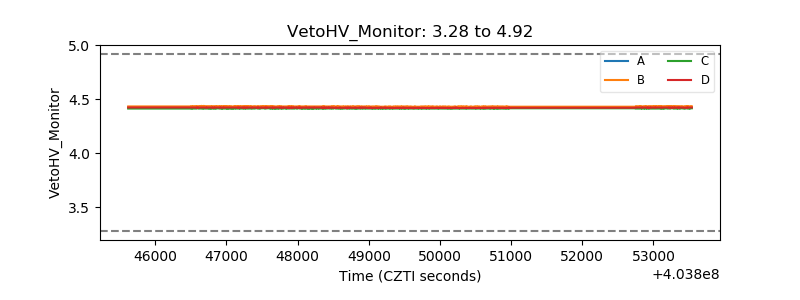 |
| Veto LLD | 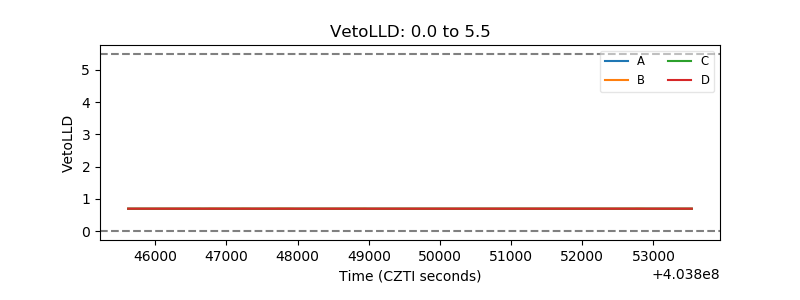 |
| Alpha Counter | 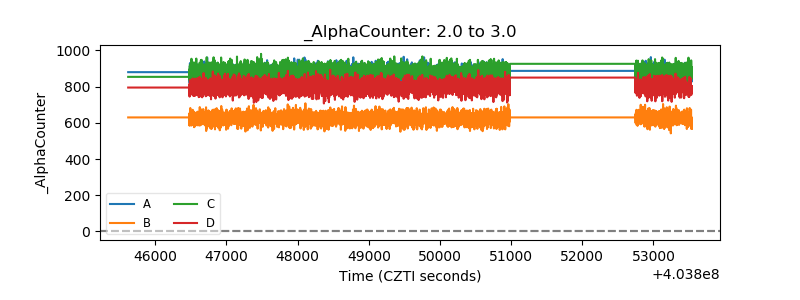 |
| _CPM_Rate | 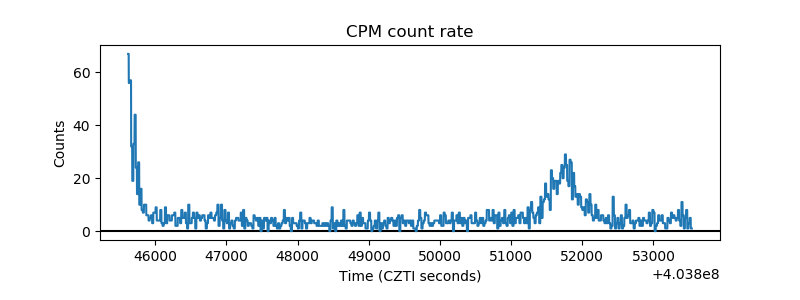 |
| CZT Counter | 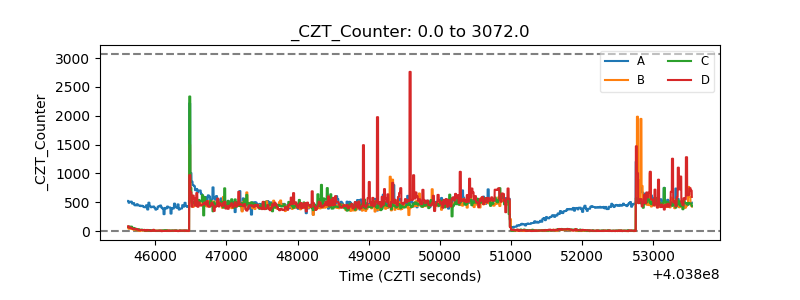 |
| +2.5 Volts monitor | 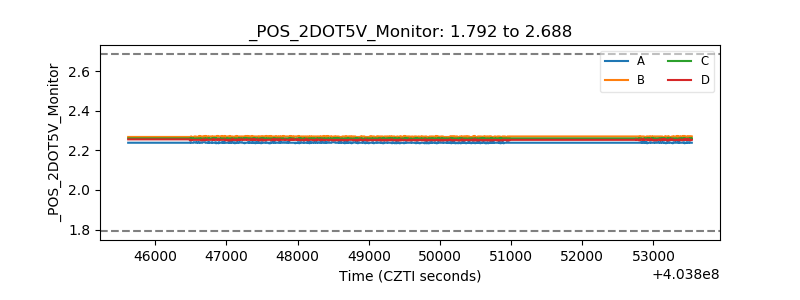 |
| +5 Volts monitor | 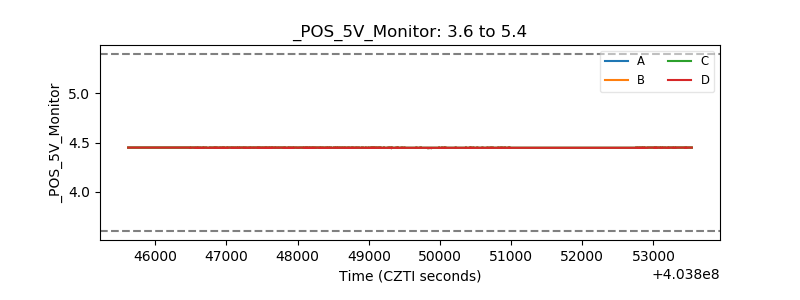 |
| _ROLL_ROT | 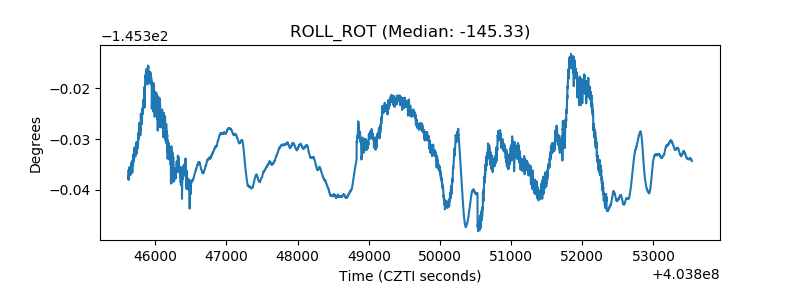 |
| _Roll_DEC | 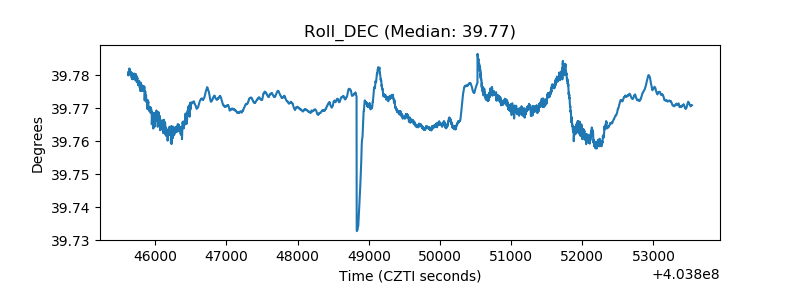 |
| _Roll_RA | 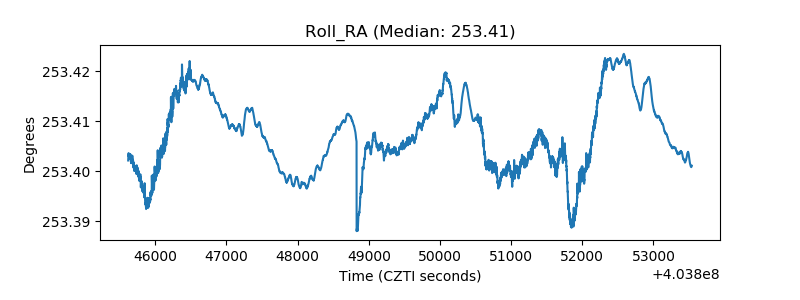 |
| Veto Counter | 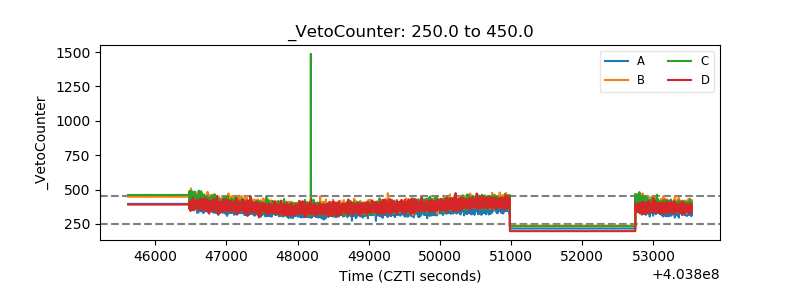 |