| Param | Original file | Final file |
|---|---|---|
| Filename | modeM0/AS1A07_145T01_9000005370_38162cztM0_level2.fits | modeM0/AS1A07_145T01_9000005370_38162cztM0_level2_quad_clean.evt |
| Size (bytes) | 327,968,640 | 97,145,280 |
| Size | 312.8 MB | 92.6 MB |
| Events in quadrant A | 3,003,453 | 652,609 |
| Events in quadrant B | 2,726,584 | 667,404 |
| Events in quadrant C | 2,737,111 | 634,706 |
| Events in quadrant D | 3,228,699 | 587,927 |
| Mode M9 | |||
|---|---|---|---|
| Quadrant | BADHDUFLAG | Total packets | Discarded packets |
| A | 0 | 17 | 0 |
| B | 0 | 17 | 0 |
| C | 0 | 17 | 0 |
| D | 0 | 18 | 0 |
| Mode SS | |||
|---|---|---|---|
| Quadrant | BADHDUFLAG | Total packets | Discarded packets |
| A | 0 | 116 | 0 |
| B | 0 | 116 | 0 |
| C | 0 | 116 | 0 |
| D | 0 | 116 | 0 |
| Mode M0 | |||
|---|---|---|---|
| Quadrant | BADHDUFLAG | Total packets | Discarded packets |
| A | 0 | 12292 | 3 |
| B | 0 | 11915 | 2 |
| C | 0 | 11662 | 2 |
| D | 0 | 13191 | 2 |
| Quadrant | Total seconds | Saturated seconds | Saturation percentage |
|---|---|---|---|
| A | 5705 | 12 | 0.210342% |
| B | 5705 | 35 | 0.613497% |
| C | 5705 | 20 | 0.350570% |
| D | 5705 | 41 | 0.718668% |
Noise dominated data is calculated using 1-second bins in cleaned event files. If a bin has >2000 counts, and if more than 50% of those come from <1% of pixels, then it is considered to be noise-dominated and hence unusable.
| Quadrant | # 1 sec bins | Bins with >0 counts | Bins with >2000 counts | High rate bins dominated by noise | Noise dominated (total time) | Noise dominated (detector-on time) | Marked lightcurve |
|---|---|---|---|---|---|---|---|
| A | 7137 | 5706 | 5 | 5 | 0.07% | 0.09% | 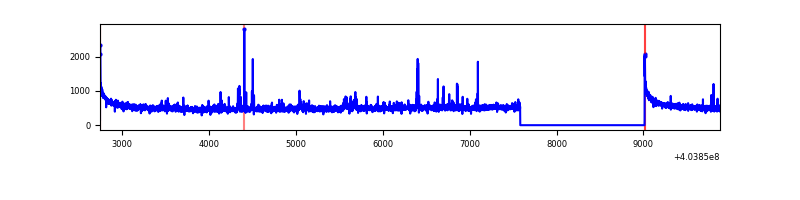 |
| B | 7137 | 5706 | 15 | 15 | 0.21% | 0.26% | 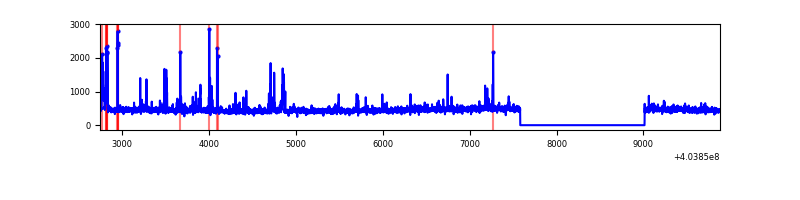 |
| C | 7137 | 5706 | 15 | 15 | 0.21% | 0.26% | 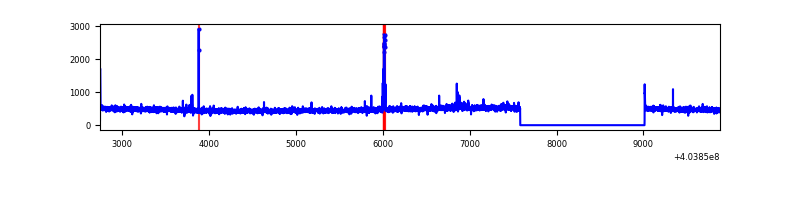 |
| D | 7137 | 5706 | 39 | 39 | 0.55% | 0.68% | 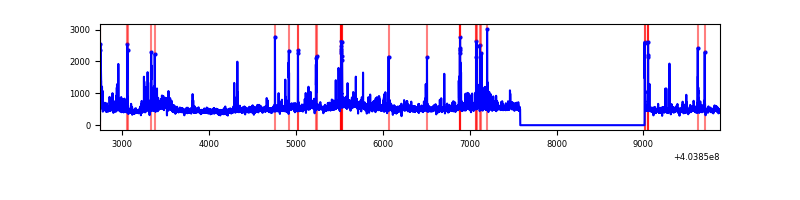 |
Top three noisy pixels from each quadrant. If the there are fewer than three noisy pixels in the level2.evt file, extra rows are filled as -1
| Pixel properties | Quadrant properties | ||||||
|---|---|---|---|---|---|---|---|
| Quadrant | DetID | PixID | Counts | Sigma | Mean | Median | Sigma |
| A | 10 | 83 | 381712 | 2917.67 | 642 | 629 | 130.6 |
| A | 12 | 189 | 68540 | 519.94 | 642 | 629 | 130.6 |
| A | 9 | 143 | 51061 | 386.12 | 642 | 629 | 130.6 |
| B | 4 | 171 | 126091 | 1006.73 | 637 | 621 | 124.6 |
| B | 5 | 172 | 74431 | 592.23 | 637 | 621 | 124.6 |
| B | 12 | 111 | 15523 | 119.57 | 637 | 621 | 124.6 |
| C | 15 | 214 | 238150 | 1620.67 | 622 | 625 | 146.6 |
| C | 1 | 23 | 49720 | 334.98 | 622 | 625 | 146.6 |
| C | 15 | 159 | 8925 | 56.63 | 622 | 625 | 146.6 |
| D | 10 | 203 | 160828 | 1050.37 | 624 | 608 | 152.5 |
| D | 12 | 235 | 148444 | 969.19 | 624 | 608 | 152.5 |
| D | 2 | 250 | 113475 | 739.94 | 624 | 608 | 152.5 |
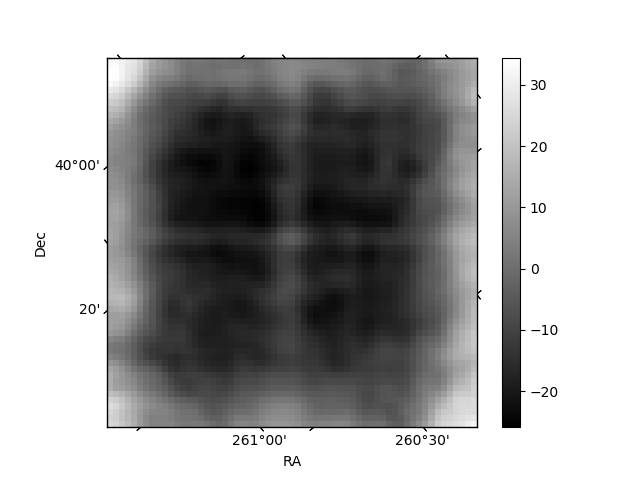
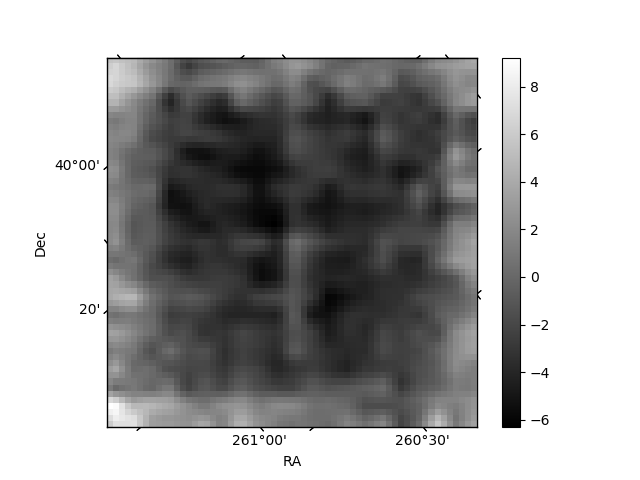
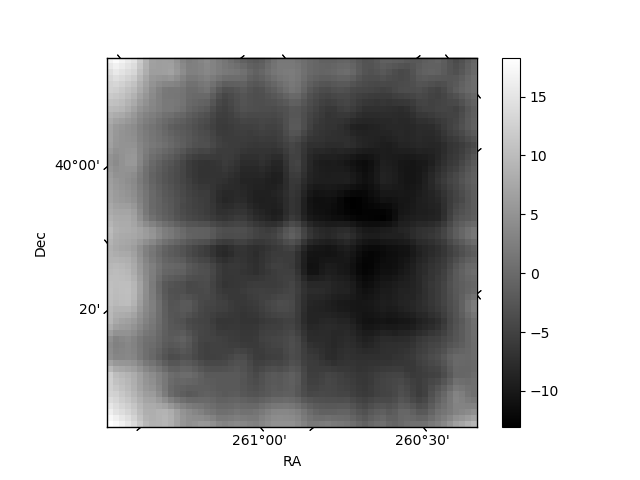
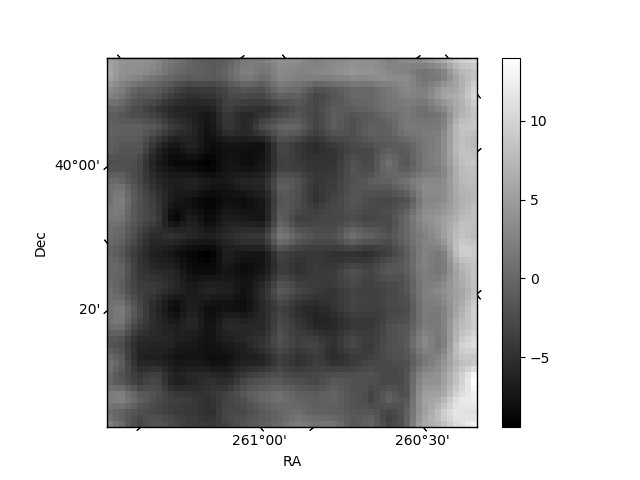
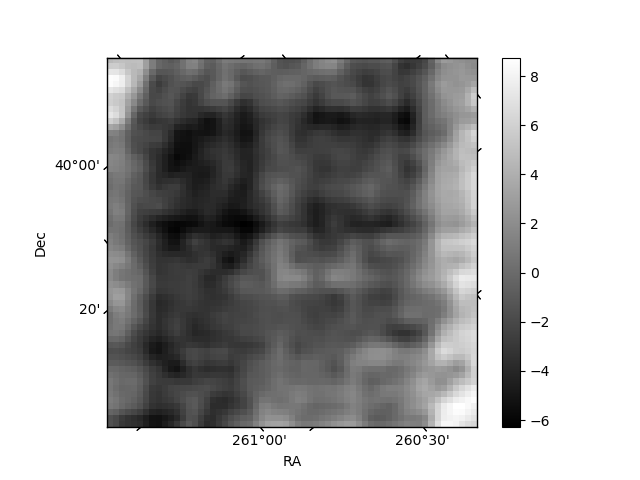
Histogram calculated using DETX and DETY for each event in the final _common_clean file
| Quadrant A | 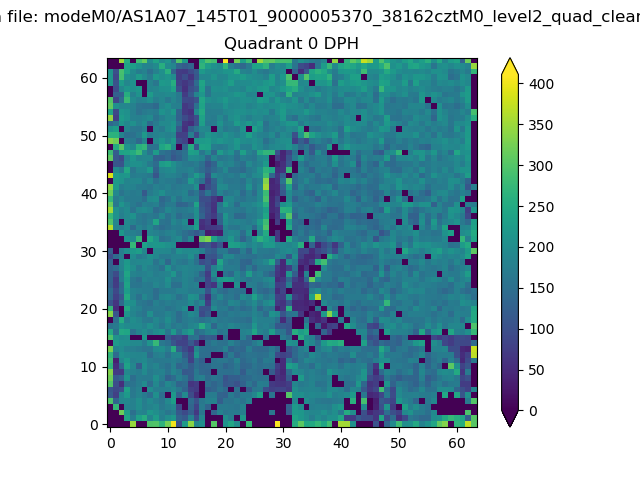 |
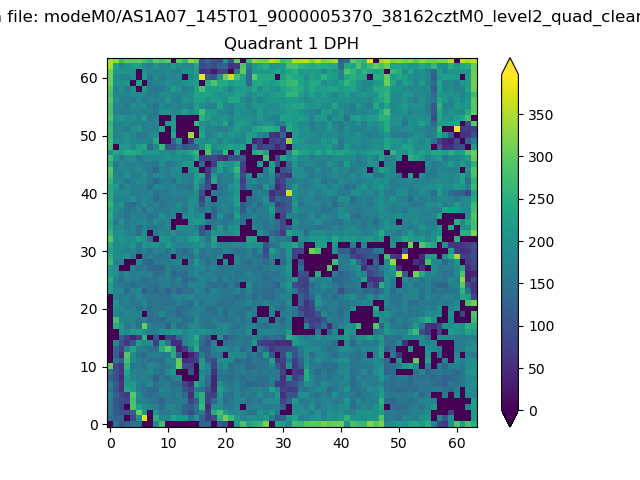 |
Quadrant B |
|---|---|---|---|
| Quadrant D | 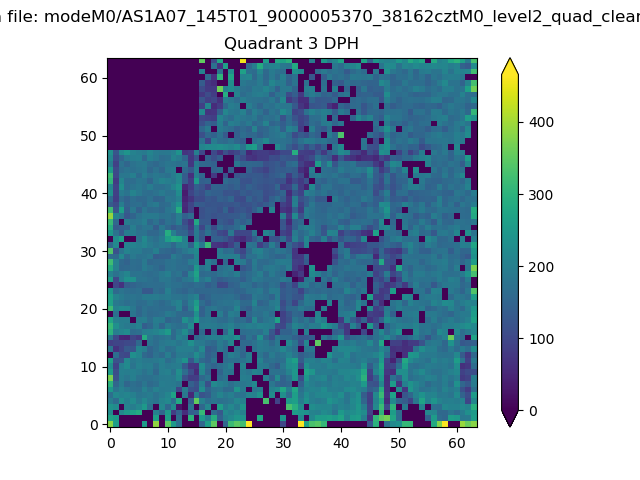 |
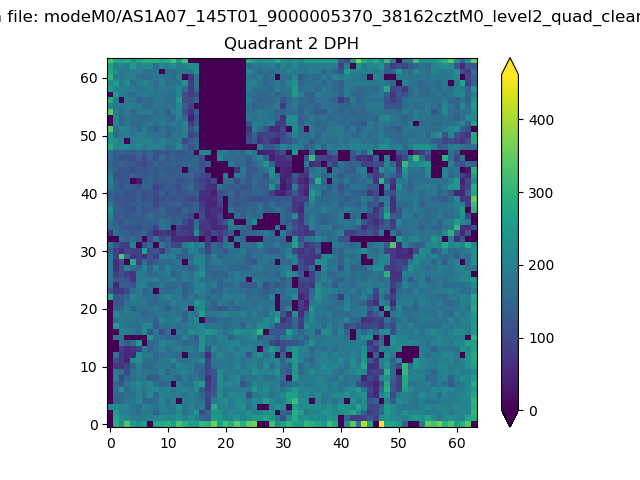 |
Quadrant C |
| Plot type | Count rate plots | Images |
|---|---|---|
| Comparison with Poisson distribution Blue bars denote a histogram of data divided into 1 sec bins. Red curve is a Poisson curve with rate = median count rate of data. |
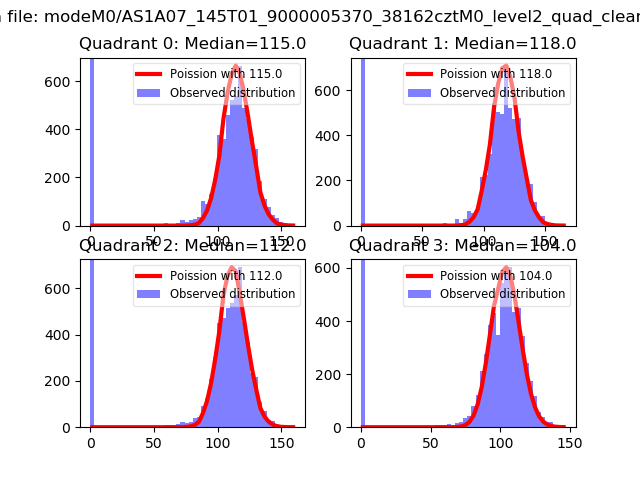 |
 |
| Quadrant-wise count rates Data is divided into 100 sec bins |
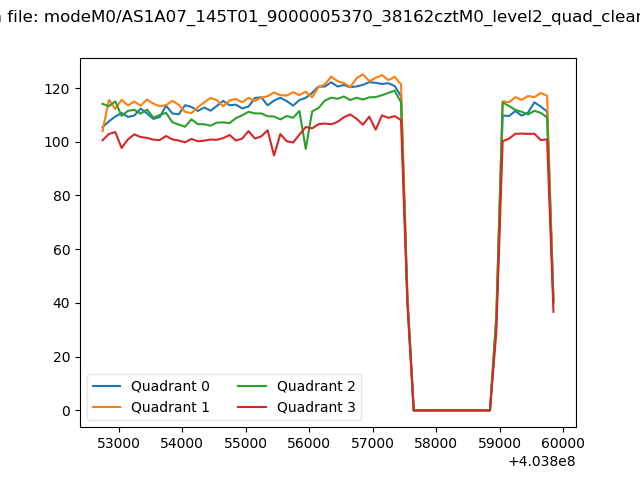 |
|
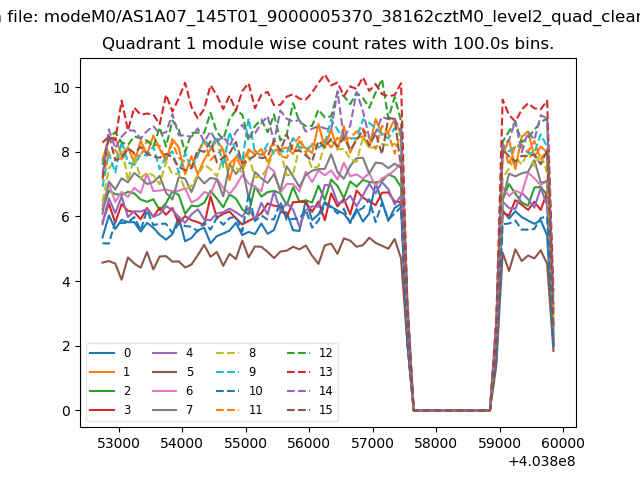
| Module-wise count rates for Quadrant A Data is divided into 100 sec bins |
 |
 |
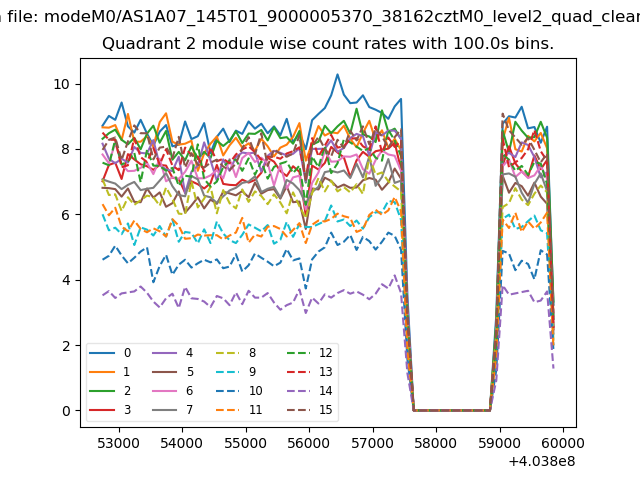
| Module-wise count rates for Quadrant B Data is divided into 100 sec bins |
 |
 |
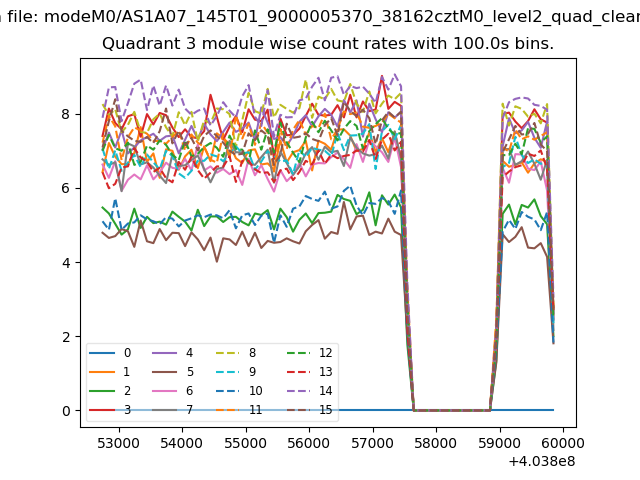
| Module-wise count rates for Quadrant C Data is divided into 100 sec bins |
 |
 |
| Module-wise count rates for Quadrant D Data is divided into 100 sec bins |
 |
 |
| Parameter | Plot |
|---|---|
| CZT HV Monitor | 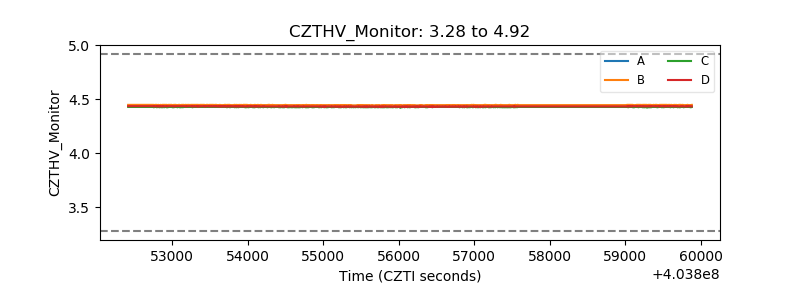 |
| D_VDD | 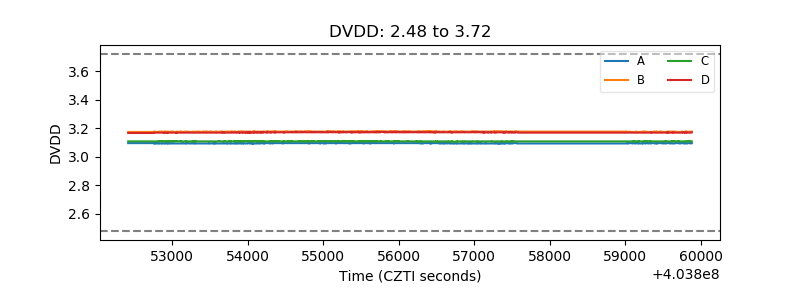 |
| Temperature 1 | 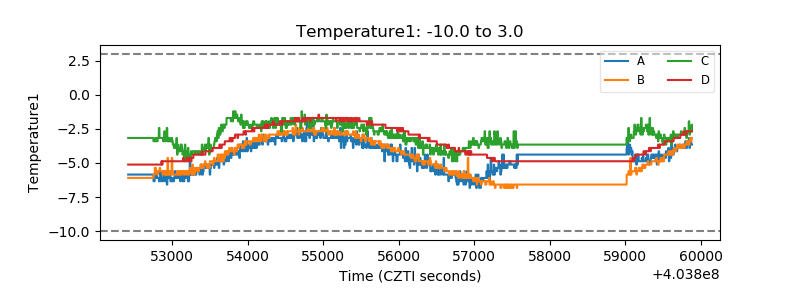 |
| Veto HV Monitor | 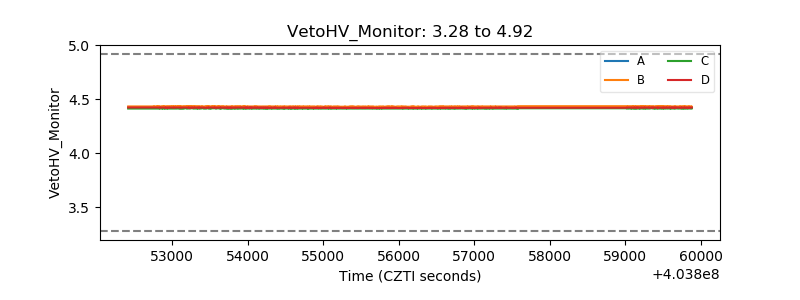 |
| Veto LLD | 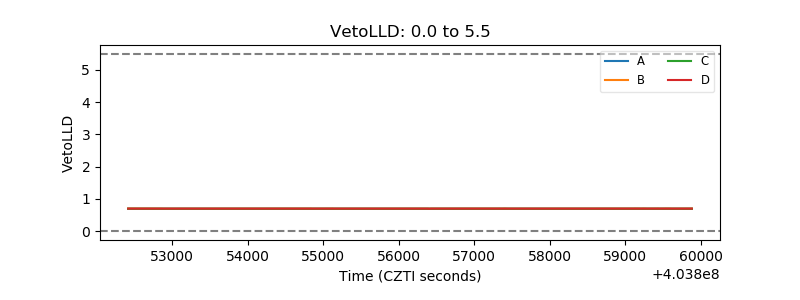 |
| Alpha Counter | 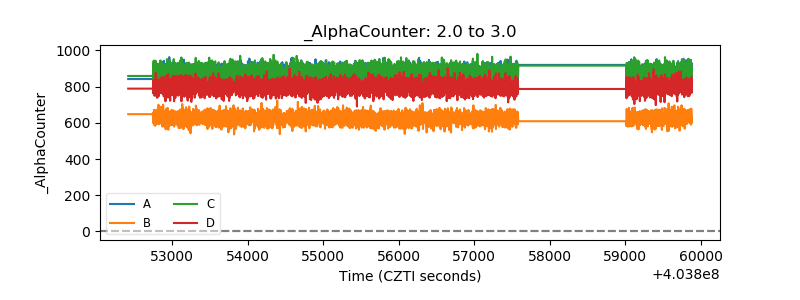 |
| _CPM_Rate | 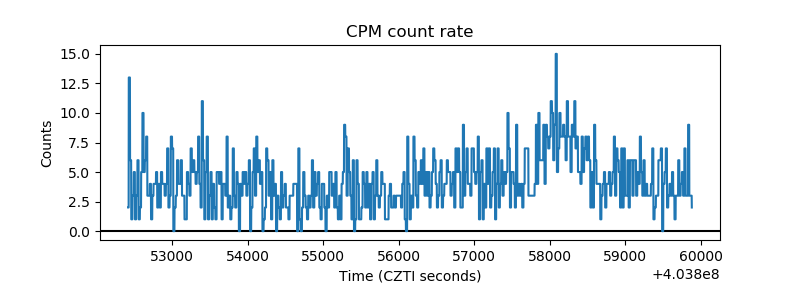 |
| CZT Counter | 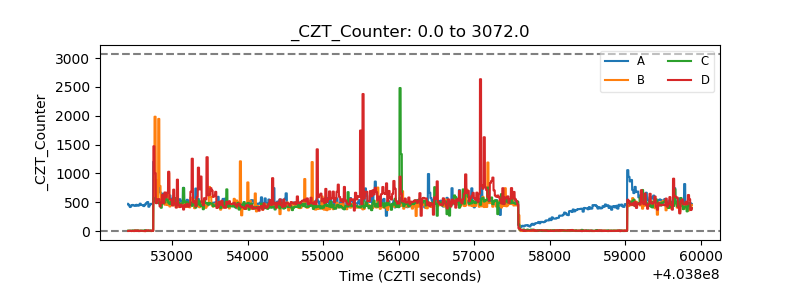 |
| +2.5 Volts monitor | 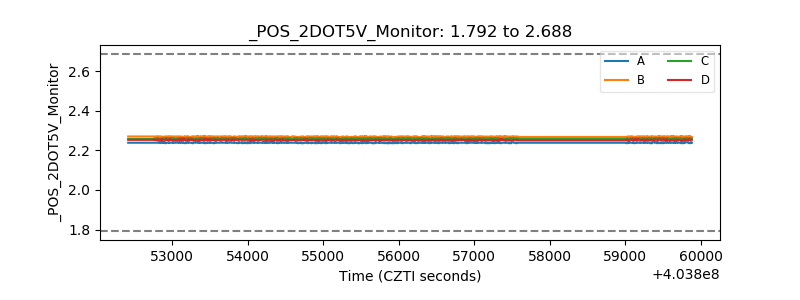 |
| +5 Volts monitor | 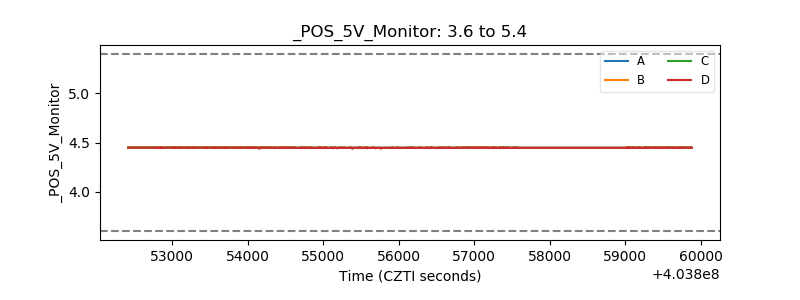 |
| _ROLL_ROT | 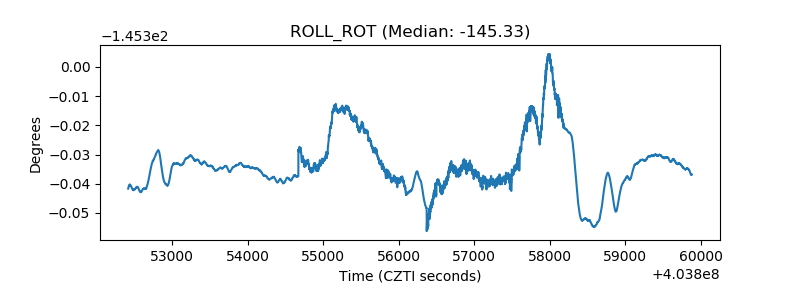 |
| _Roll_DEC | 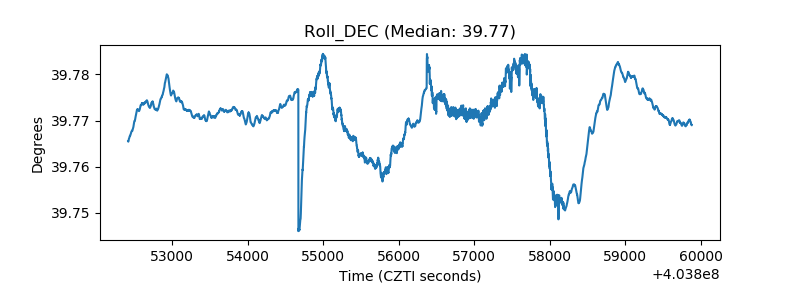 |
| _Roll_RA | 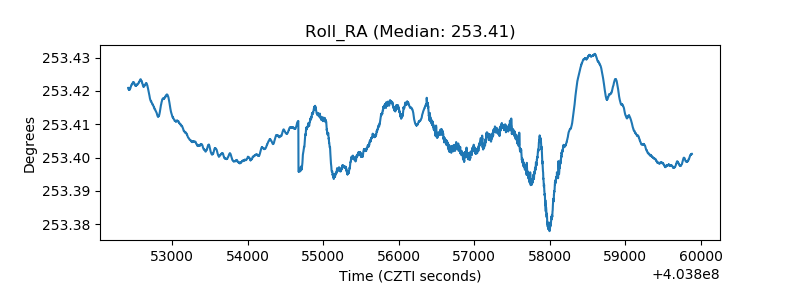 |
| Veto Counter | 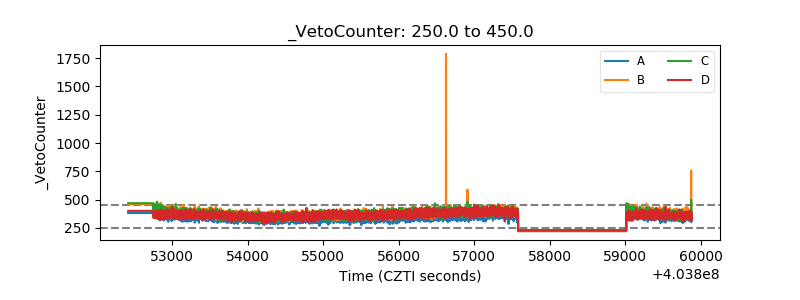 |