| Param | Original file | Final file |
|---|---|---|
| Filename | modeM0/AS1A07_145T01_9000005370_38163cztM0_level2.fits | modeM0/AS1A07_145T01_9000005370_38163cztM0_level2_quad_clean.evt |
| Size (bytes) | 370,612,800 | 99,097,920 |
| Size | 353.4 MB | 94.5 MB |
| Events in quadrant A | 3,114,061 | 670,868 |
| Events in quadrant B | 2,720,380 | 683,654 |
| Events in quadrant C | 2,756,019 | 647,658 |
| Events in quadrant D | 4,671,485 | 587,804 |
| Mode M9 | |||
|---|---|---|---|
| Quadrant | BADHDUFLAG | Total packets | Discarded packets |
| A | 0 | 17 | 0 |
| B | 0 | 17 | 0 |
| C | 0 | 17 | 0 |
| D | 0 | 18 | 0 |
| Mode SS | |||
|---|---|---|---|
| Quadrant | BADHDUFLAG | Total packets | Discarded packets |
| A | 0 | 120 | 0 |
| B | 0 | 120 | 0 |
| C | 0 | 120 | 0 |
| D | 0 | 120 | 0 |
| Mode M0 | |||
|---|---|---|---|
| Quadrant | BADHDUFLAG | Total packets | Discarded packets |
| A | 0 | 12728 | 3 |
| B | 0 | 12099 | 2 |
| C | 0 | 11823 | 2 |
| D | 0 | 17894 | 2 |
| Quadrant | Total seconds | Saturated seconds | Saturation percentage |
|---|---|---|---|
| A | 5872 | 15 | 0.255450% |
| B | 5872 | 21 | 0.357629% |
| C | 5872 | 5 | 0.085150% |
| D | 5872 | 208 | 3.542234% |
Noise dominated data is calculated using 1-second bins in cleaned event files. If a bin has >2000 counts, and if more than 50% of those come from <1% of pixels, then it is considered to be noise-dominated and hence unusable.
| Quadrant | # 1 sec bins | Bins with >0 counts | Bins with >2000 counts | High rate bins dominated by noise | Noise dominated (total time) | Noise dominated (detector-on time) | Marked lightcurve |
|---|---|---|---|---|---|---|---|
| A | 7185 | 5873 | 4 | 4 | 0.06% | 0.07% | 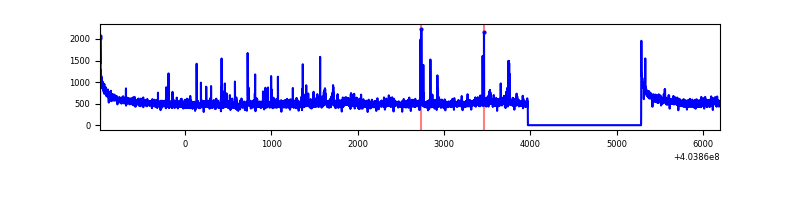 |
| B | 7185 | 5873 | 8 | 8 | 0.11% | 0.14% | 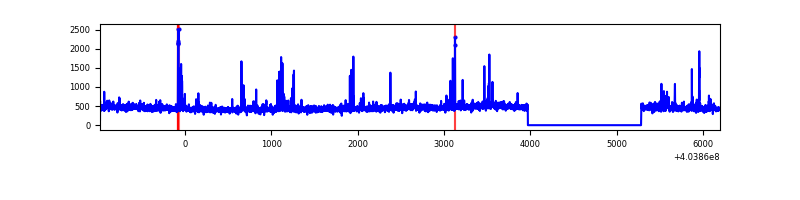 |
| C | 7185 | 5873 | 2 | 2 | 0.03% | 0.03% | 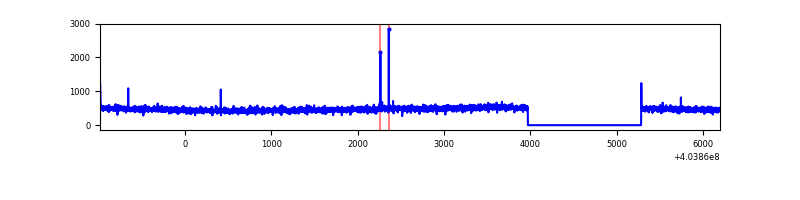 |
| D | 7185 | 5873 | 190 | 190 | 2.64% | 3.24% | 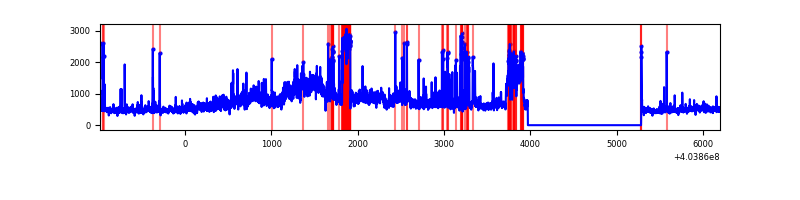 |
Top three noisy pixels from each quadrant. If the there are fewer than three noisy pixels in the level2.evt file, extra rows are filled as -1
| Pixel properties | Quadrant properties | ||||||
|---|---|---|---|---|---|---|---|
| Quadrant | DetID | PixID | Counts | Sigma | Mean | Median | Sigma |
| A | 10 | 83 | 397240 | 2973.55 | 660 | 648 | 133.4 |
| A | 9 | 143 | 73160 | 543.68 | 660 | 648 | 133.4 |
| A | 12 | 189 | 65491 | 486.18 | 660 | 648 | 133.4 |
| B | 5 | 172 | 70999 | 555.91 | 653 | 636 | 126.6 |
| B | 4 | 171 | 40385 | 314.04 | 653 | 636 | 126.6 |
| B | 15 | 85 | 24279 | 186.79 | 653 | 636 | 126.6 |
| C | 15 | 214 | 243016 | 1631.98 | 639 | 644 | 148.5 |
| C | 5 | 250 | 7172 | 43.96 | 639 | 644 | 148.5 |
| C | 3 | 233 | 6933 | 42.35 | 639 | 644 | 148.5 |
| D | 12 | 235 | 1269488 | 8173.65 | 635 | 616 | 155.2 |
| D | 7 | 38 | 415240 | 2670.87 | 635 | 616 | 155.2 |
| D | 1 | 52 | 245934 | 1580.25 | 635 | 616 | 155.2 |
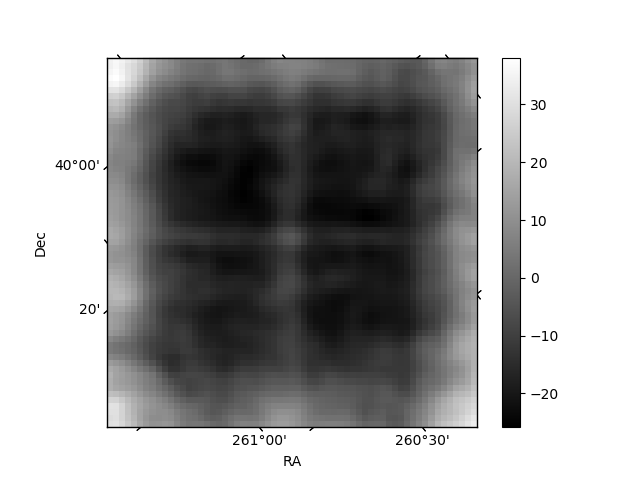
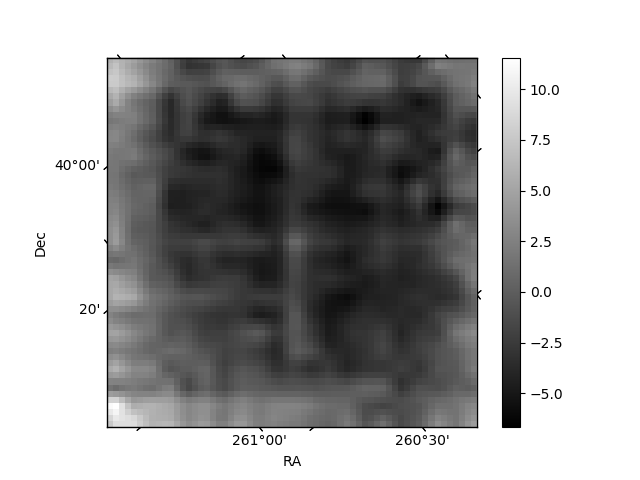
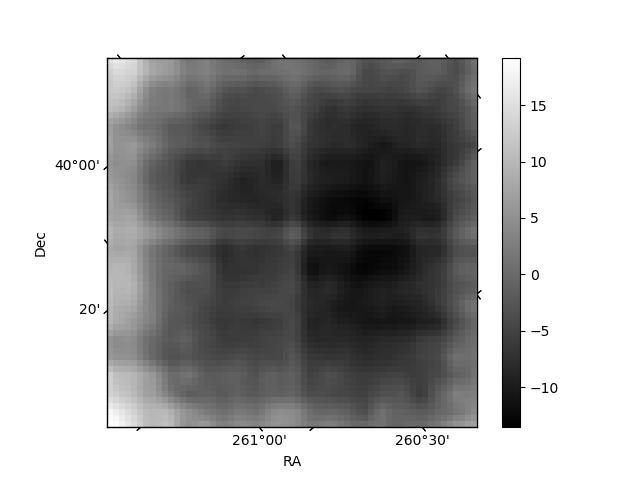
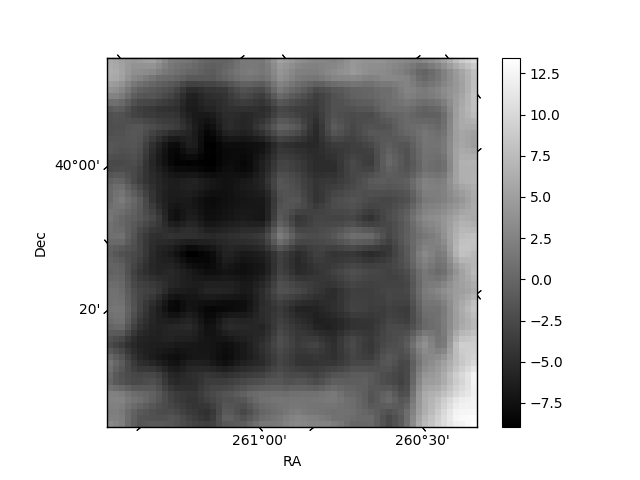
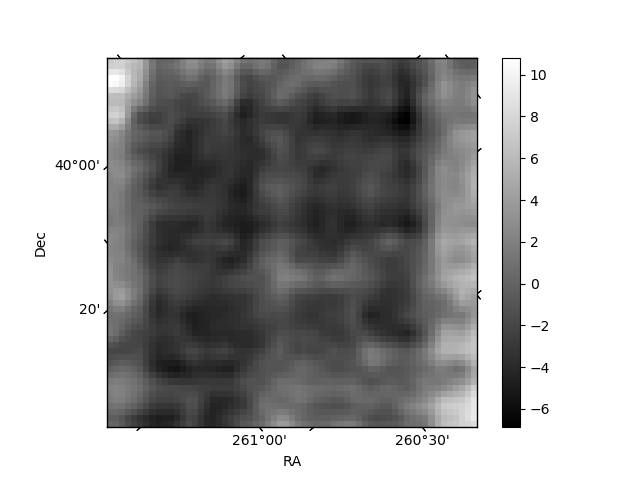
Histogram calculated using DETX and DETY for each event in the final _common_clean file
| Quadrant A | 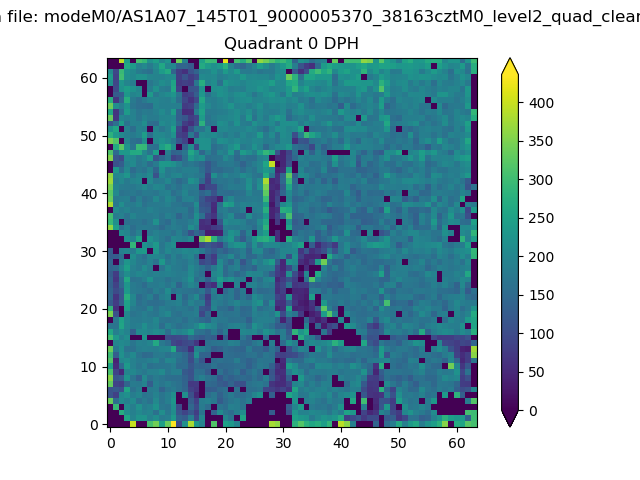 |
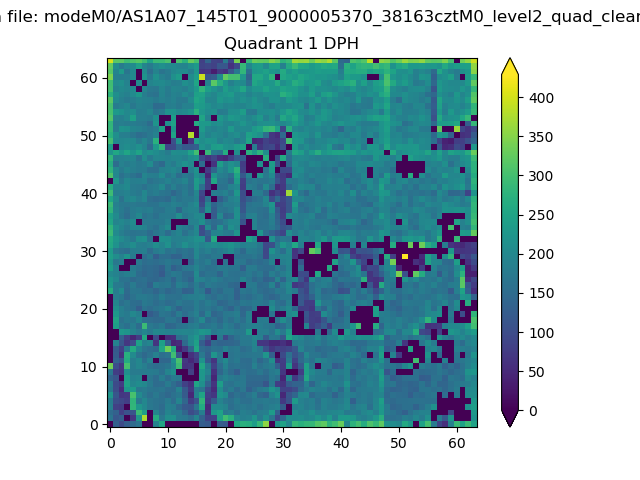 |
Quadrant B |
|---|---|---|---|
| Quadrant D | 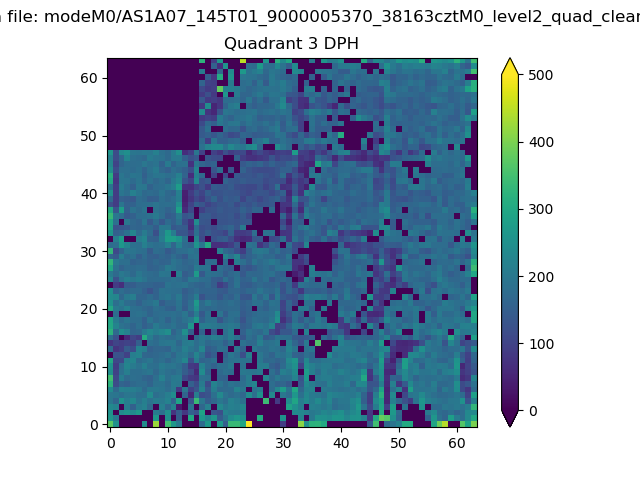 |
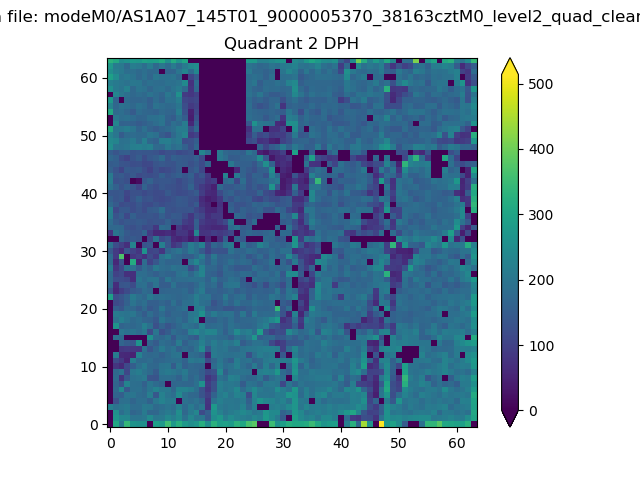 |
Quadrant C |
| Plot type | Count rate plots | Images |
|---|---|---|
| Comparison with Poisson distribution Blue bars denote a histogram of data divided into 1 sec bins. Red curve is a Poisson curve with rate = median count rate of data. |
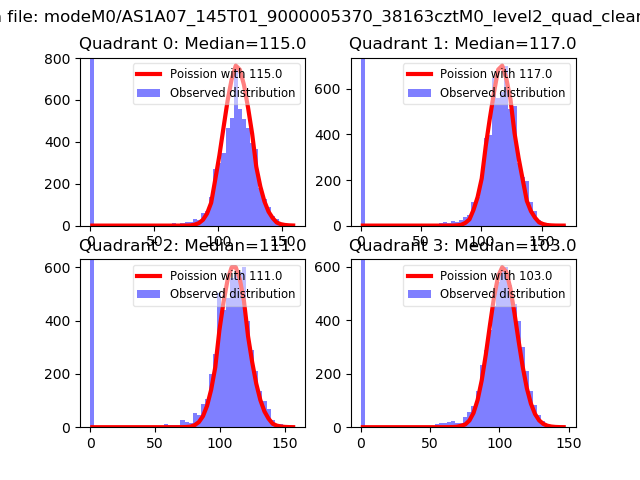 |
 |
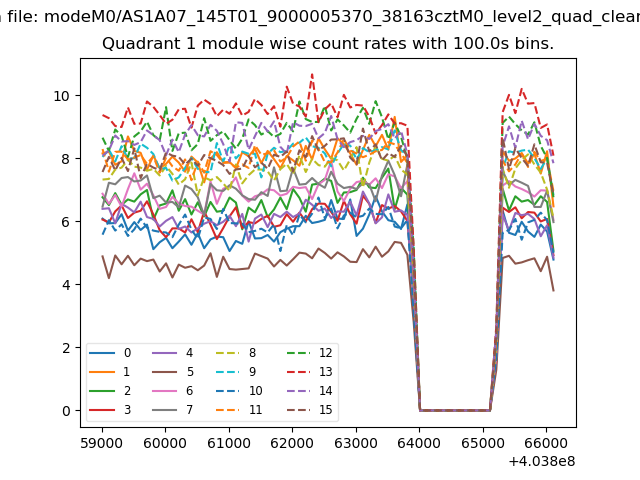
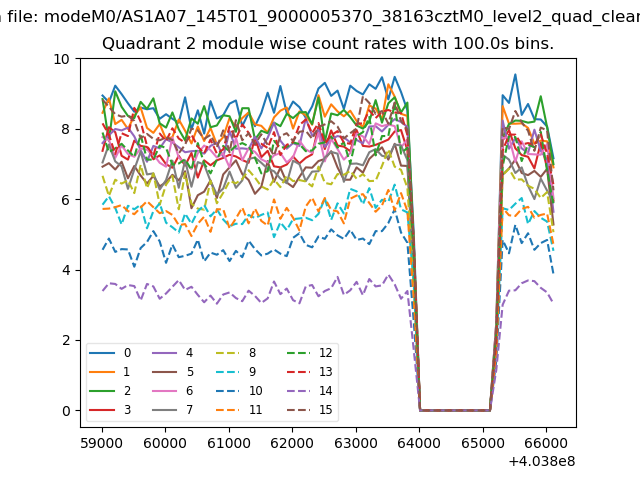
| Quadrant-wise count rates Data is divided into 100 sec bins |
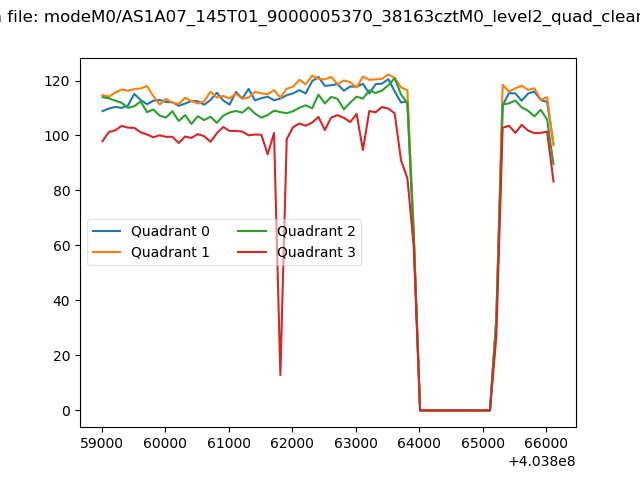 |
|
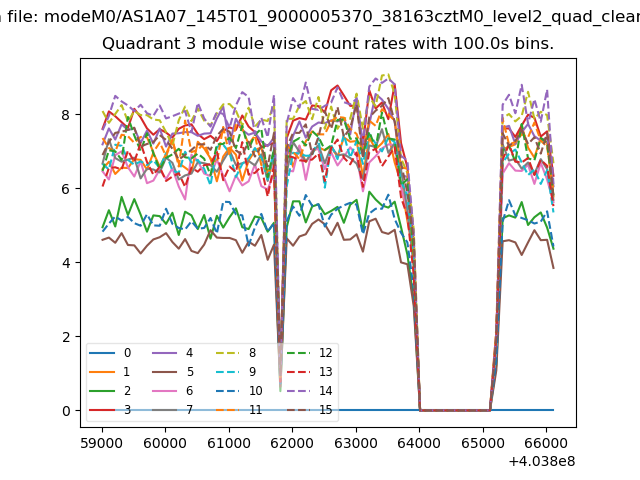
| Module-wise count rates for Quadrant A Data is divided into 100 sec bins |
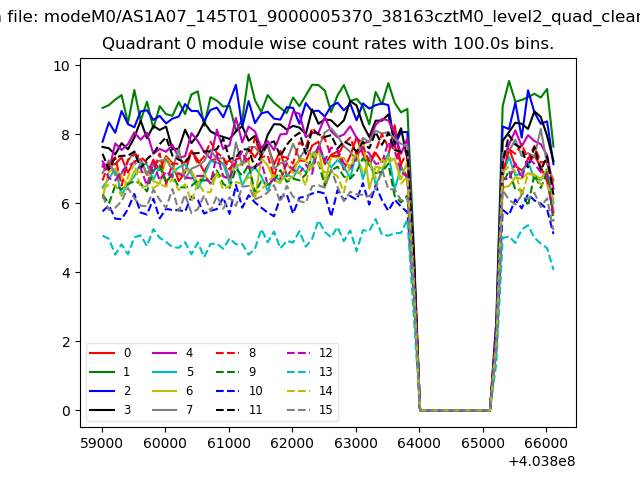 |
 |
| Module-wise count rates for Quadrant B Data is divided into 100 sec bins |
 |
 |
| Module-wise count rates for Quadrant C Data is divided into 100 sec bins |
 |
 |
| Module-wise count rates for Quadrant D Data is divided into 100 sec bins |
 |
 |
| Parameter | Plot |
|---|---|
| CZT HV Monitor | 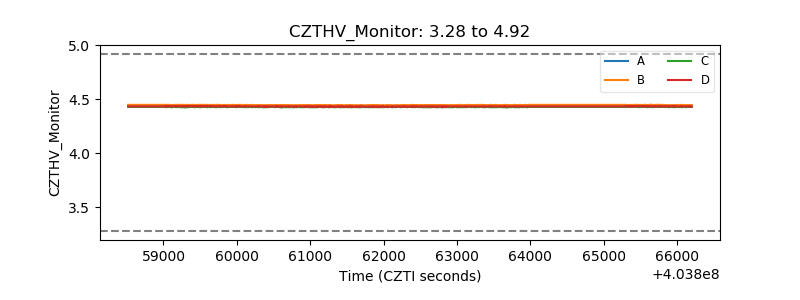 |
| D_VDD | 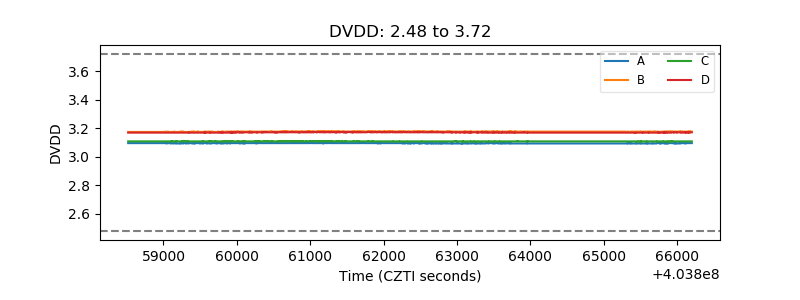 |
| Temperature 1 | 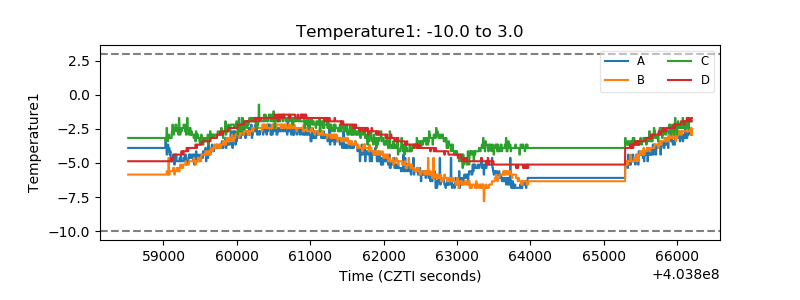 |
| Veto HV Monitor | 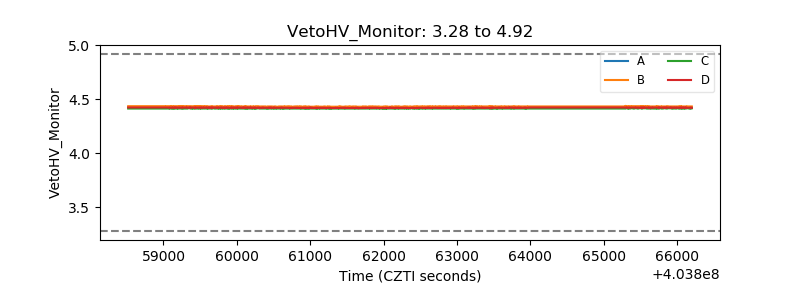 |
| Veto LLD | 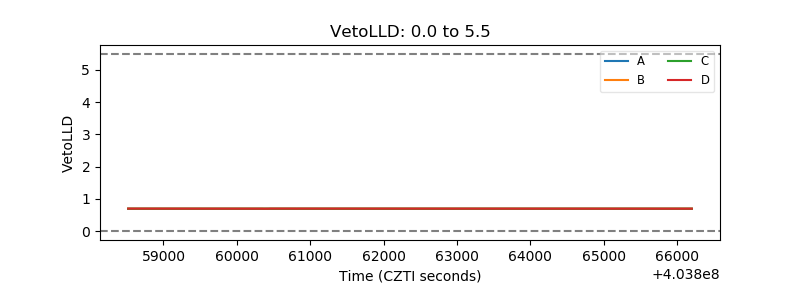 |
| Alpha Counter | 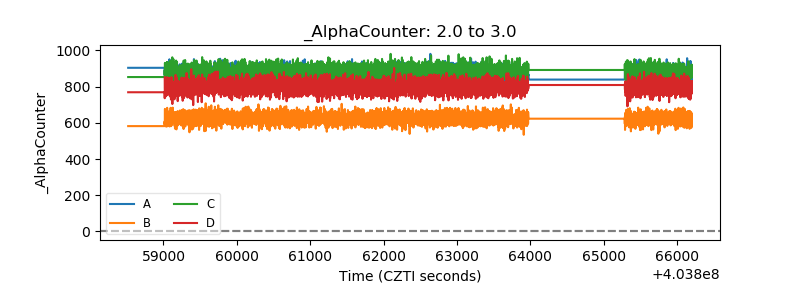 |
| _CPM_Rate | 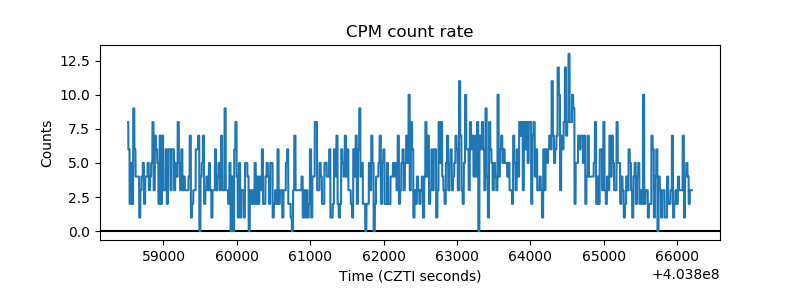 |
| CZT Counter | 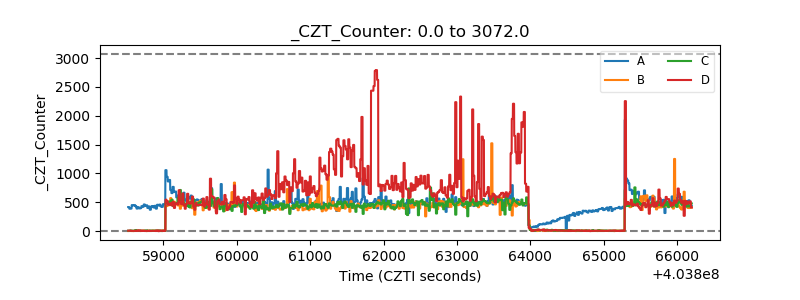 |
| +2.5 Volts monitor | 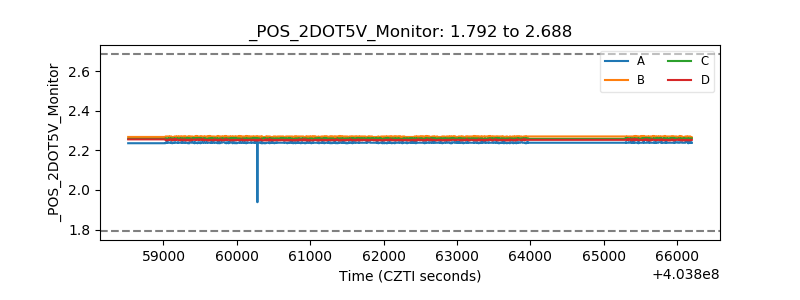 |
| +5 Volts monitor | 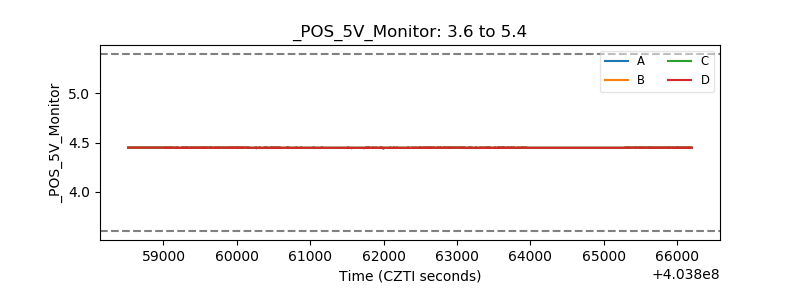 |
| _ROLL_ROT | 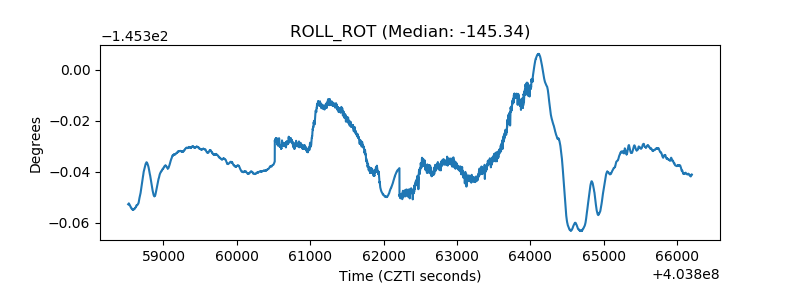 |
| _Roll_DEC |  |
| _Roll_RA | 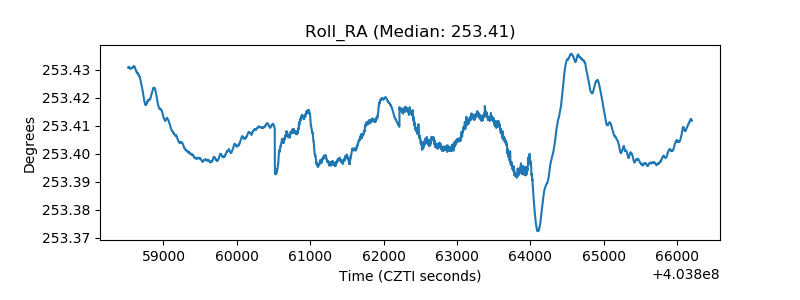 |
| Veto Counter | 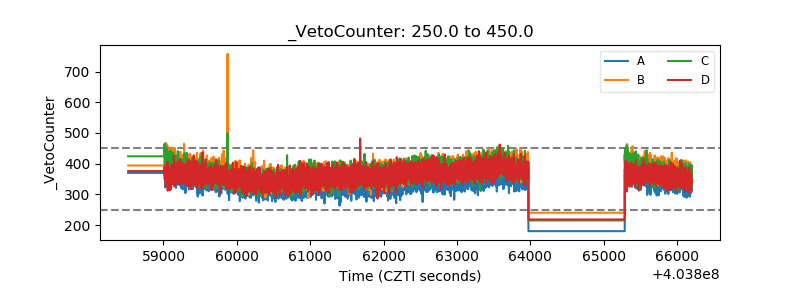 |