| Param | Original file | Final file |
|---|---|---|
| Filename | modeM0/AS1A07_145T01_9000005370_38167cztM0_level2.fits | modeM0/AS1A07_145T01_9000005370_38167cztM0_level2_quad_clean.evt |
| Size (bytes) | 329,866,560 | 93,441,600 |
| Size | 314.6 MB | 89.1 MB |
| Events in quadrant A | 2,901,158 | 630,235 |
| Events in quadrant B | 2,711,545 | 639,860 |
| Events in quadrant C | 2,650,458 | 610,525 |
| Events in quadrant D | 3,517,234 | 562,453 |
| Mode M9 | |||
|---|---|---|---|
| Quadrant | BADHDUFLAG | Total packets | Discarded packets |
| A | 0 | 19 | 0 |
| B | 0 | 19 | 0 |
| C | 0 | 19 | 0 |
| D | 0 | 20 | 0 |
| Mode SS | |||
|---|---|---|---|
| Quadrant | BADHDUFLAG | Total packets | Discarded packets |
| A | 0 | 112 | 0 |
| B | 0 | 112 | 0 |
| C | 0 | 112 | 0 |
| D | 0 | 112 | 0 |
| Mode M0 | |||
|---|---|---|---|
| Quadrant | BADHDUFLAG | Total packets | Discarded packets |
| A | 0 | 12054 | 3 |
| B | 0 | 11757 | 2 |
| C | 0 | 11226 | 2 |
| D | 0 | 14120 | 2 |
| Quadrant | Total seconds | Saturated seconds | Saturation percentage |
|---|---|---|---|
| A | 5522 | 26 | 0.470844% |
| B | 5522 | 21 | 0.380297% |
| C | 5522 | 6 | 0.108656% |
| D | 5522 | 85 | 1.539297% |
Noise dominated data is calculated using 1-second bins in cleaned event files. If a bin has >2000 counts, and if more than 50% of those come from <1% of pixels, then it is considered to be noise-dominated and hence unusable.
| Quadrant | # 1 sec bins | Bins with >0 counts | Bins with >2000 counts | High rate bins dominated by noise | Noise dominated (total time) | Noise dominated (detector-on time) | Marked lightcurve |
|---|---|---|---|---|---|---|---|
| A | 7134 | 5523 | 13 | 13 | 0.18% | 0.24% | 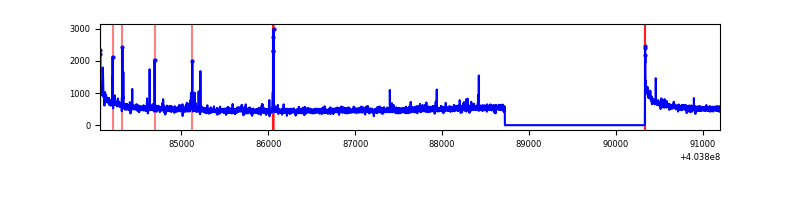 |
| B | 7134 | 5523 | 12 | 12 | 0.17% | 0.22% | 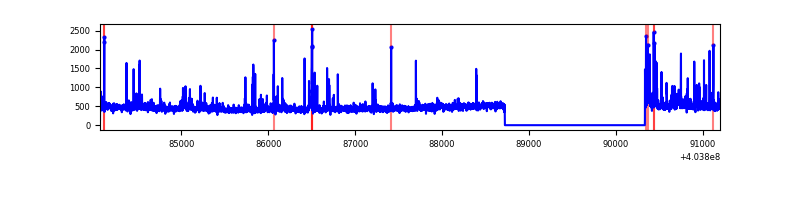 |
| C | 7134 | 5523 | 2 | 2 | 0.03% | 0.04% | 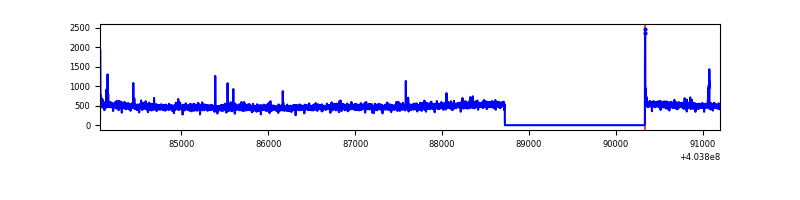 |
| D | 7134 | 5523 | 85 | 85 | 1.19% | 1.54% | 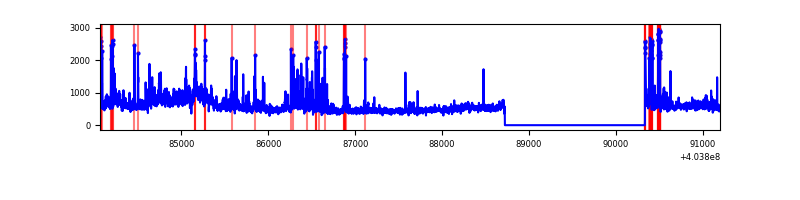 |
Top three noisy pixels from each quadrant. If the there are fewer than three noisy pixels in the level2.evt file, extra rows are filled as -1
| Pixel properties | Quadrant properties | ||||||
|---|---|---|---|---|---|---|---|
| Quadrant | DetID | PixID | Counts | Sigma | Mean | Median | Sigma |
| A | 10 | 83 | 398277 | 3149.7 | 617 | 604 | 126.3 |
| A | 9 | 143 | 41942 | 327.41 | 617 | 604 | 126.3 |
| A | 12 | 189 | 38129 | 297.21 | 617 | 604 | 126.3 |
| B | 0 | 229 | 155826 | 1318.3 | 615 | 598 | 117.7 |
| B | 5 | 172 | 36345 | 303.59 | 615 | 598 | 117.7 |
| B | 4 | 171 | 33024 | 275.38 | 615 | 598 | 117.7 |
| C | 15 | 214 | 229341 | 1611.66 | 607 | 611 | 141.9 |
| C | 0 | 10 | 15154 | 102.47 | 607 | 611 | 141.9 |
| C | 1 | 23 | 12699 | 85.17 | 607 | 611 | 141.9 |
| D | 12 | 235 | 719023 | 4825.64 | 606 | 588 | 148.9 |
| D | 10 | 199 | 113671 | 759.57 | 606 | 588 | 148.9 |
| D | 13 | 249 | 90307 | 602.63 | 606 | 588 | 148.9 |
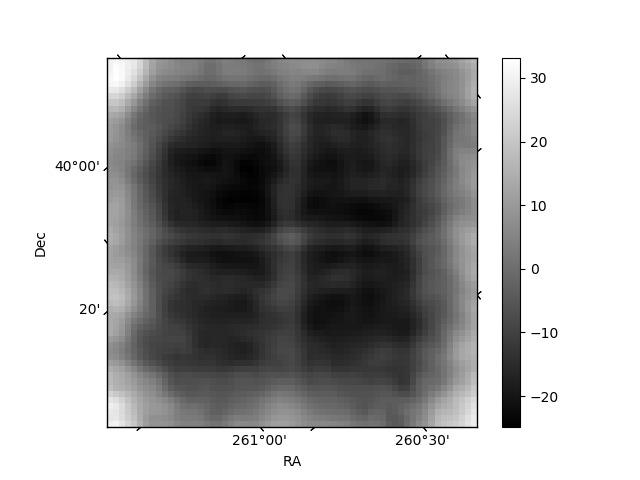
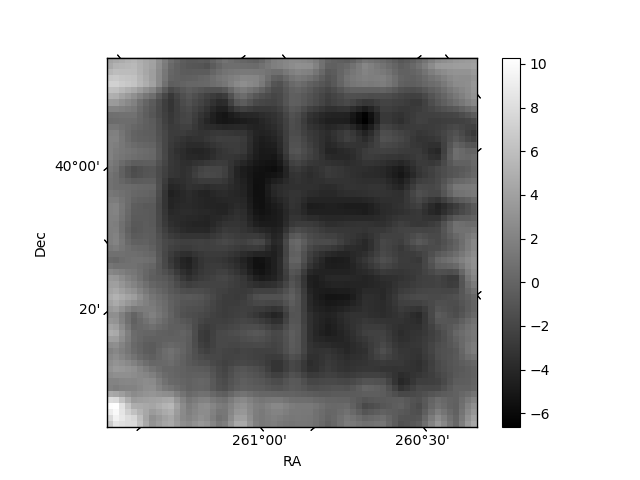
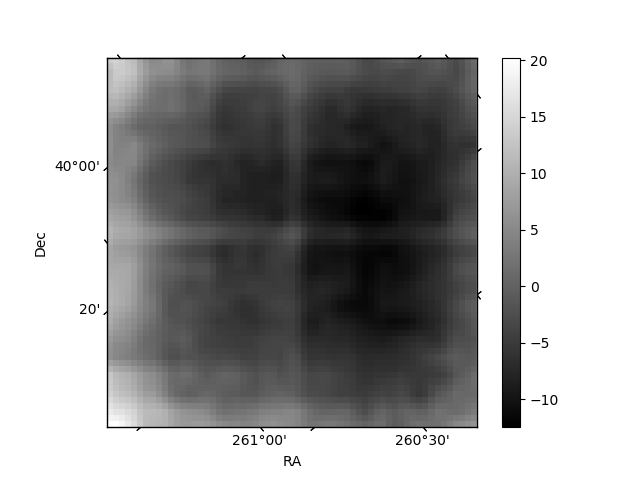
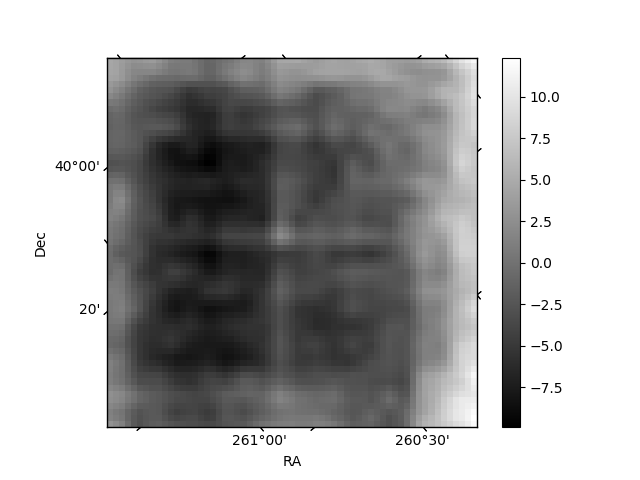
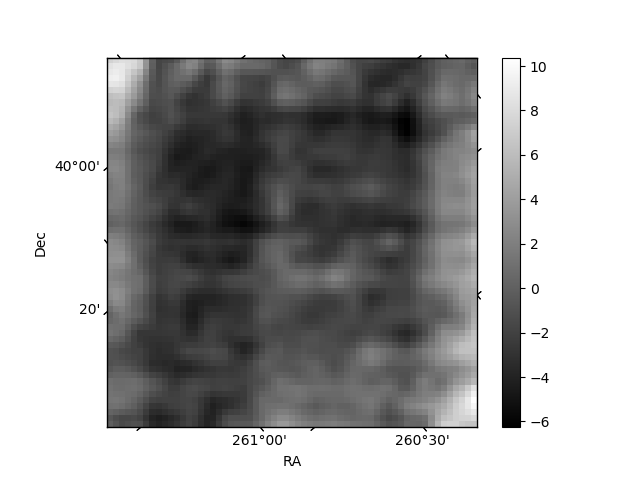
Histogram calculated using DETX and DETY for each event in the final _common_clean file
| Quadrant A | 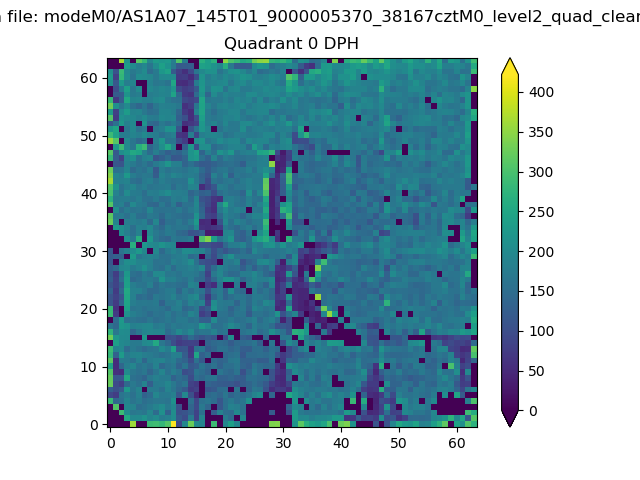 |
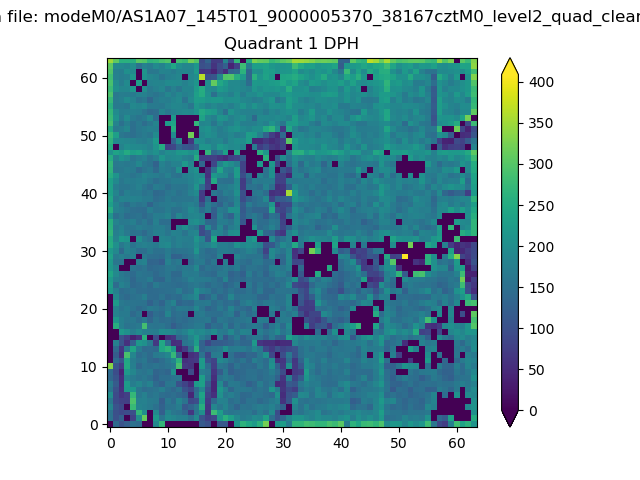 |
Quadrant B |
|---|---|---|---|
| Quadrant D | 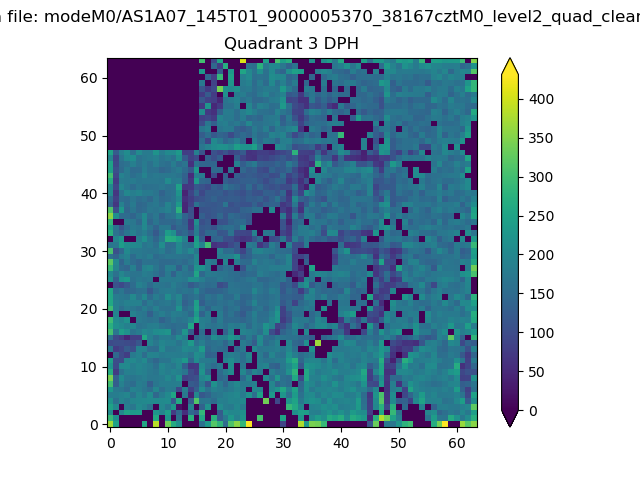 |
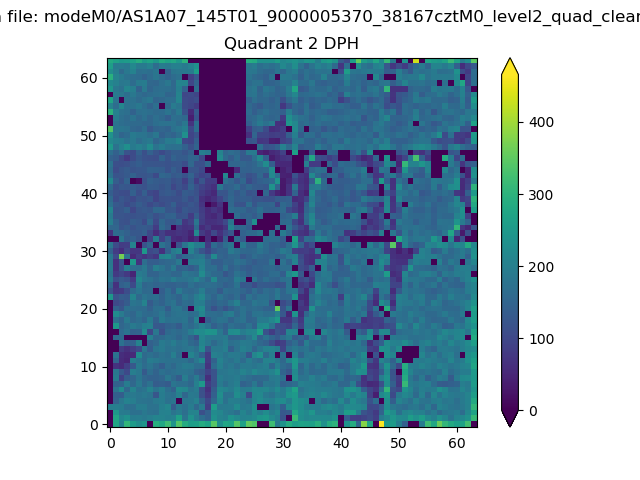 |
Quadrant C |
| Plot type | Count rate plots | Images |
|---|---|---|
| Comparison with Poisson distribution Blue bars denote a histogram of data divided into 1 sec bins. Red curve is a Poisson curve with rate = median count rate of data. |
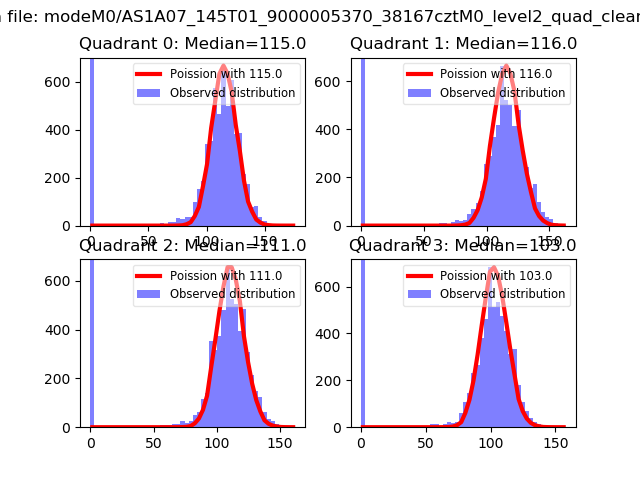 |
 |
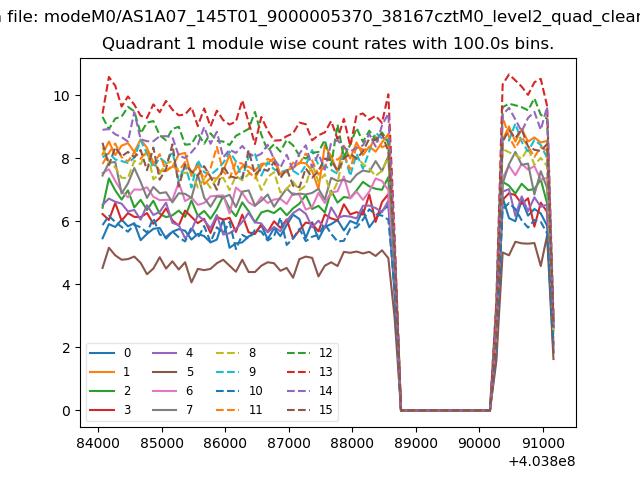
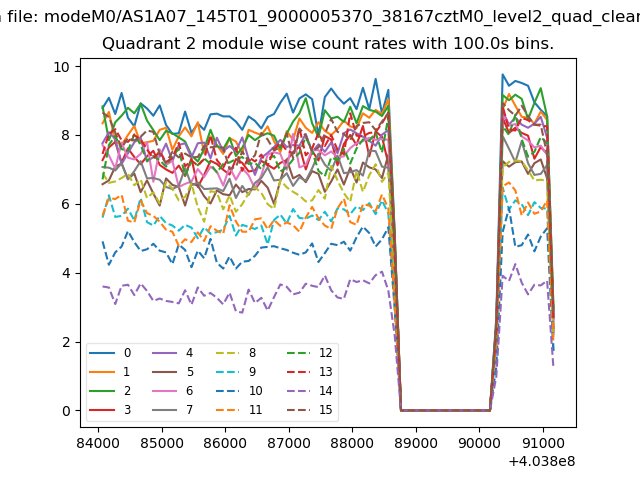
| Quadrant-wise count rates Data is divided into 100 sec bins |
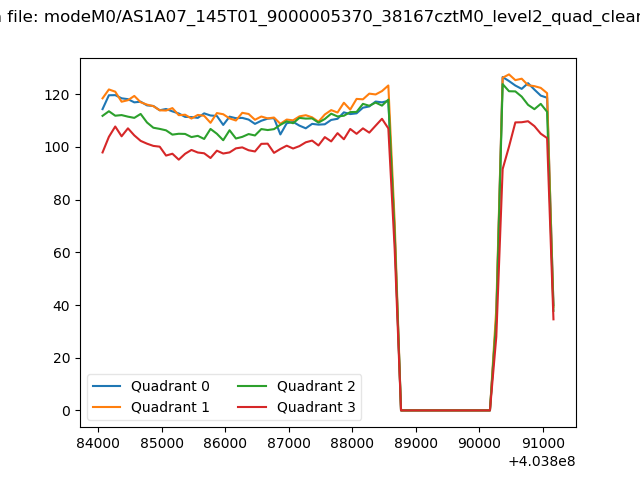 |
|
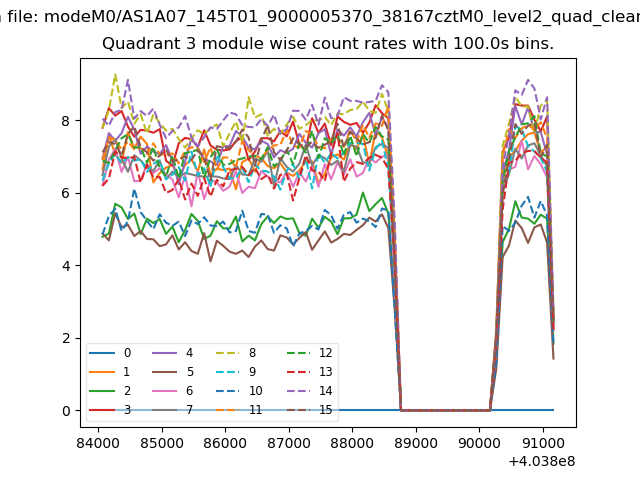
| Module-wise count rates for Quadrant A Data is divided into 100 sec bins |
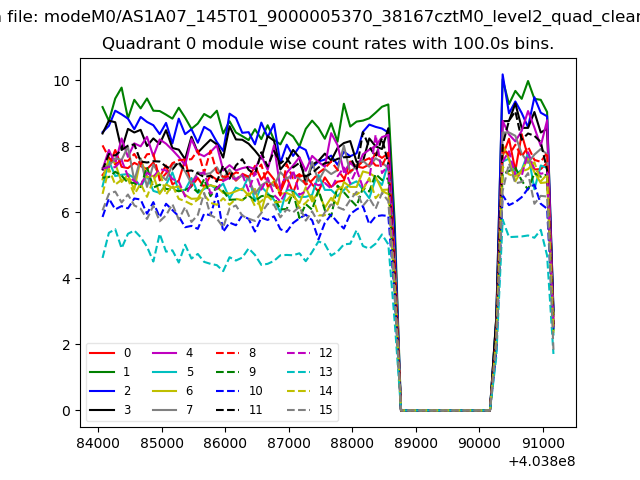 |
 |
| Module-wise count rates for Quadrant B Data is divided into 100 sec bins |
 |
 |
| Module-wise count rates for Quadrant C Data is divided into 100 sec bins |
 |
 |
| Module-wise count rates for Quadrant D Data is divided into 100 sec bins |
 |
 |
| Parameter | Plot |
|---|---|
| CZT HV Monitor |  |
| D_VDD | 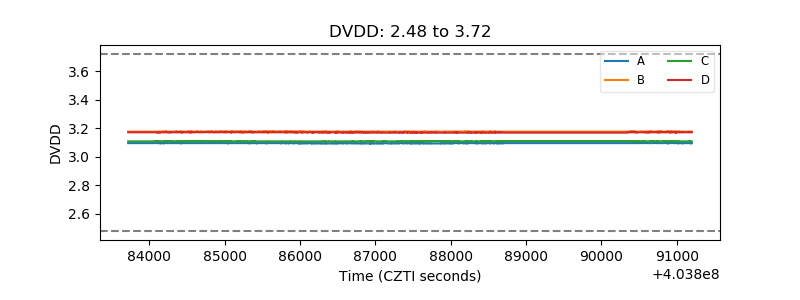 |
| Temperature 1 | 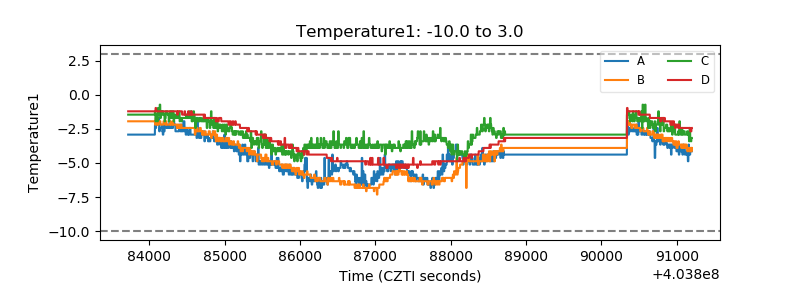 |
| Veto HV Monitor | 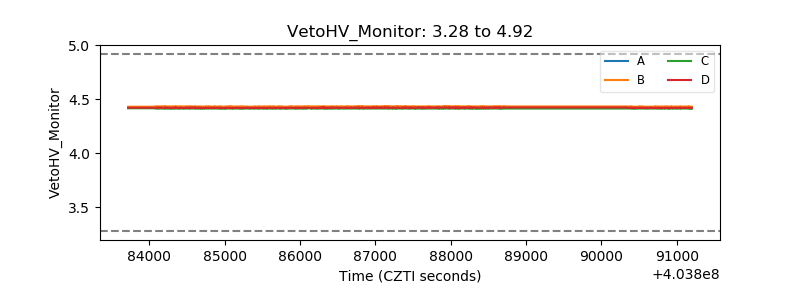 |
| Veto LLD | 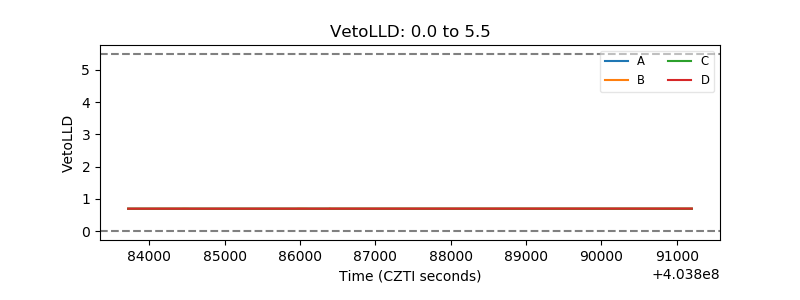 |
| Alpha Counter | 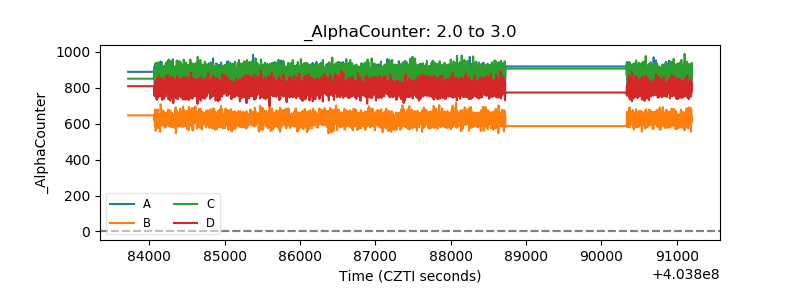 |
| _CPM_Rate | 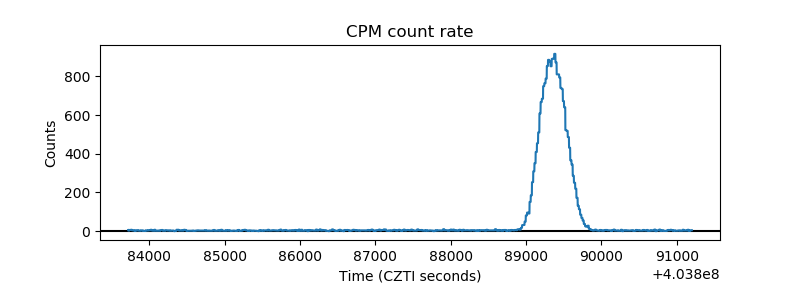 |
| CZT Counter | 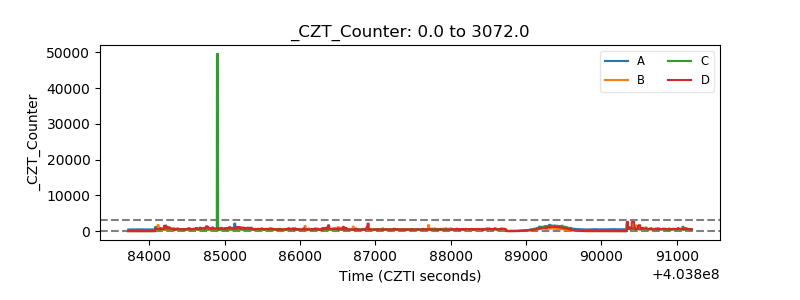 |
| +2.5 Volts monitor | 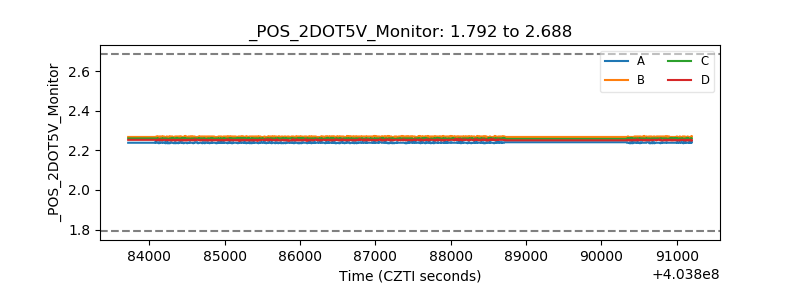 |
| +5 Volts monitor | 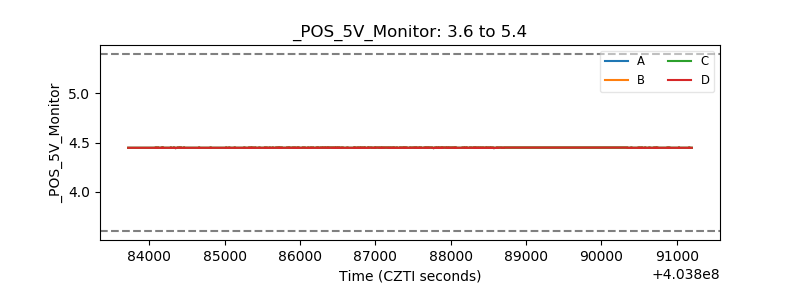 |
| _ROLL_ROT | 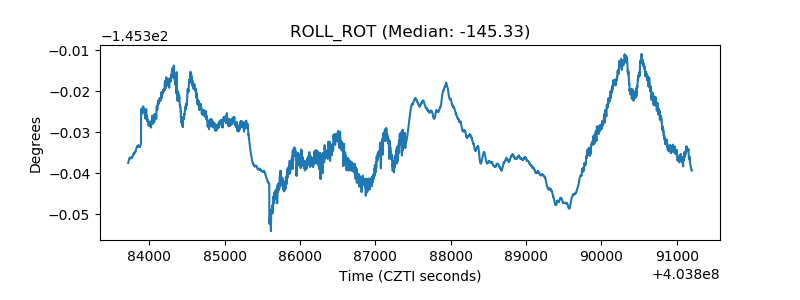 |
| _Roll_DEC | 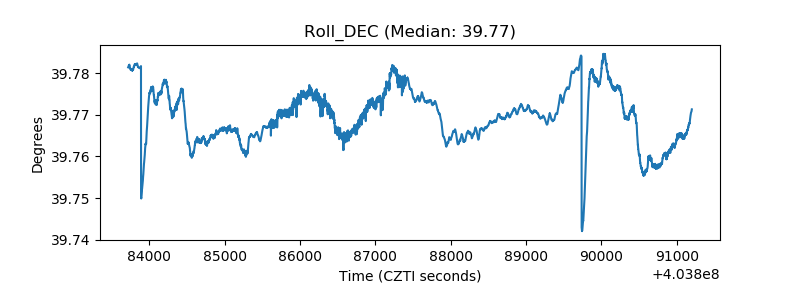 |
| _Roll_RA | 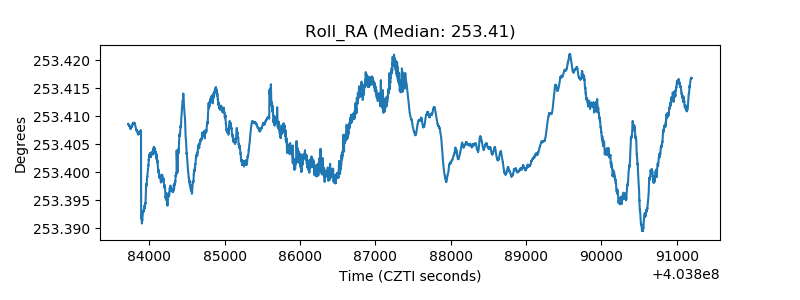 |
| Veto Counter | 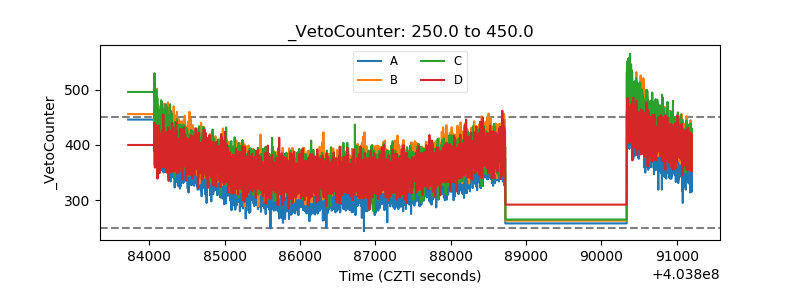 |