| Param | Original file | Final file |
|---|---|---|
| Filename | modeM0/AS1A07_145T01_9000005370_38169cztM0_level2.fits | modeM0/AS1A07_145T01_9000005370_38169cztM0_level2_quad_clean.evt |
| Size (bytes) | 335,088,000 | 93,579,840 |
| Size | 319.6 MB | 89.2 MB |
| Events in quadrant A | 2,842,128 | 633,832 |
| Events in quadrant B | 2,724,809 | 644,360 |
| Events in quadrant C | 2,678,789 | 621,407 |
| Events in quadrant D | 3,737,102 | 555,535 |
| Mode M9 | |||
|---|---|---|---|
| Quadrant | BADHDUFLAG | Total packets | Discarded packets |
| A | 0 | 21 | 0 |
| B | 0 | 21 | 0 |
| C | 0 | 21 | 0 |
| D | 0 | 22 | 0 |
| Mode SS | |||
|---|---|---|---|
| Quadrant | BADHDUFLAG | Total packets | Discarded packets |
| A | 0 | 110 | 0 |
| B | 0 | 110 | 0 |
| C | 0 | 110 | 0 |
| D | 0 | 110 | 0 |
| Mode M0 | |||
|---|---|---|---|
| Quadrant | BADHDUFLAG | Total packets | Discarded packets |
| A | 0 | 11899 | 65 |
| B | 0 | 11824 | 54 |
| C | 0 | 11211 | 29 |
| D | 0 | 14959 | 213 |
| Quadrant | Total seconds | Saturated seconds | Saturation percentage |
|---|---|---|---|
| A | 5403 | 15 | 0.277624% |
| B | 5412 | 38 | 0.702143% |
| C | 5422 | 8 | 0.147547% |
| D | 5378 | 215 | 3.997769% |
Noise dominated data is calculated using 1-second bins in cleaned event files. If a bin has >2000 counts, and if more than 50% of those come from <1% of pixels, then it is considered to be noise-dominated and hence unusable.
| Quadrant | # 1 sec bins | Bins with >0 counts | Bins with >2000 counts | High rate bins dominated by noise | Noise dominated (total time) | Noise dominated (detector-on time) | Marked lightcurve |
|---|---|---|---|---|---|---|---|
| A | 7174 | 5430 | 10 | 10 | 0.14% | 0.18% | 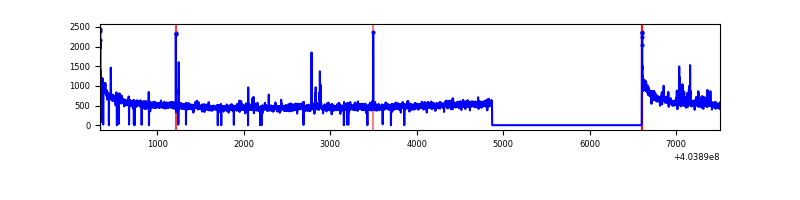 |
| B | 7174 | 5432 | 22 | 22 | 0.31% | 0.41% | 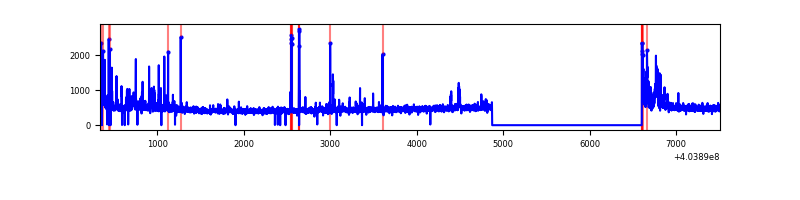 |
| C | 7174 | 5436 | 5 | 5 | 0.07% | 0.09% | 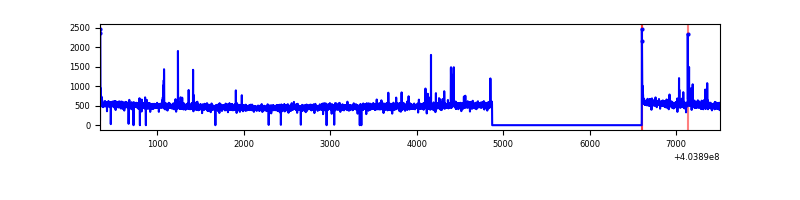 |
| D | 7174 | 5415 | 236 | 236 | 3.29% | 4.36% | 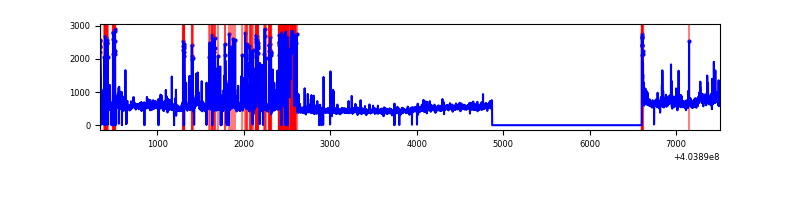 |
Top three noisy pixels from each quadrant. If the there are fewer than three noisy pixels in the level2.evt file, extra rows are filled as -1
| Pixel properties | Quadrant properties | ||||||
|---|---|---|---|---|---|---|---|
| Quadrant | DetID | PixID | Counts | Sigma | Mean | Median | Sigma |
| A | 10 | 83 | 386363 | 3110.43 | 612 | 599 | 124.0 |
| A | 7 | 3 | 26596 | 209.61 | 612 | 599 | 124.0 |
| A | 9 | 143 | 18350 | 143.13 | 612 | 599 | 124.0 |
| B | 0 | 229 | 128858 | 1084.96 | 615 | 598 | 118.2 |
| B | 4 | 171 | 86279 | 724.78 | 615 | 598 | 118.2 |
| B | 5 | 172 | 35549 | 295.65 | 615 | 598 | 118.2 |
| C | 15 | 214 | 226392 | 1581.36 | 608 | 612 | 142.8 |
| C | 1 | 23 | 41448 | 286.01 | 608 | 612 | 142.8 |
| C | 0 | 10 | 18697 | 126.66 | 608 | 612 | 142.8 |
| D | 12 | 233 | 641698 | 4428.46 | 593 | 578 | 144.8 |
| D | 12 | 235 | 470667 | 3247.08 | 593 | 578 | 144.8 |
| D | 10 | 199 | 85201 | 584.52 | 593 | 578 | 144.8 |
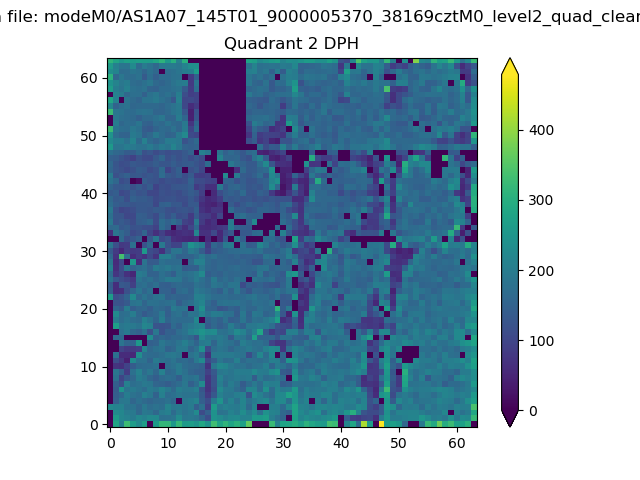
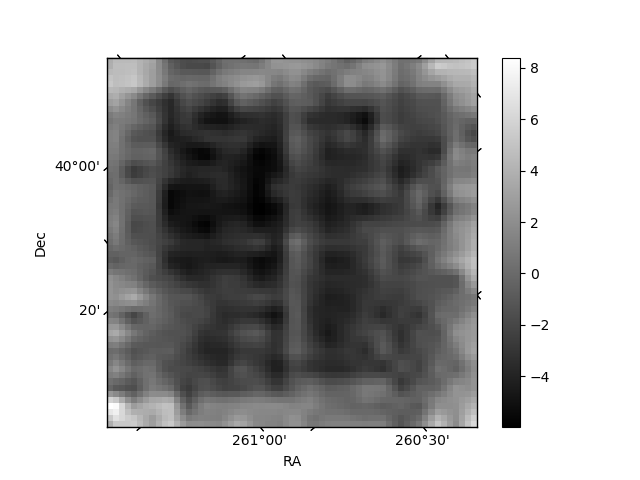
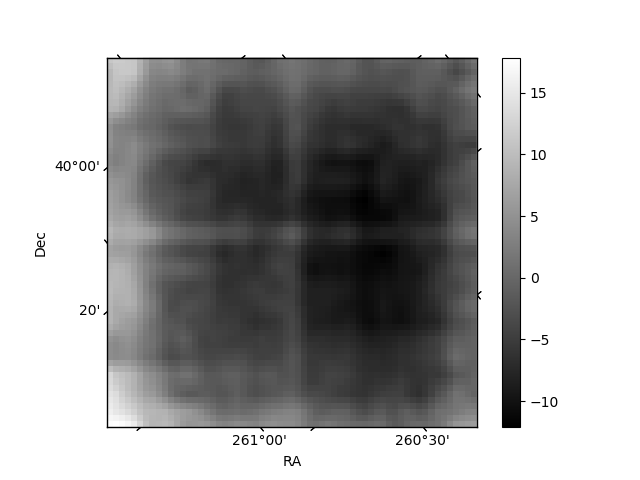
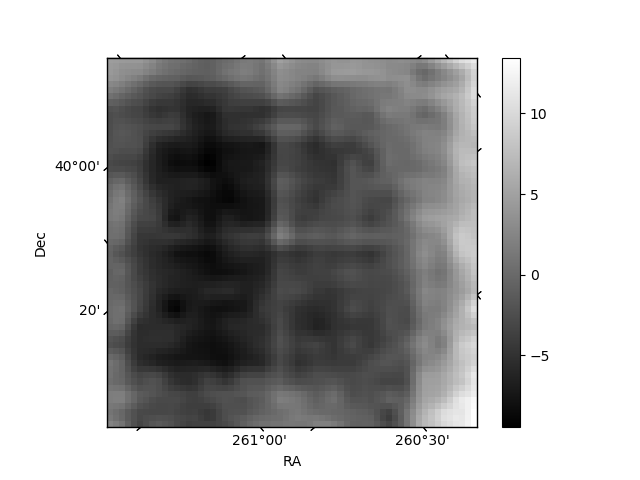
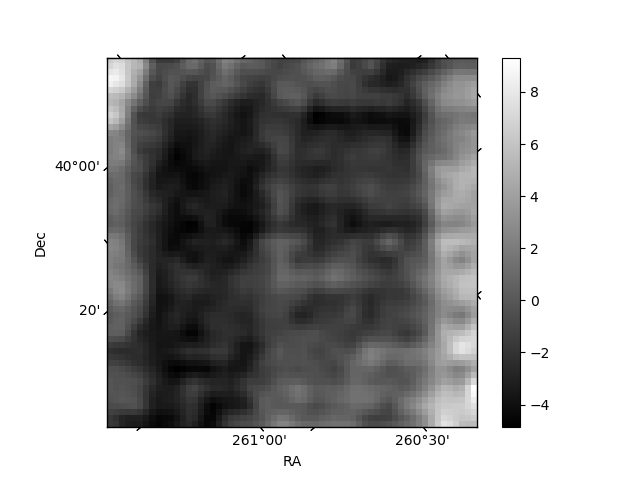
Histogram calculated using DETX and DETY for each event in the final _common_clean file
| Quadrant A |  |
 |
Quadrant B |
|---|---|---|---|
| Quadrant D | 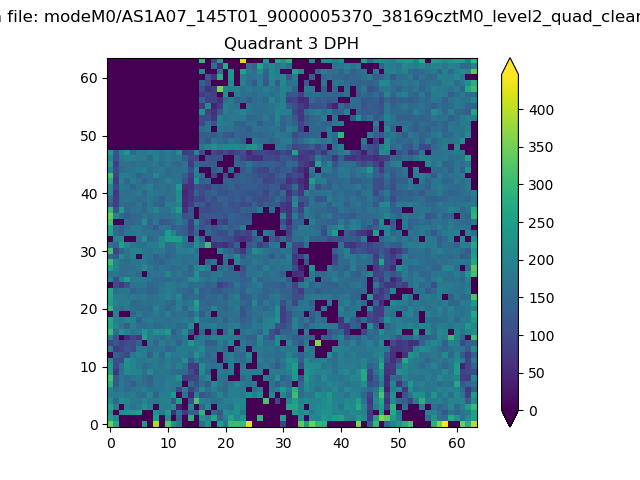 |
 |
Quadrant C |
| Plot type | Count rate plots | Images |
|---|---|---|
| Comparison with Poisson distribution Blue bars denote a histogram of data divided into 1 sec bins. Red curve is a Poisson curve with rate = median count rate of data. |
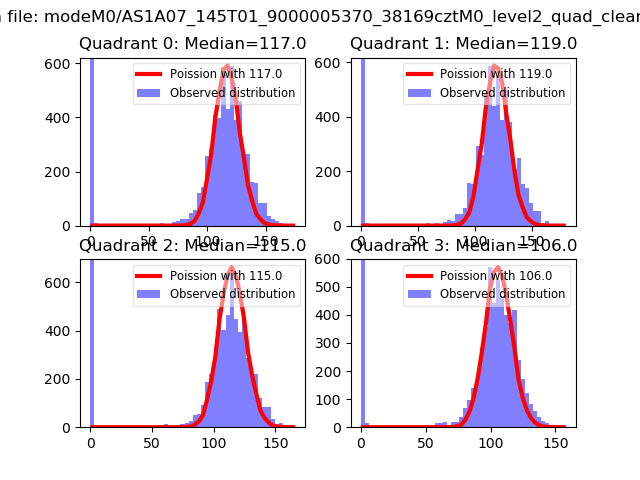 |
 |
| Quadrant-wise count rates Data is divided into 100 sec bins |
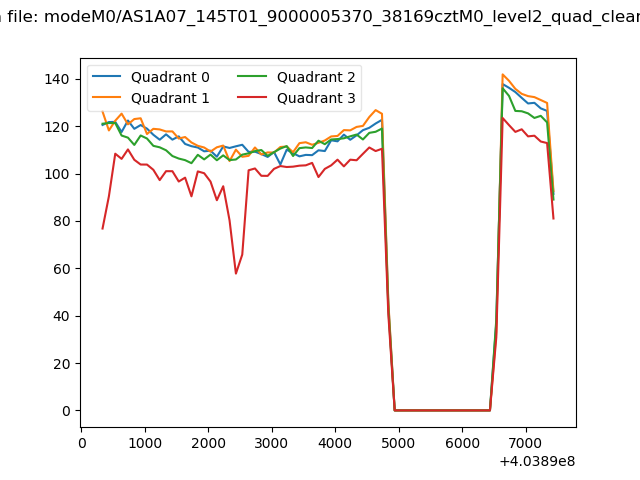 |
|
| Module-wise count rates for Quadrant A Data is divided into 100 sec bins |
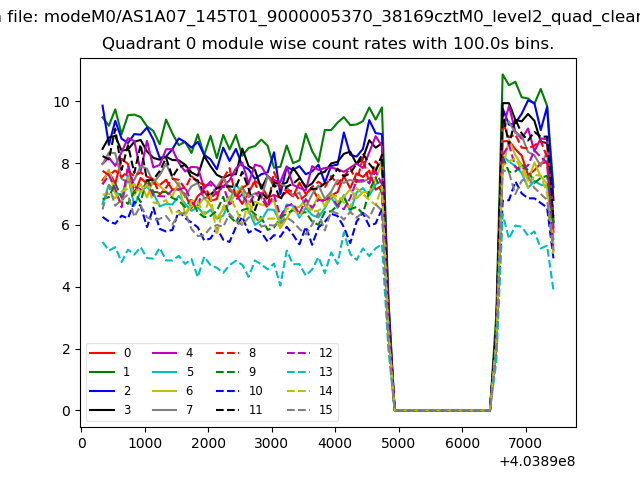 |
 |
| Module-wise count rates for Quadrant B Data is divided into 100 sec bins |
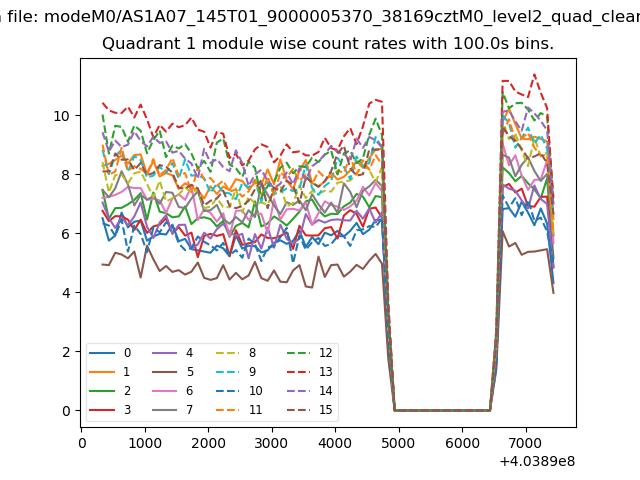 |
 |
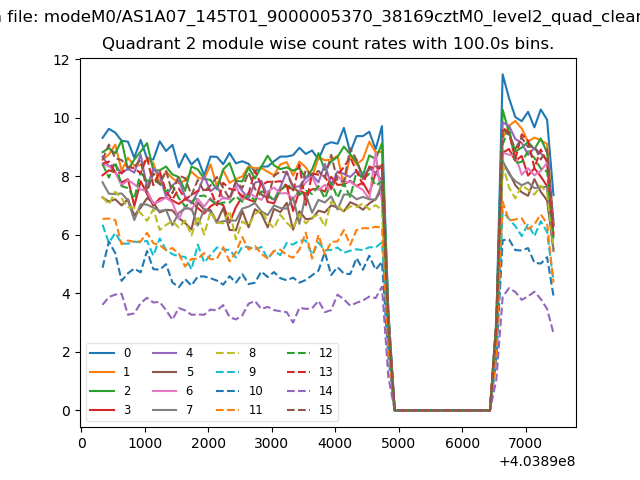
| Module-wise count rates for Quadrant C Data is divided into 100 sec bins |
 |
 |
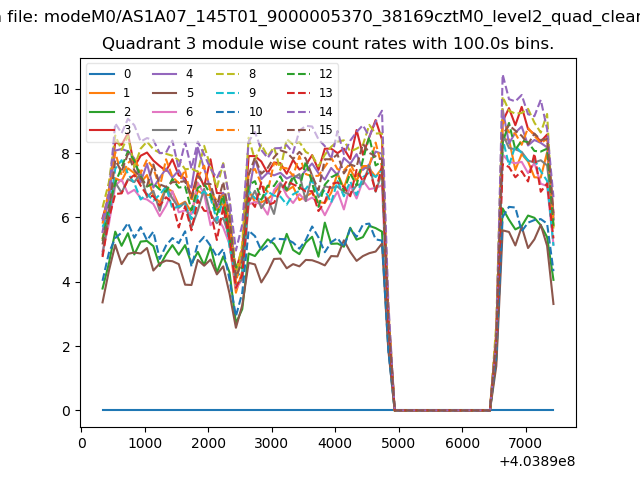
| Module-wise count rates for Quadrant D Data is divided into 100 sec bins |
 |
 |
| Parameter | Plot |
|---|---|
| CZT HV Monitor | 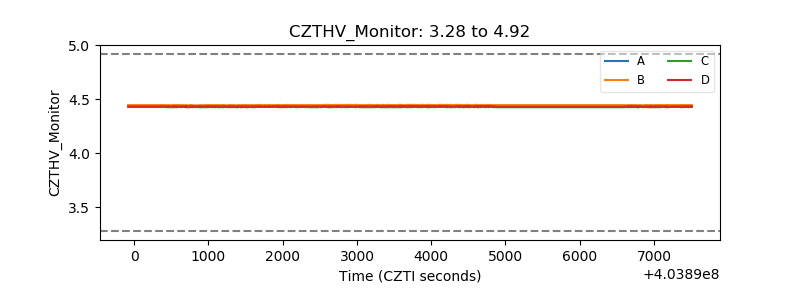 |
| D_VDD | 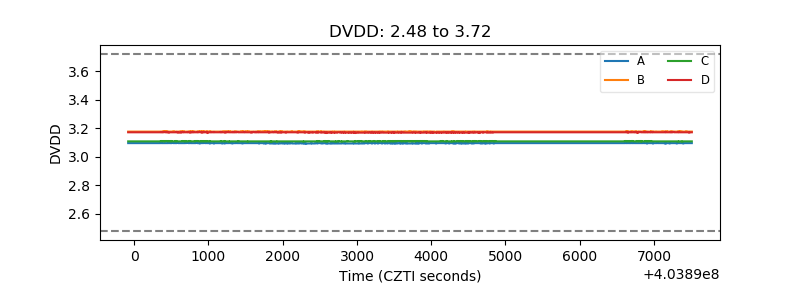 |
| Temperature 1 | 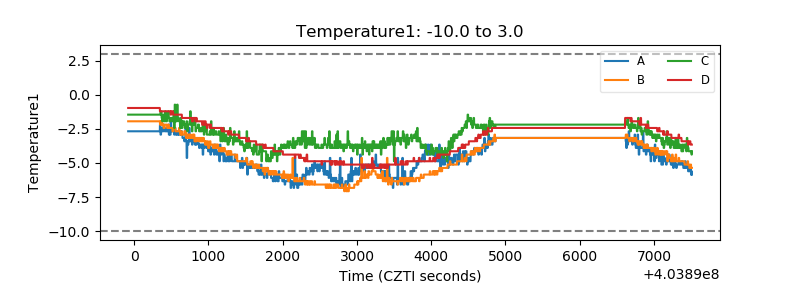 |
| Veto HV Monitor | 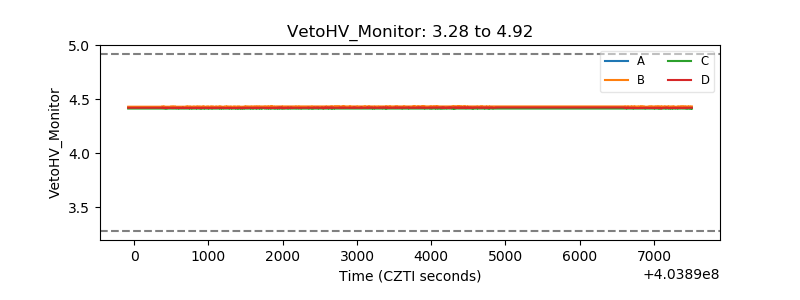 |
| Veto LLD | 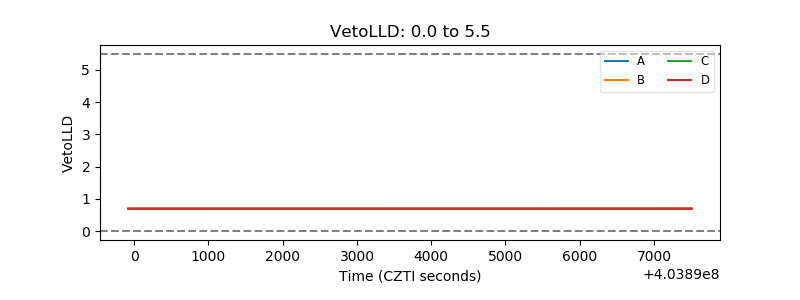 |
| Alpha Counter | 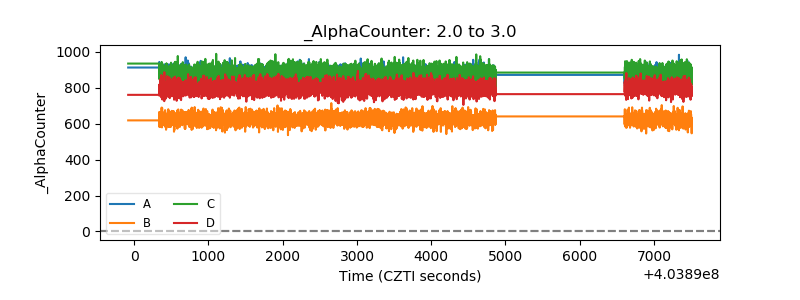 |
| _CPM_Rate | 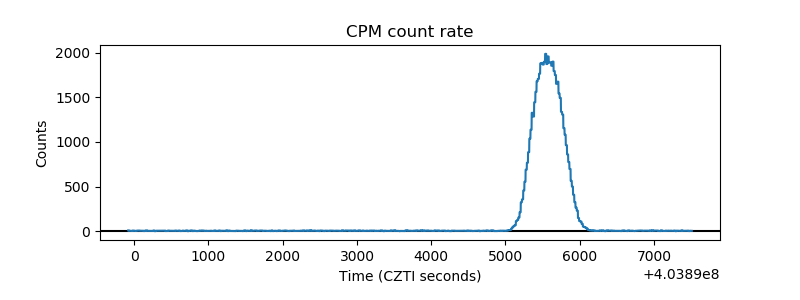 |
| CZT Counter | 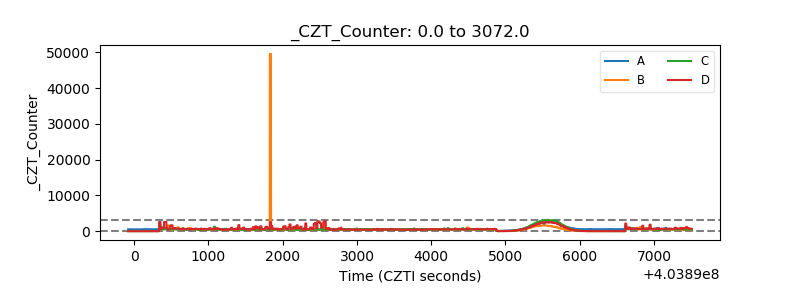 |
| +2.5 Volts monitor | 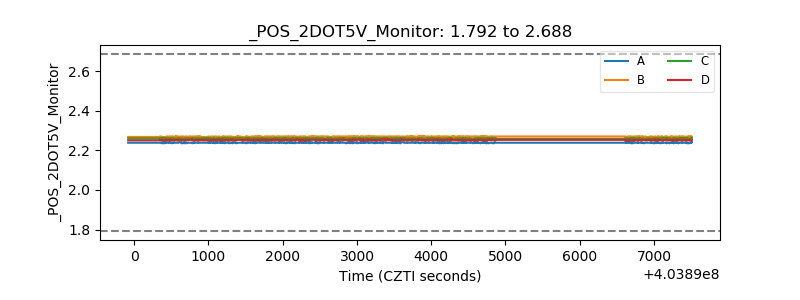 |
| +5 Volts monitor | 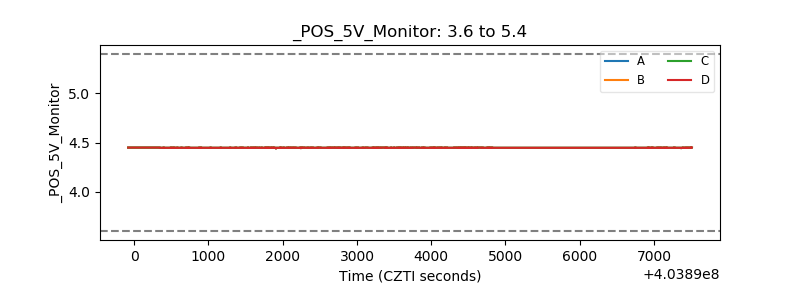 |
| _ROLL_ROT | 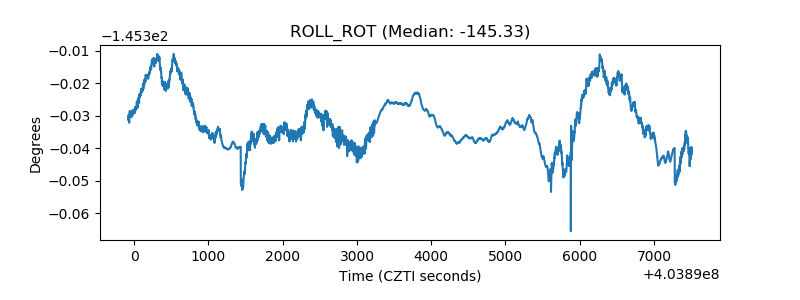 |
| _Roll_DEC | 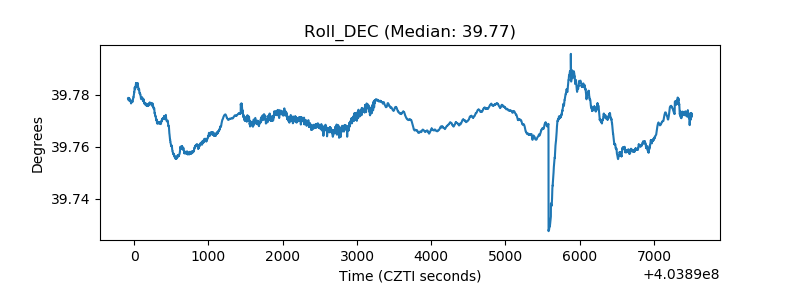 |
| _Roll_RA | 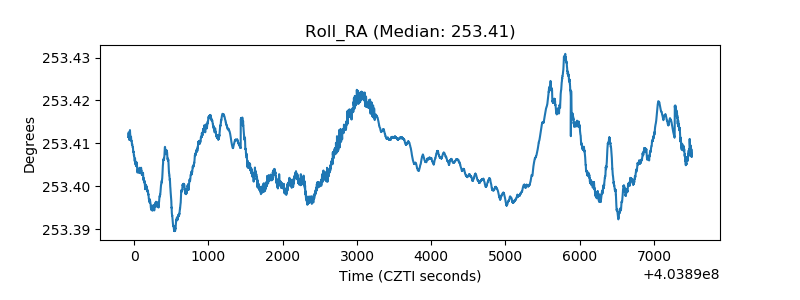 |
| Veto Counter | 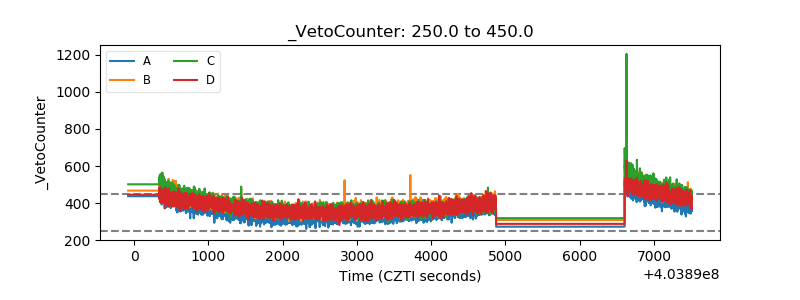 |