| Param | Original file | Final file |
|---|---|---|
| Filename | modeM0/AS1A07_145T01_9000005370_38171cztM0_level2.fits | modeM0/AS1A07_145T01_9000005370_38171cztM0_level2_quad_clean.evt |
| Size (bytes) | 432,083,520 | 95,428,800 |
| Size | 412.1 MB | 91.0 MB |
| Events in quadrant A | 2,883,719 | 683,613 |
| Events in quadrant B | 2,739,946 | 711,506 |
| Events in quadrant C | 2,773,008 | 678,355 |
| Events in quadrant D | 7,184,687 | 444,714 |
| Mode M9 | |||
|---|---|---|---|
| Quadrant | BADHDUFLAG | Total packets | Discarded packets |
| A | 0 | 25 | 0 |
| B | 0 | 25 | 0 |
| C | 0 | 25 | 0 |
| D | 0 | 26 | 0 |
| Mode SS | |||
|---|---|---|---|
| Quadrant | BADHDUFLAG | Total packets | Discarded packets |
| A | 0 | 108 | 0 |
| B | 0 | 108 | 0 |
| C | 0 | 108 | 0 |
| D | 0 | 108 | 0 |
| Mode M0 | |||
|---|---|---|---|
| Quadrant | BADHDUFLAG | Total packets | Discarded packets |
| A | 0 | 11718 | 3 |
| B | 0 | 11401 | 2 |
| C | 0 | 11263 | 2 |
| D | 0 | 24779 | 2 |
| Quadrant | Total seconds | Saturated seconds | Saturation percentage |
|---|---|---|---|
| A | 5307 | 11 | 0.207273% |
| B | 5307 | 13 | 0.244959% |
| C | 5307 | 12 | 0.226116% |
| D | 5307 | 1700 | 32.033164% |
Noise dominated data is calculated using 1-second bins in cleaned event files. If a bin has >2000 counts, and if more than 50% of those come from <1% of pixels, then it is considered to be noise-dominated and hence unusable.
| Quadrant | # 1 sec bins | Bins with >0 counts | Bins with >2000 counts | High rate bins dominated by noise | Noise dominated (total time) | Noise dominated (detector-on time) | Marked lightcurve |
|---|---|---|---|---|---|---|---|
| A | 7310 | 5308 | 9 | 9 | 0.12% | 0.17% | 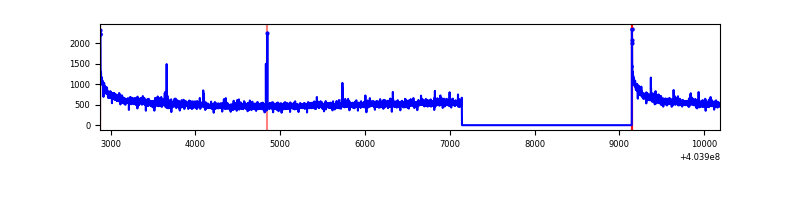 |
| B | 7310 | 5308 | 3 | 3 | 0.04% | 0.06% | 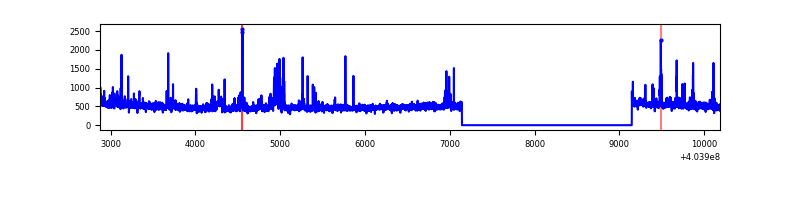 |
| C | 7310 | 5308 | 9 | 9 | 0.12% | 0.17% | 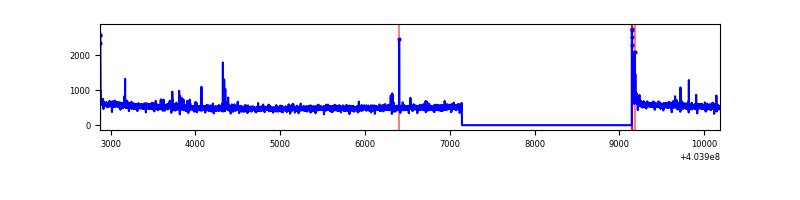 |
| D | 7310 | 5307 | 1749 | 1749 | 23.93% | 32.96% | 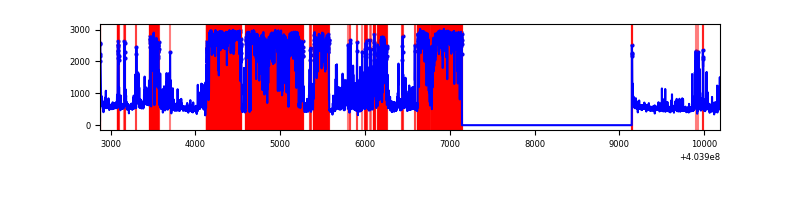 |
Top three noisy pixels from each quadrant. If the there are fewer than three noisy pixels in the level2.evt file, extra rows are filled as -1
| Pixel properties | Quadrant properties | ||||||
|---|---|---|---|---|---|---|---|
| Quadrant | DetID | PixID | Counts | Sigma | Mean | Median | Sigma |
| A | 10 | 83 | 360146 | 2797.47 | 634 | 622 | 128.5 |
| A | 12 | 189 | 33925 | 259.13 | 634 | 622 | 128.5 |
| A | 12 | 16 | 13178 | 97.7 | 634 | 622 | 128.5 |
| B | 0 | 230 | 108844 | 881.87 | 640 | 624 | 122.7 |
| B | 4 | 171 | 73176 | 591.22 | 640 | 624 | 122.7 |
| B | 0 | 229 | 31992 | 255.61 | 640 | 624 | 122.7 |
| C | 15 | 214 | 222327 | 1509.99 | 631 | 637 | 146.8 |
| C | 0 | 10 | 27876 | 185.53 | 631 | 637 | 146.8 |
| C | 5 | 250 | 24900 | 165.26 | 631 | 637 | 146.8 |
| D | 12 | 227 | 4718364 | 37402.74 | 528 | 515 | 126.1 |
| D | 10 | 203 | 126125 | 995.83 | 528 | 515 | 126.1 |
| D | 12 | 235 | 98411 | 776.11 | 528 | 515 | 126.1 |
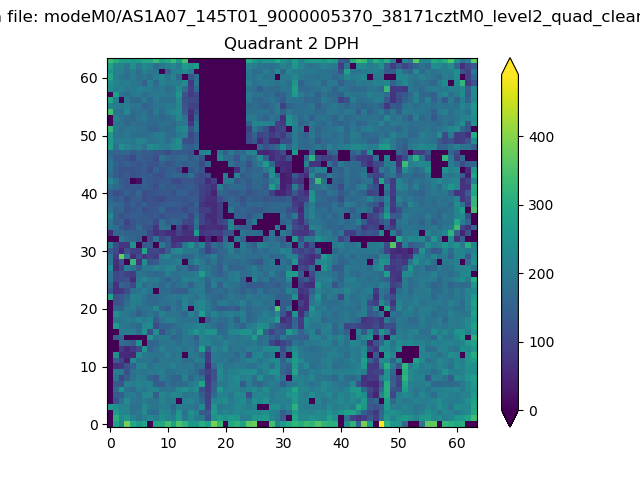
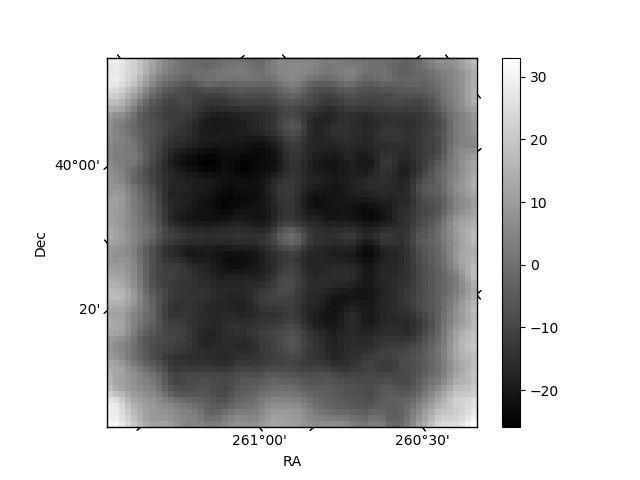
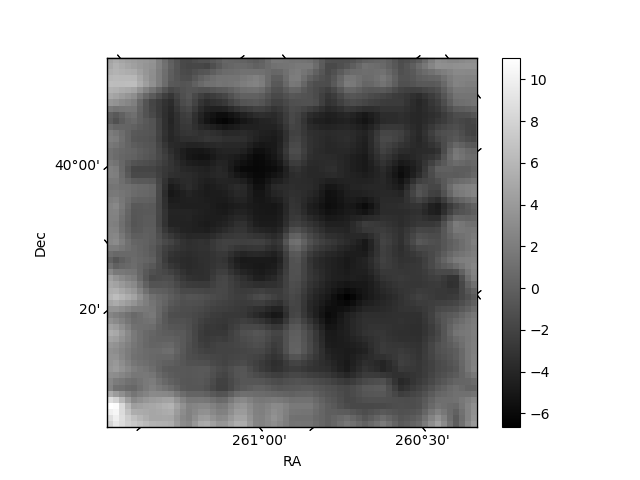
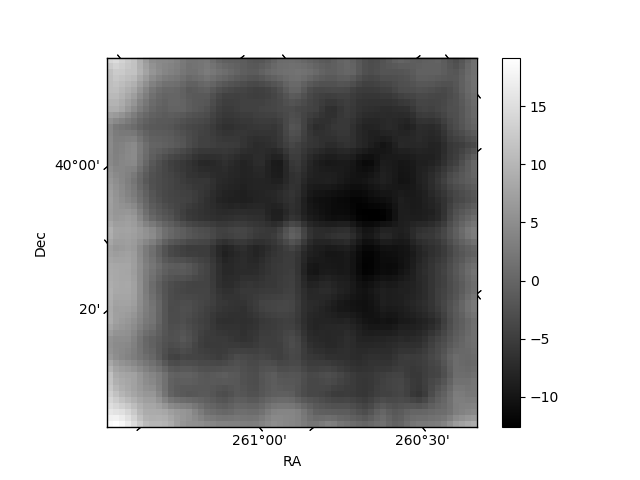
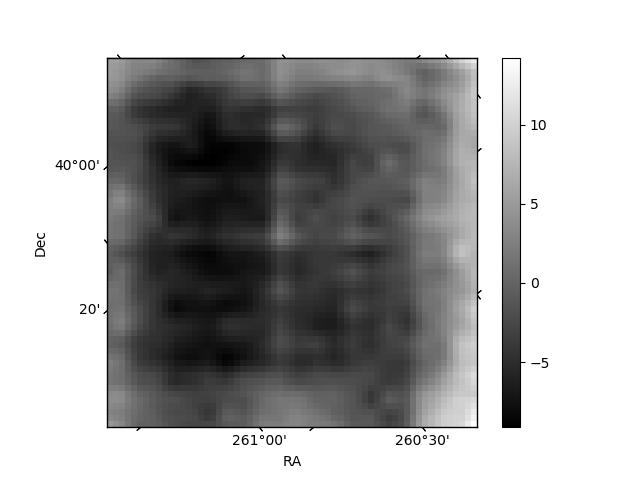
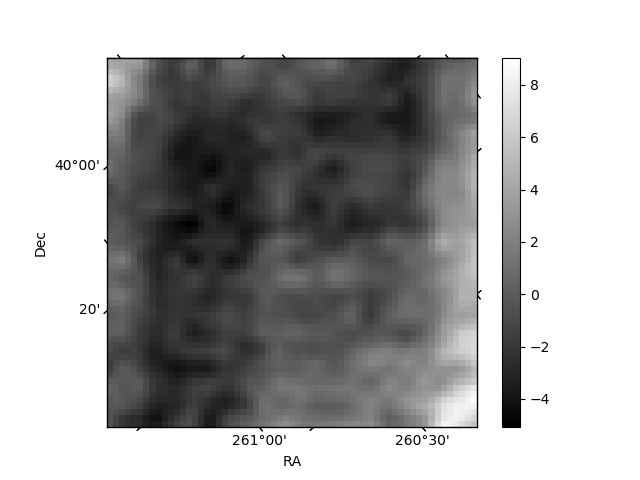
Histogram calculated using DETX and DETY for each event in the final _common_clean file
| Quadrant A | 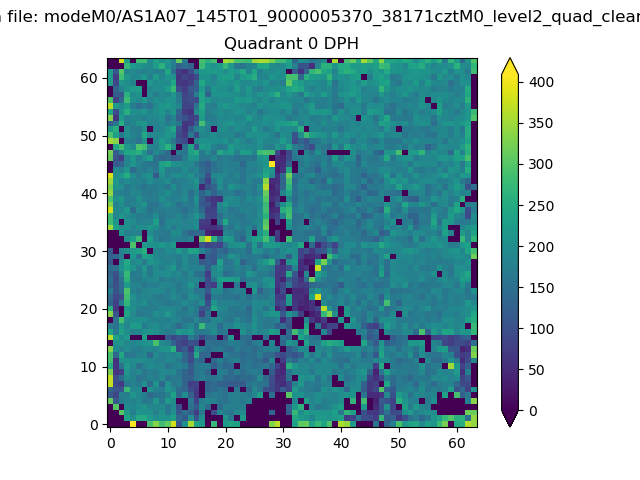 |
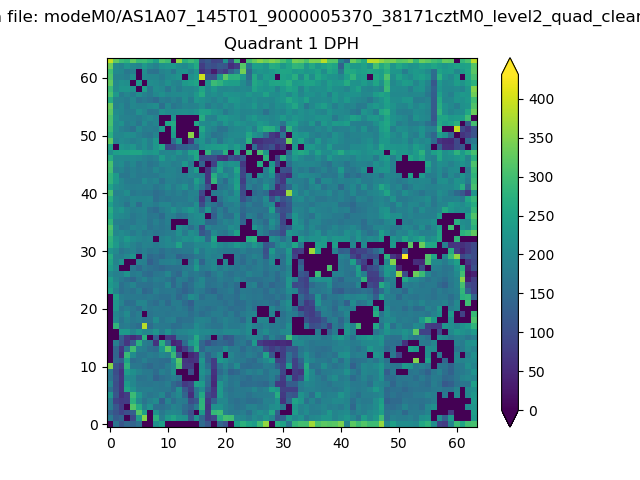 |
Quadrant B |
|---|---|---|---|
| Quadrant D | 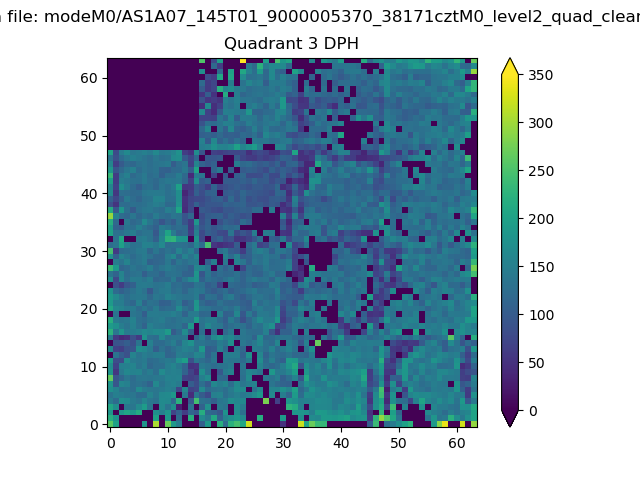 |
 |
Quadrant C |
| Plot type | Count rate plots | Images |
|---|---|---|
| Comparison with Poisson distribution Blue bars denote a histogram of data divided into 1 sec bins. Red curve is a Poisson curve with rate = median count rate of data. |
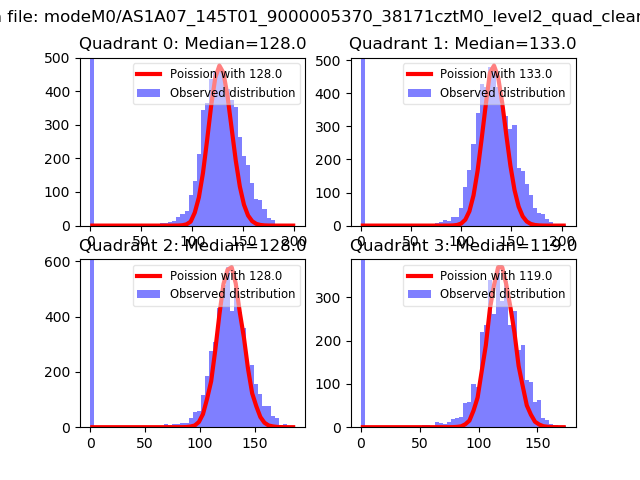 |
 |
| Quadrant-wise count rates Data is divided into 100 sec bins |
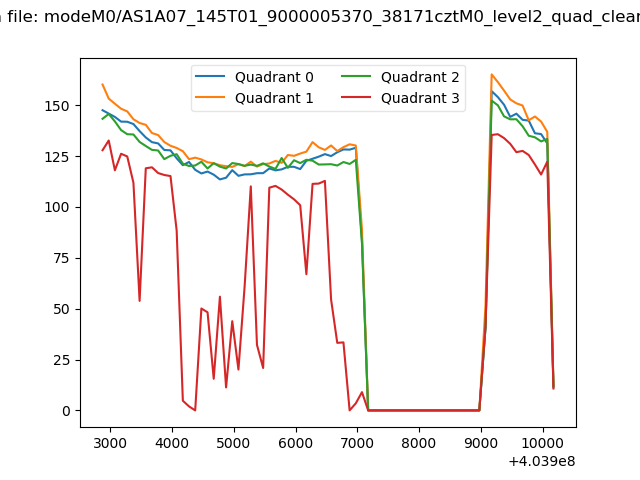 |
|
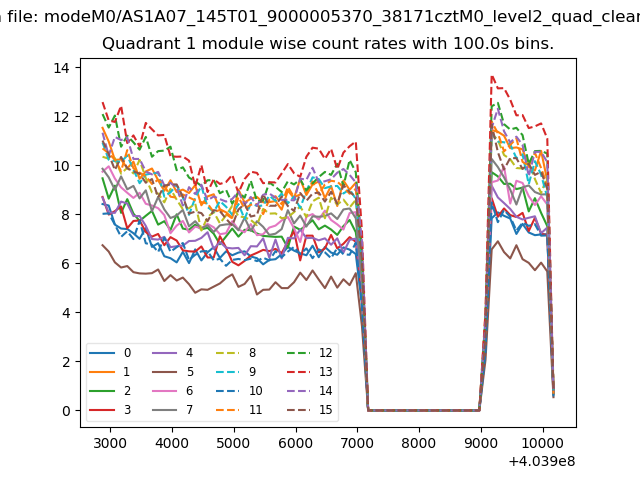
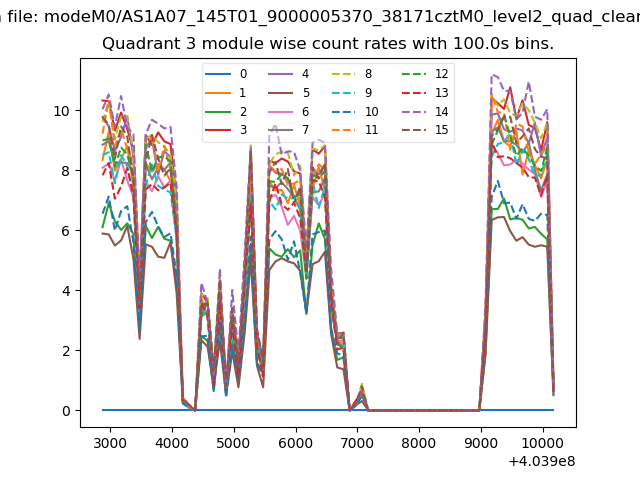
| Module-wise count rates for Quadrant A Data is divided into 100 sec bins |
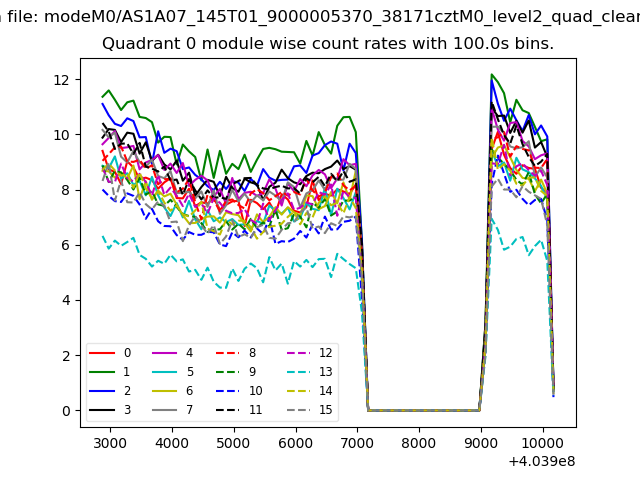 |
 |
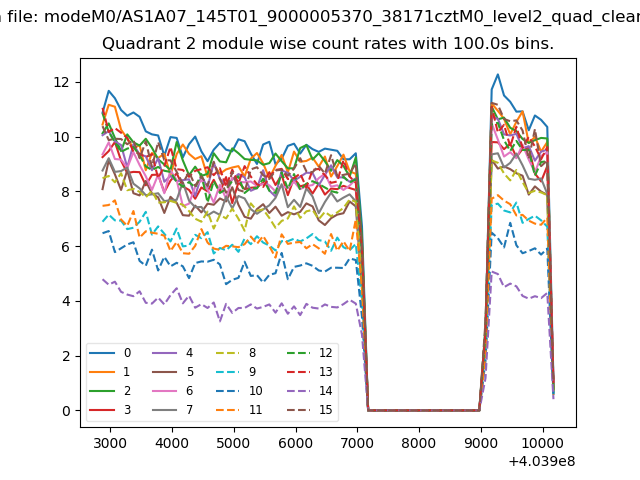
| Module-wise count rates for Quadrant B Data is divided into 100 sec bins |
 |
 |
| Module-wise count rates for Quadrant C Data is divided into 100 sec bins |
 |
 |
| Module-wise count rates for Quadrant D Data is divided into 100 sec bins |
 |
 |
| Parameter | Plot |
|---|---|
| CZT HV Monitor | 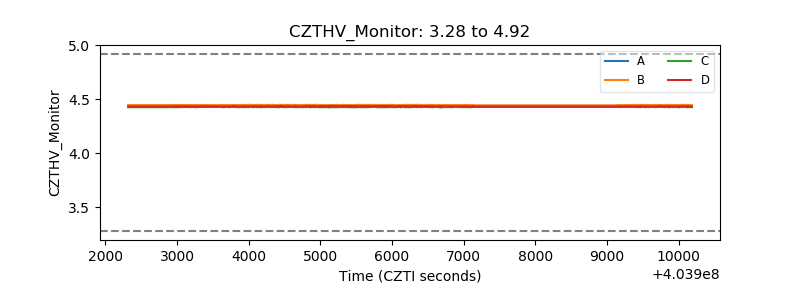 |
| D_VDD | 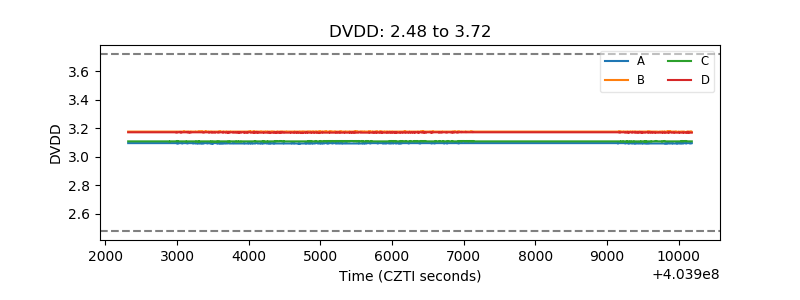 |
| Temperature 1 | 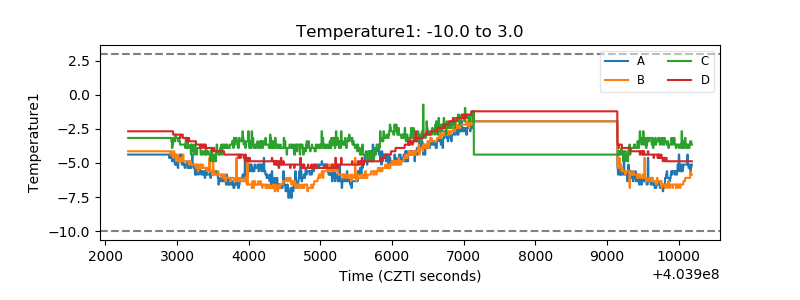 |
| Veto HV Monitor | 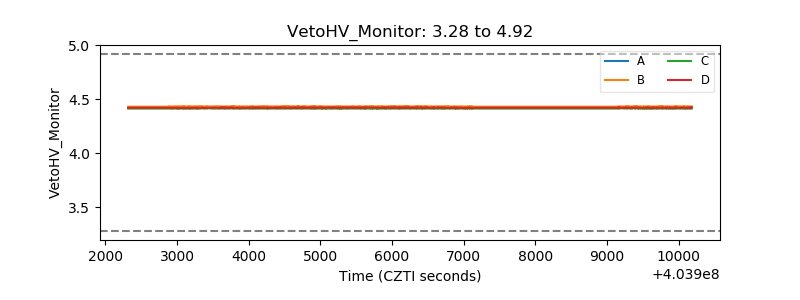 |
| Veto LLD | 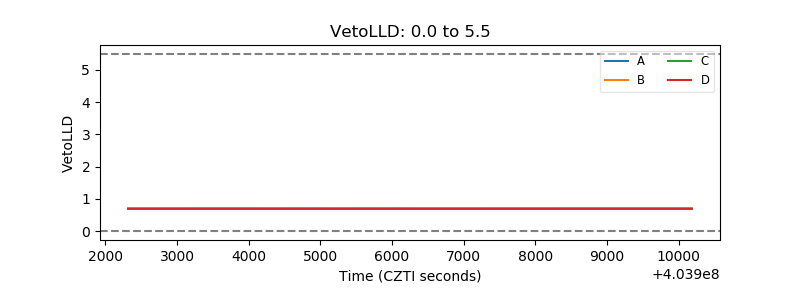 |
| Alpha Counter | 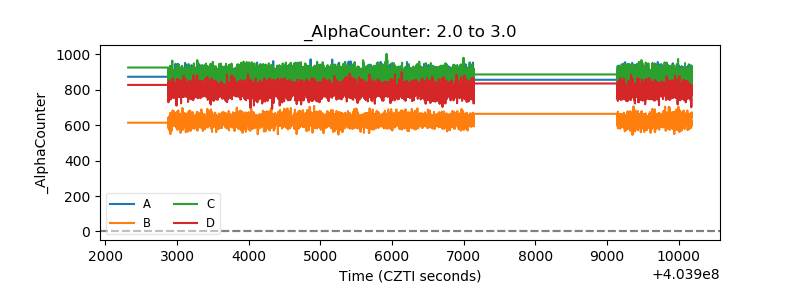 |
| _CPM_Rate | 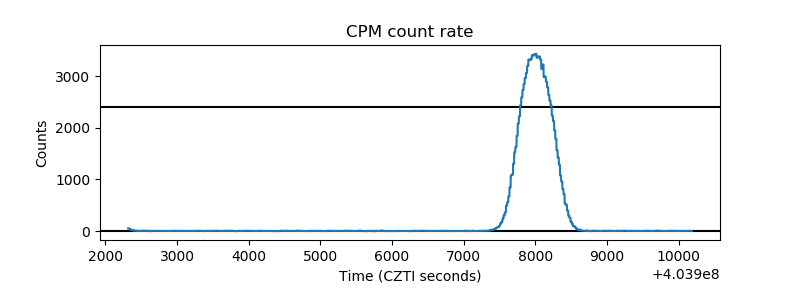 |
| CZT Counter | 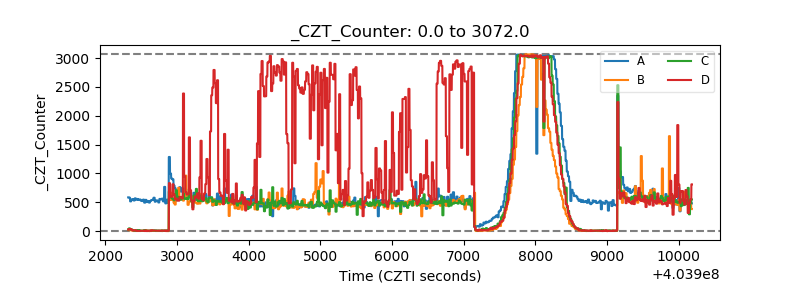 |
| +2.5 Volts monitor | 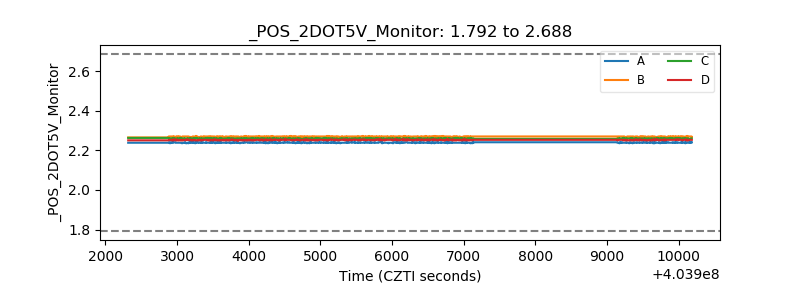 |
| +5 Volts monitor | 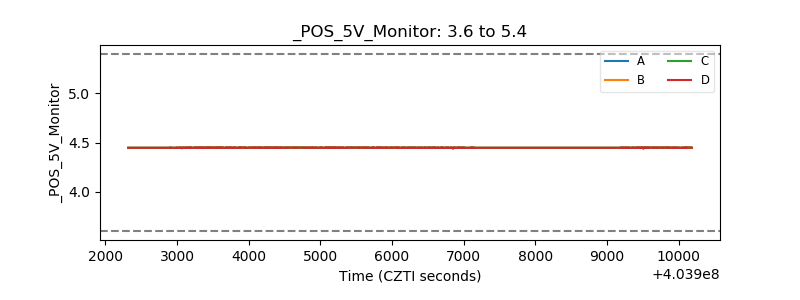 |
| _ROLL_ROT | 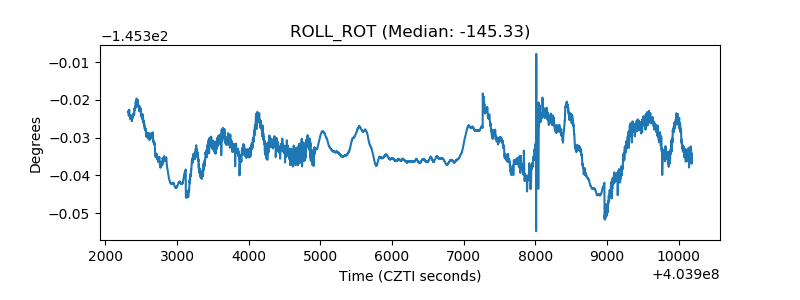 |
| _Roll_DEC | 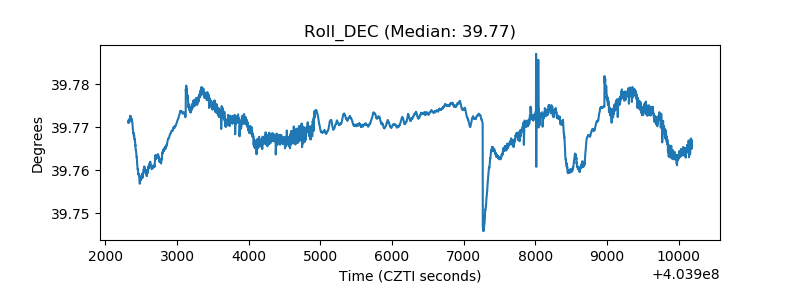 |
| _Roll_RA | 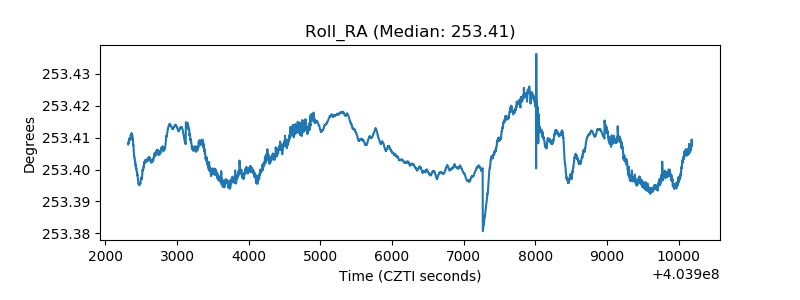 |
| Veto Counter | 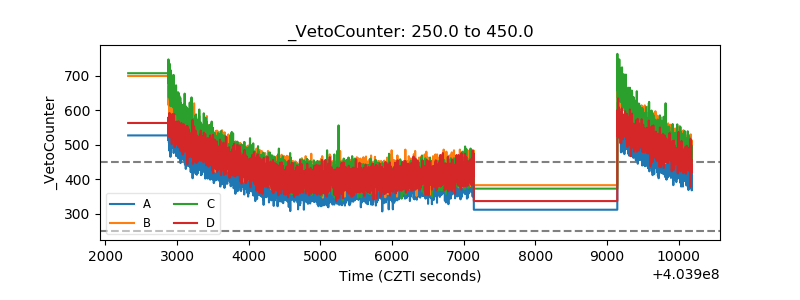 |