| Param | Original file | Final file |
|---|---|---|
| Filename | modeM0/AS1A07_145T01_9000005370_38172cztM0_level2.fits | modeM0/AS1A07_145T01_9000005370_38172cztM0_level2_quad_clean.evt |
| Size (bytes) | 344,586,240 | 99,573,120 |
| Size | 328.6 MB | 95.0 MB |
| Events in quadrant A | 2,861,319 | 683,646 |
| Events in quadrant B | 2,656,976 | 714,338 |
| Events in quadrant C | 2,746,457 | 678,706 |
| Events in quadrant D | 4,085,690 | 574,306 |
| Mode M9 | |||
|---|---|---|---|
| Quadrant | BADHDUFLAG | Total packets | Discarded packets |
| A | 0 | 30 | 0 |
| B | 0 | 30 | 0 |
| C | 0 | 30 | 0 |
| D | 0 | 31 | 0 |
| Mode SS | |||
|---|---|---|---|
| Quadrant | BADHDUFLAG | Total packets | Discarded packets |
| A | 0 | 108 | 0 |
| B | 0 | 108 | 0 |
| C | 0 | 108 | 0 |
| D | 0 | 108 | 0 |
| Mode M0 | |||
|---|---|---|---|
| Quadrant | BADHDUFLAG | Total packets | Discarded packets |
| A | 0 | 11556 | 3 |
| B | 0 | 11004 | 2 |
| C | 0 | 11092 | 2 |
| D | 0 | 15473 | 2 |
| Quadrant | Total seconds | Saturated seconds | Saturation percentage |
|---|---|---|---|
| A | 5197 | 8 | 0.153935% |
| B | 5197 | 18 | 0.346354% |
| C | 5197 | 13 | 0.250144% |
| D | 5197 | 497 | 9.563210% |
Noise dominated data is calculated using 1-second bins in cleaned event files. If a bin has >2000 counts, and if more than 50% of those come from <1% of pixels, then it is considered to be noise-dominated and hence unusable.
| Quadrant | # 1 sec bins | Bins with >0 counts | Bins with >2000 counts | High rate bins dominated by noise | Noise dominated (total time) | Noise dominated (detector-on time) | Marked lightcurve |
|---|---|---|---|---|---|---|---|
| A | 7289 | 5198 | 9 | 9 | 0.12% | 0.17% | 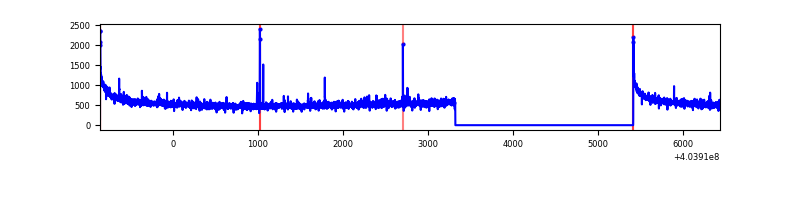 |
| B | 7289 | 5198 | 6 | 6 | 0.08% | 0.12% | 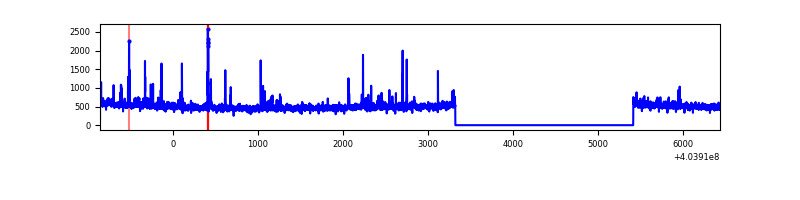 |
| C | 7289 | 5198 | 8 | 8 | 0.11% | 0.15% | 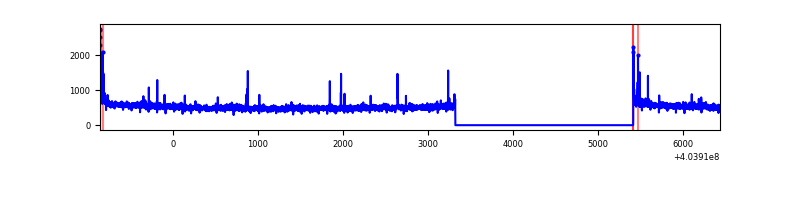 |
| D | 7288 | 5197 | 526 | 526 | 7.22% | 10.12% | 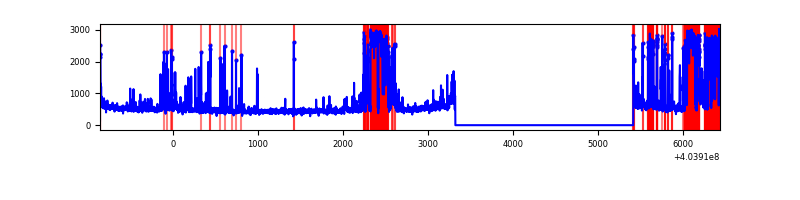 |
Top three noisy pixels from each quadrant. If the there are fewer than three noisy pixels in the level2.evt file, extra rows are filled as -1
| Pixel properties | Quadrant properties | ||||||
|---|---|---|---|---|---|---|---|
| Quadrant | DetID | PixID | Counts | Sigma | Mean | Median | Sigma |
| A | 10 | 83 | 357950 | 2828.36 | 632 | 622 | 126.3 |
| A | 12 | 189 | 22530 | 173.41 | 632 | 622 | 126.3 |
| A | 10 | 248 | 14846 | 112.59 | 632 | 622 | 126.3 |
| B | 4 | 171 | 68196 | 560.63 | 636 | 621 | 120.5 |
| B | 0 | 230 | 24673 | 199.55 | 636 | 621 | 120.5 |
| B | 7 | 202 | 21041 | 169.41 | 636 | 621 | 120.5 |
| C | 15 | 214 | 216889 | 1499.36 | 624 | 632 | 144.2 |
| C | 5 | 250 | 34764 | 236.64 | 624 | 632 | 144.2 |
| C | 0 | 10 | 22804 | 153.72 | 624 | 632 | 144.2 |
| D | 12 | 227 | 1467819 | 10296.2 | 591 | 576 | 142.5 |
| D | 13 | 249 | 146295 | 1022.57 | 591 | 576 | 142.5 |
| D | 12 | 235 | 107931 | 753.35 | 591 | 576 | 142.5 |
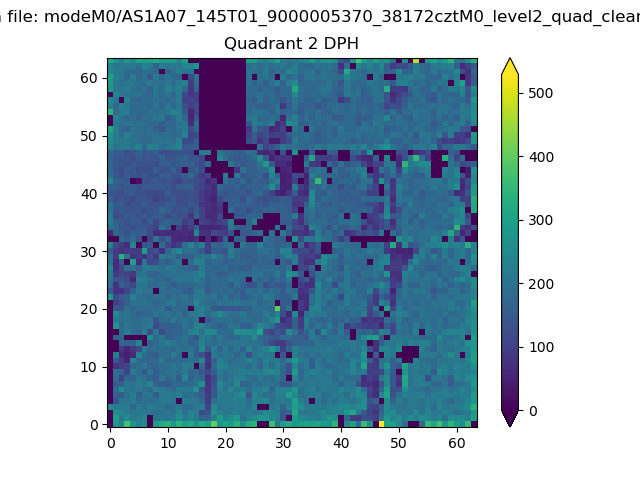
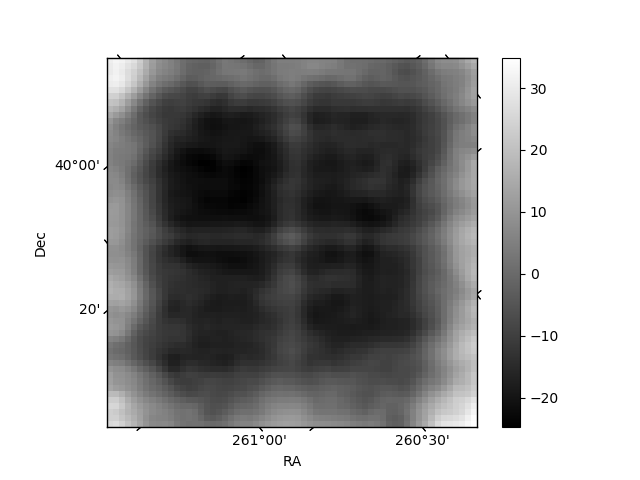
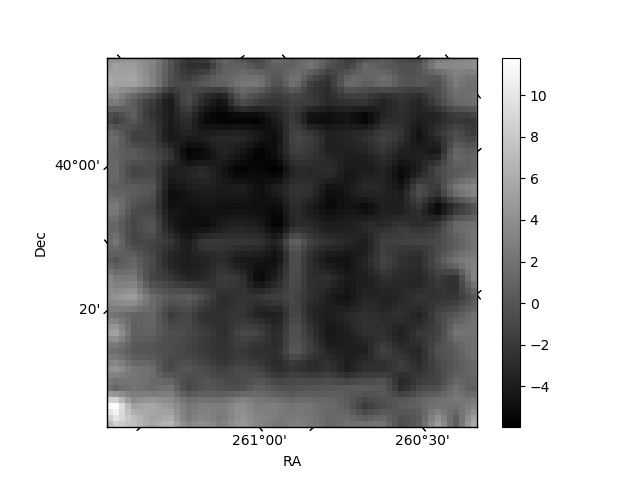
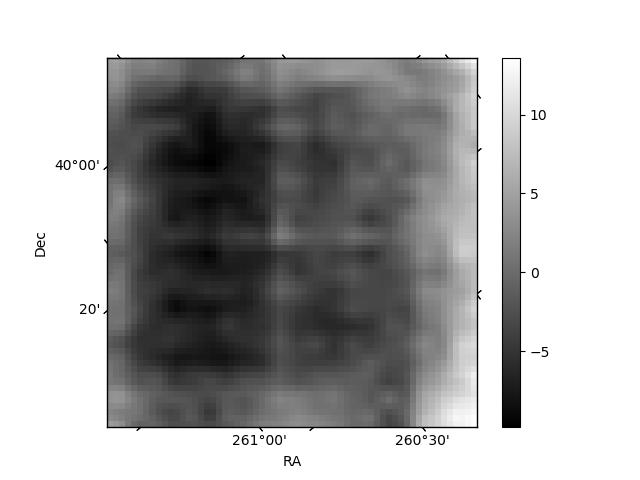
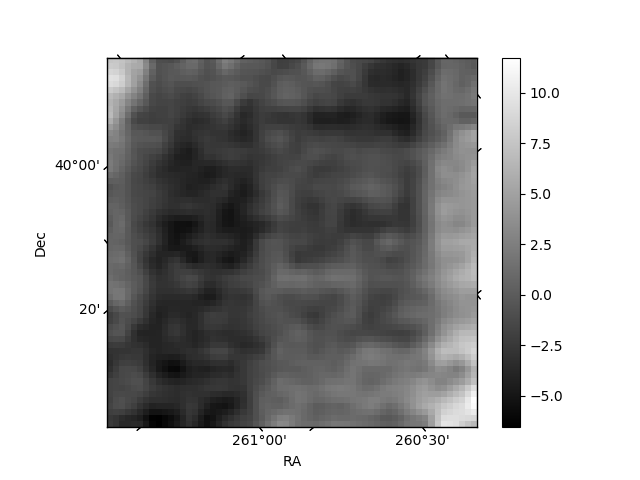
Histogram calculated using DETX and DETY for each event in the final _common_clean file
| Quadrant A | 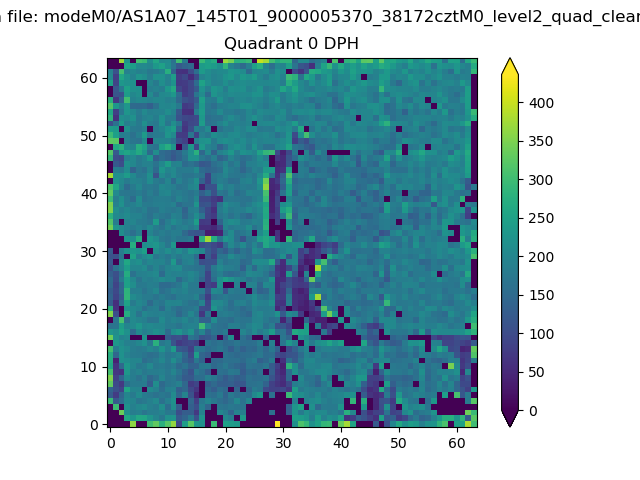 |
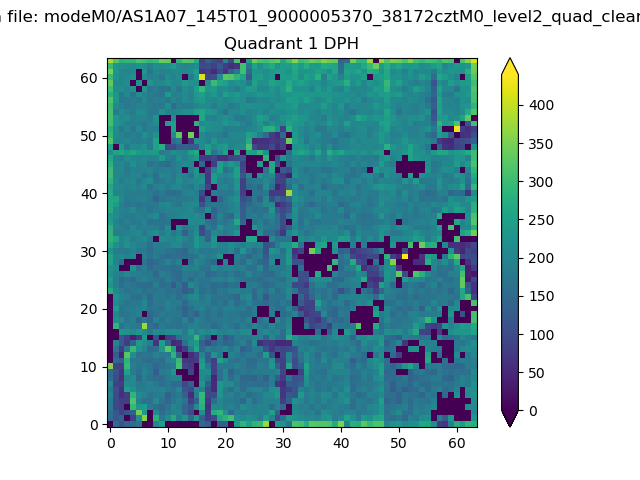 |
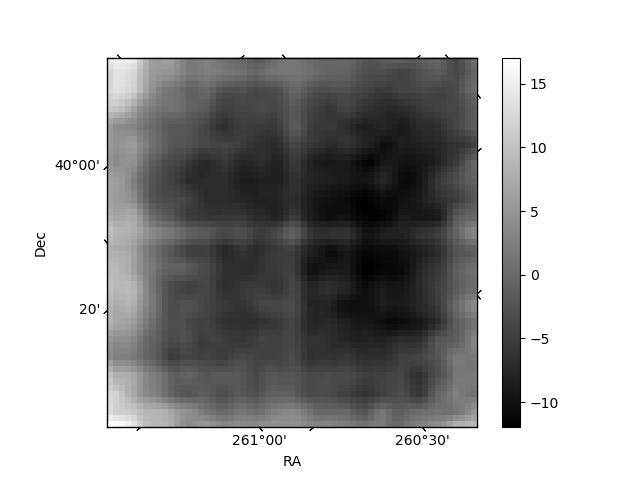
Quadrant B |
|---|---|---|---|
| Quadrant D | 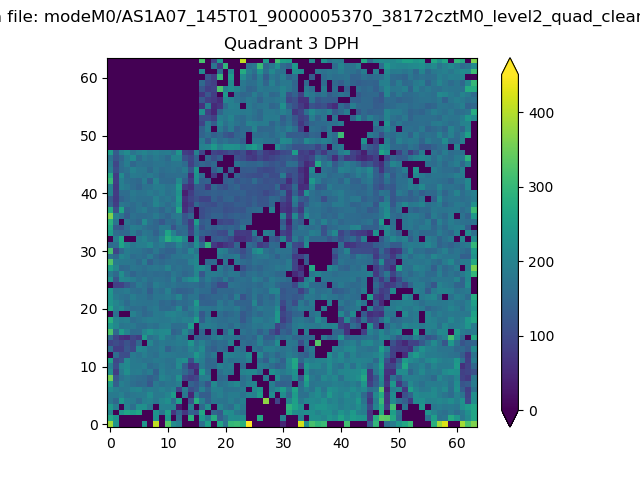 |
 |
Quadrant C |
| Plot type | Count rate plots | Images |
|---|---|---|
| Comparison with Poisson distribution Blue bars denote a histogram of data divided into 1 sec bins. Red curve is a Poisson curve with rate = median count rate of data. |
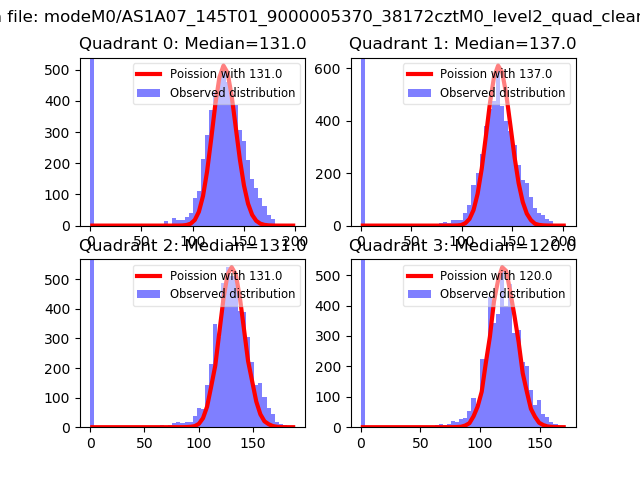 |
 |
| Quadrant-wise count rates Data is divided into 100 sec bins |
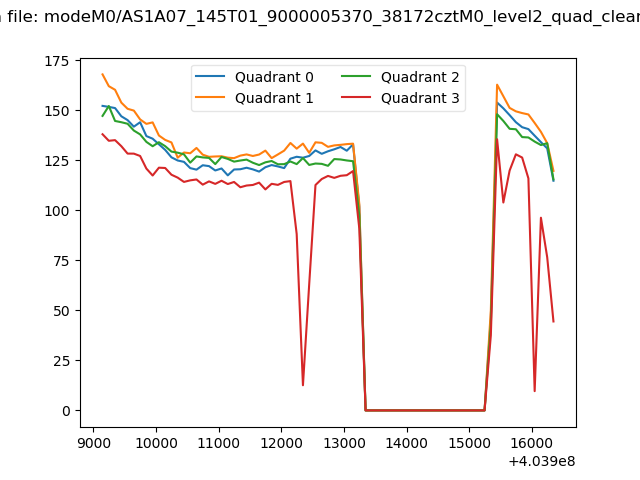 |
|
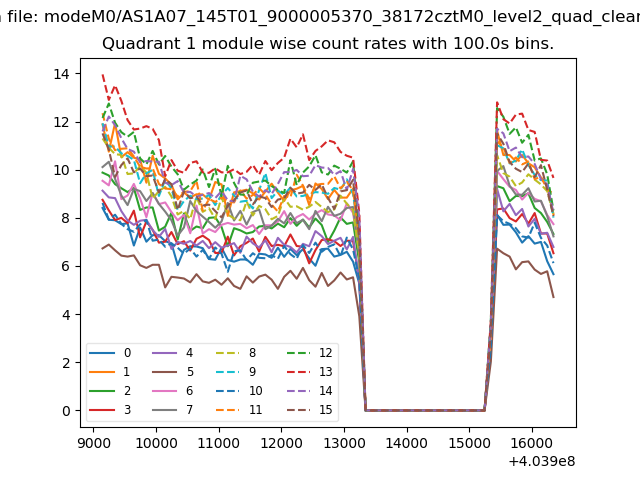
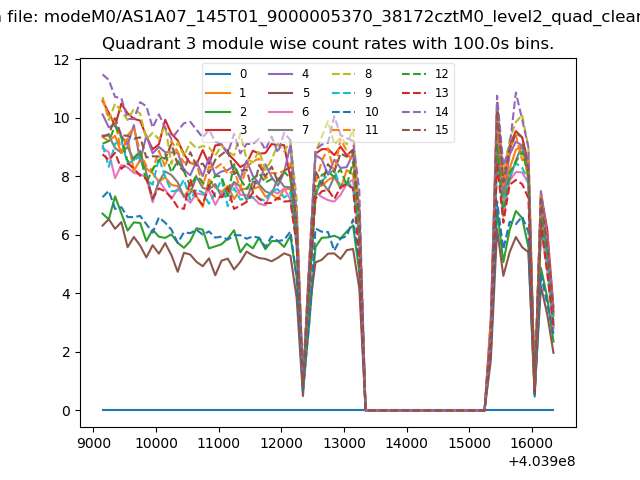
| Module-wise count rates for Quadrant A Data is divided into 100 sec bins |
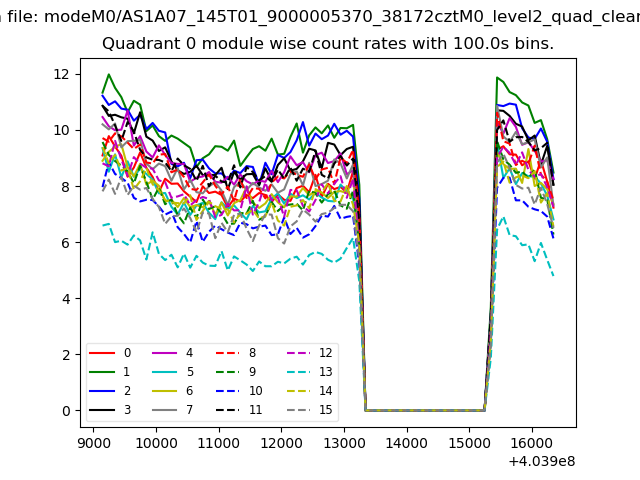 |
 |
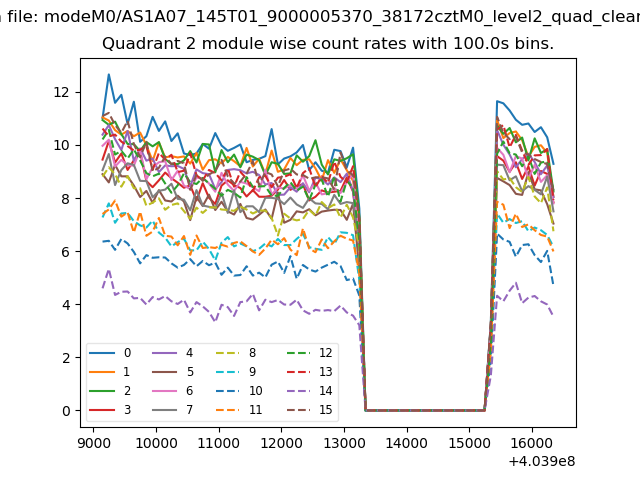
| Module-wise count rates for Quadrant B Data is divided into 100 sec bins |
 |
 |
| Module-wise count rates for Quadrant C Data is divided into 100 sec bins |
 |
 |
| Module-wise count rates for Quadrant D Data is divided into 100 sec bins |
 |
 |
| Parameter | Plot |
|---|---|
| CZT HV Monitor | 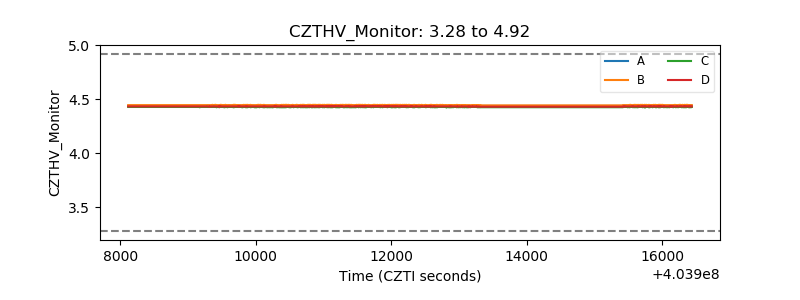 |
| D_VDD | 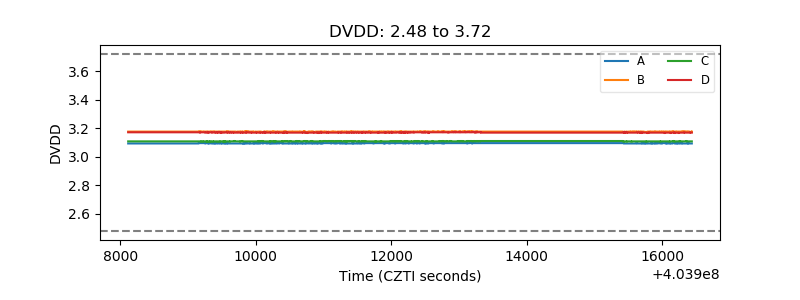 |
| Temperature 1 | 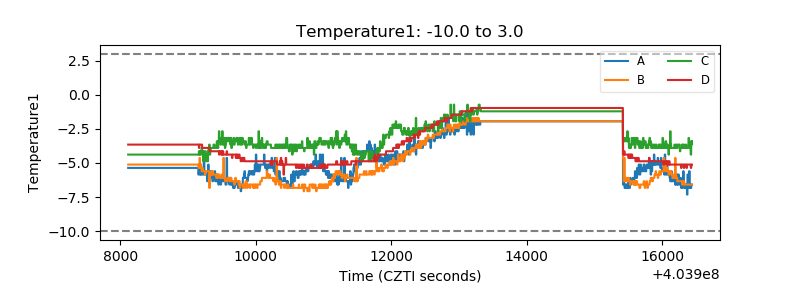 |
| Veto HV Monitor | 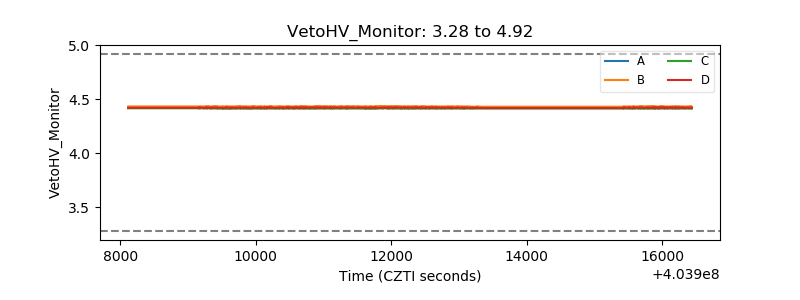 |
| Veto LLD | 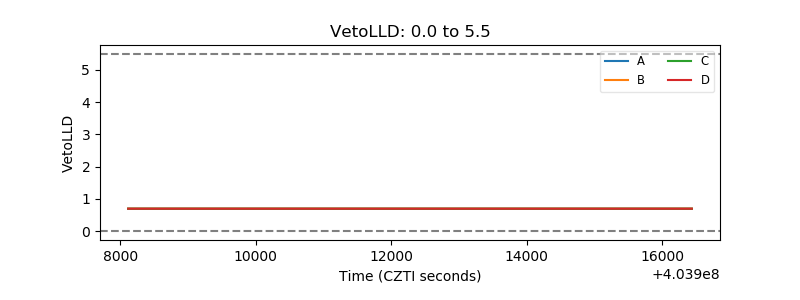 |
| Alpha Counter | 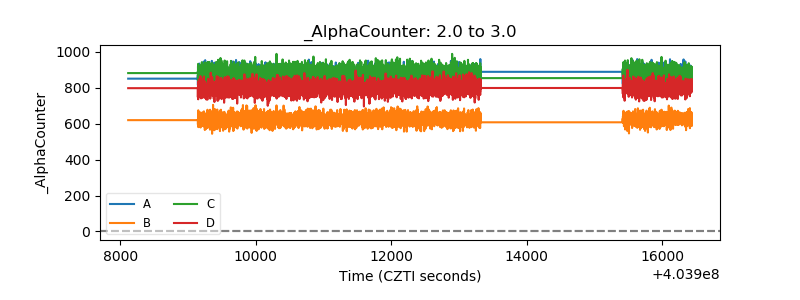 |
| _CPM_Rate | 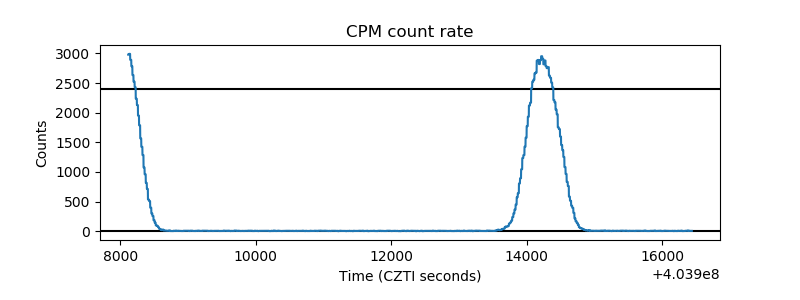 |
| CZT Counter | 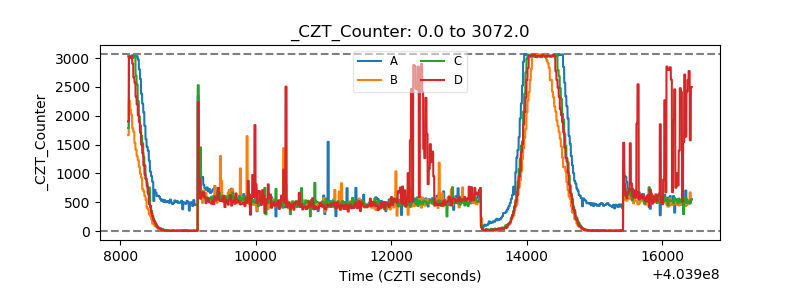 |
| +2.5 Volts monitor | 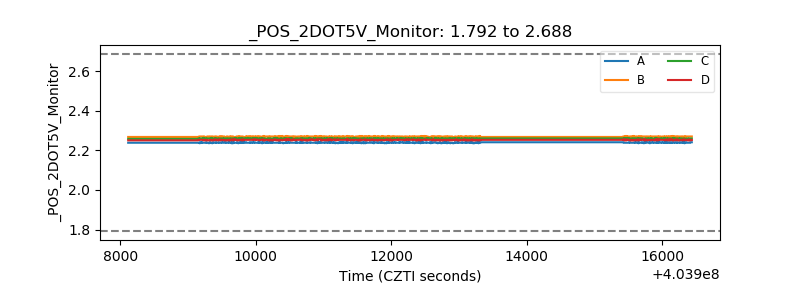 |
| +5 Volts monitor | 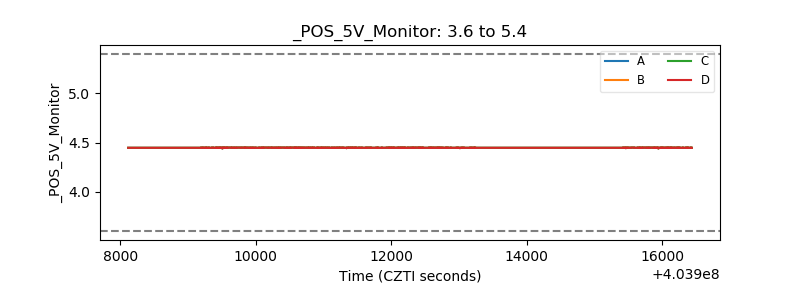 |
| _ROLL_ROT | 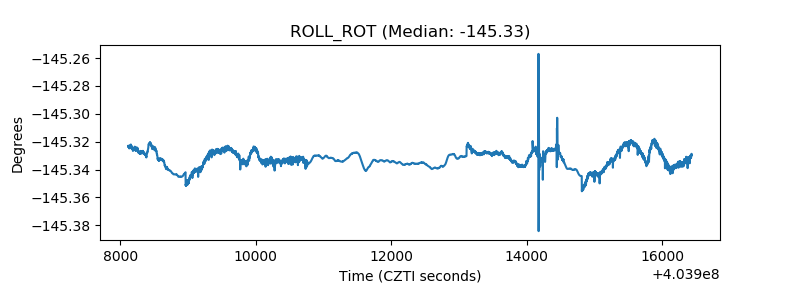 |
| _Roll_DEC | 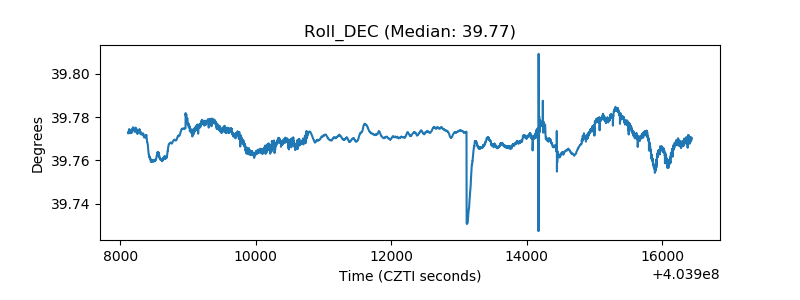 |
| _Roll_RA | 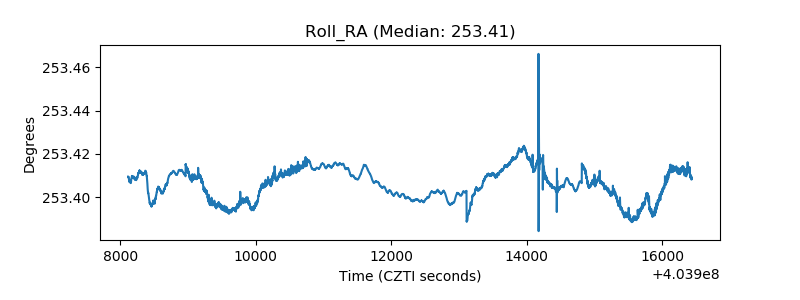 |
| Veto Counter | 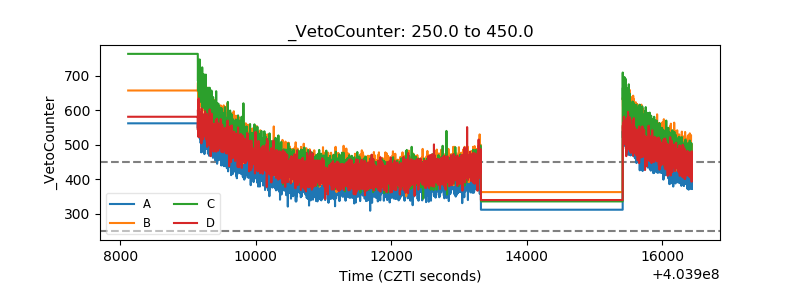 |