| Param | Original file | Final file |
|---|---|---|
| Filename | modeM0/AS1A07_145T01_9000005370_38174cztM0_level2.fits | modeM0/AS1A07_145T01_9000005370_38174cztM0_level2_quad_clean.evt |
| Size (bytes) | 514,995,840 | 84,772,800 |
| Size | 491.1 MB | 80.8 MB |
| Events in quadrant A | 2,782,358 | 634,888 |
| Events in quadrant B | 2,760,754 | 651,854 |
| Events in quadrant C | 2,571,168 | 625,857 |
| Events in quadrant D | 10,550,710 | 295,290 |
| Mode M9 | |||
|---|---|---|---|
| Quadrant | BADHDUFLAG | Total packets | Discarded packets |
| A | 0 | 24 | 0 |
| B | 0 | 24 | 0 |
| C | 0 | 24 | 0 |
| D | 0 | 25 | 0 |
| Mode SS | |||
|---|---|---|---|
| Quadrant | BADHDUFLAG | Total packets | Discarded packets |
| A | 0 | 104 | 0 |
| B | 0 | 104 | 0 |
| C | 0 | 104 | 0 |
| D | 0 | 104 | 0 |
| Mode M0 | |||
|---|---|---|---|
| Quadrant | BADHDUFLAG | Total packets | Discarded packets |
| A | 0 | 11282 | 3 |
| B | 0 | 11471 | 2 |
| C | 0 | 10569 | 2 |
| D | 0 | 34907 | 2 |
| Quadrant | Total seconds | Saturated seconds | Saturation percentage |
|---|---|---|---|
| A | 5127 | 18 | 0.351083% |
| B | 5127 | 57 | 1.111761% |
| C | 5127 | 12 | 0.234055% |
| D | 5127 | 2789 | 54.398284% |
Noise dominated data is calculated using 1-second bins in cleaned event files. If a bin has >2000 counts, and if more than 50% of those come from <1% of pixels, then it is considered to be noise-dominated and hence unusable.
| Quadrant | # 1 sec bins | Bins with >0 counts | Bins with >2000 counts | High rate bins dominated by noise | Noise dominated (total time) | Noise dominated (detector-on time) | Marked lightcurve |
|---|---|---|---|---|---|---|---|
| A | 7219 | 5128 | 13 | 13 | 0.18% | 0.25% | 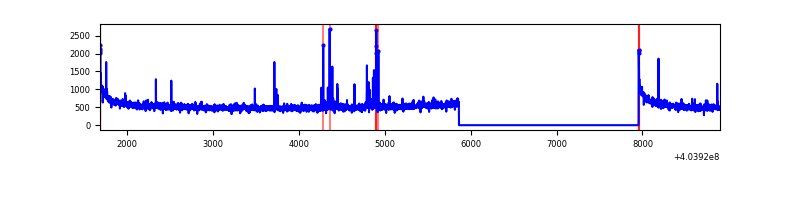 |
| B | 7218 | 5127 | 36 | 36 | 0.50% | 0.70% | 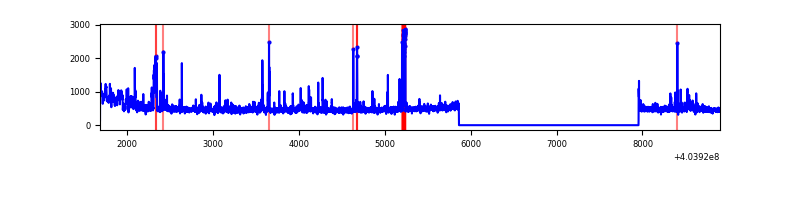 |
| C | 7219 | 5128 | 6 | 6 | 0.08% | 0.12% | 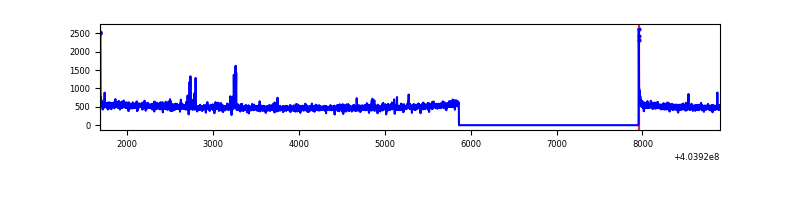 |
| D | 7219 | 5127 | 3202 | 3202 | 44.36% | 62.45% | 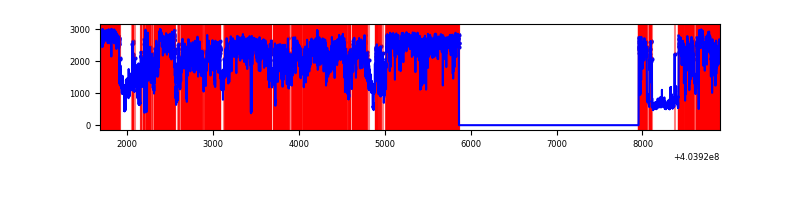 |
Top three noisy pixels from each quadrant. If the there are fewer than three noisy pixels in the level2.evt file, extra rows are filled as -1
| Pixel properties | Quadrant properties | ||||||
|---|---|---|---|---|---|---|---|
| Quadrant | DetID | PixID | Counts | Sigma | Mean | Median | Sigma |
| A | 10 | 83 | 353360 | 2924.61 | 601 | 590 | 120.6 |
| A | 9 | 143 | 39912 | 326.0 | 601 | 590 | 120.6 |
| A | 7 | 3 | 31625 | 257.29 | 601 | 590 | 120.6 |
| B | 4 | 171 | 111139 | 968.03 | 600 | 585 | 114.2 |
| B | 5 | 184 | 109520 | 953.85 | 600 | 585 | 114.2 |
| B | 0 | 230 | 70557 | 612.68 | 600 | 585 | 114.2 |
| C | 15 | 214 | 218097 | 1600.65 | 586 | 591 | 135.9 |
| C | 1 | 23 | 27115 | 195.19 | 586 | 591 | 135.9 |
| C | 0 | 10 | 23266 | 166.87 | 586 | 591 | 135.9 |
| D | 12 | 227 | 6758441 | 61629.31 | 451 | 439 | 109.7 |
| D | 12 | 235 | 1838126 | 16758.71 | 451 | 439 | 109.7 |
| D | 13 | 249 | 65635 | 594.55 | 451 | 439 | 109.7 |
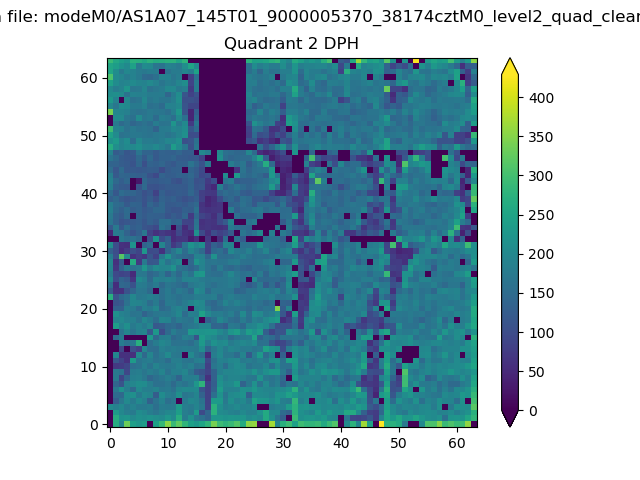
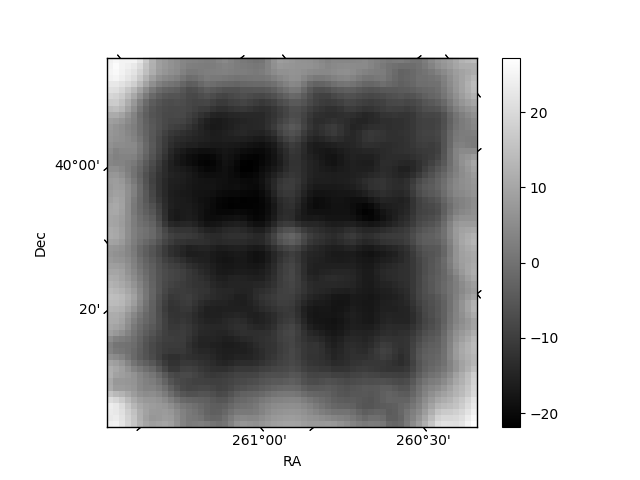
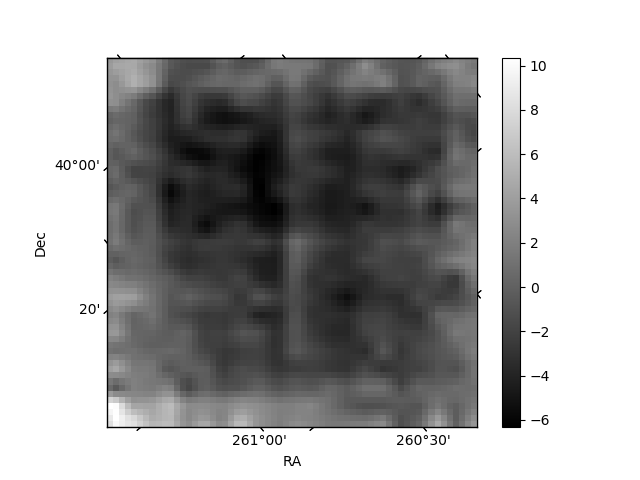
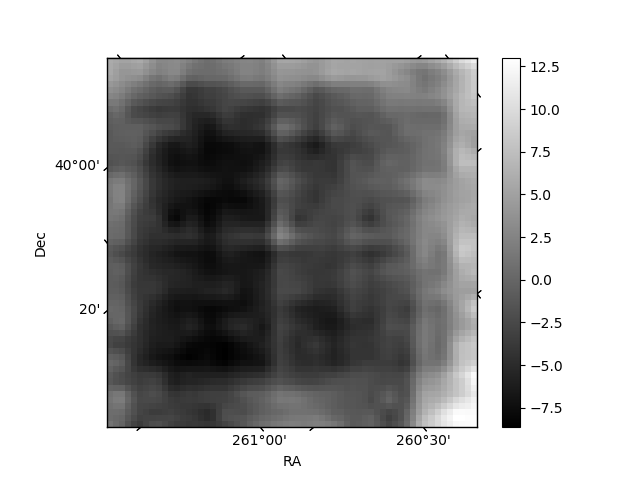
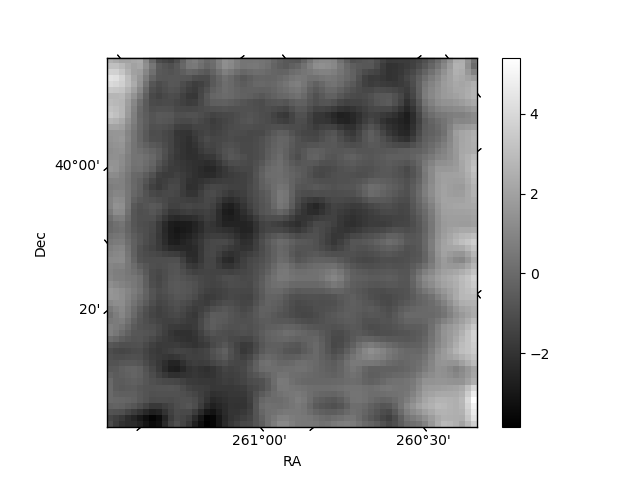
Histogram calculated using DETX and DETY for each event in the final _common_clean file
| Quadrant A | 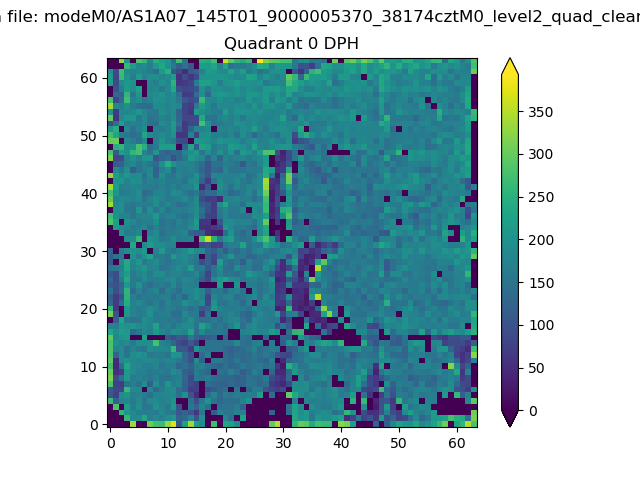 |
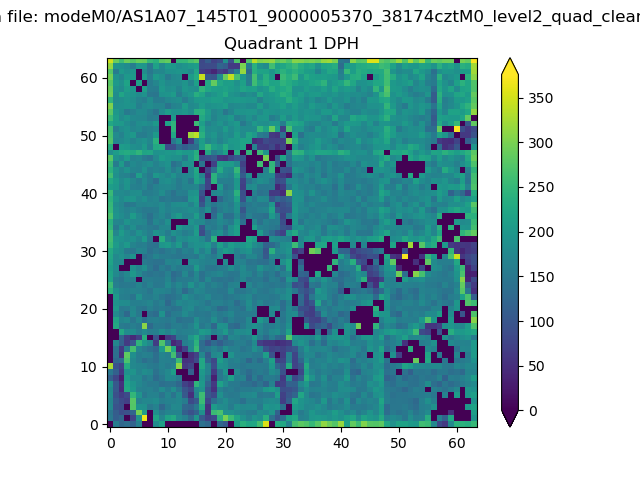 |
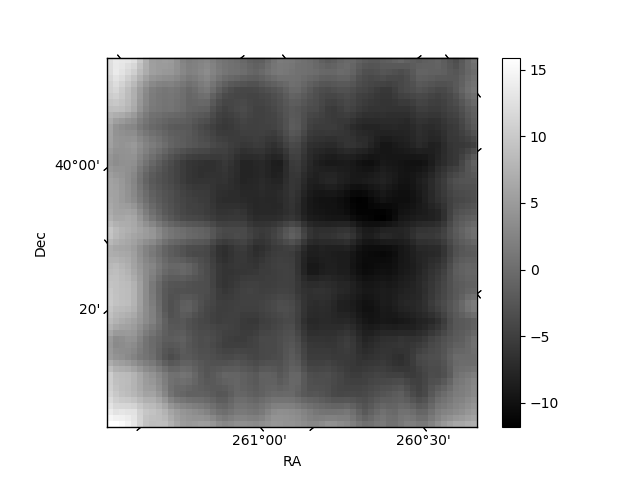
Quadrant B |
|---|---|---|---|
| Quadrant D | 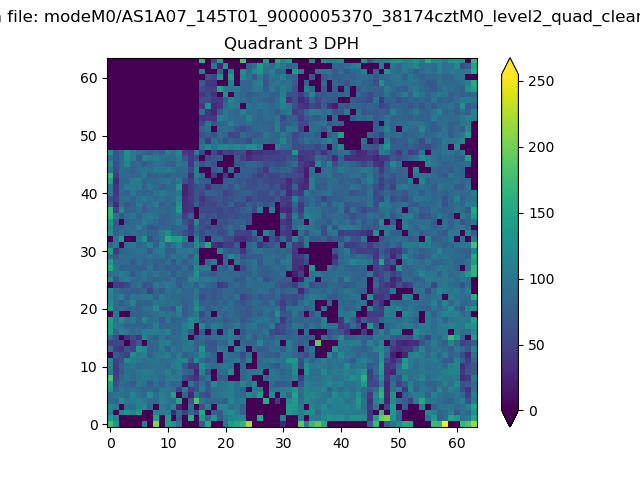 |
 |
Quadrant C |
| Plot type | Count rate plots | Images |
|---|---|---|
| Comparison with Poisson distribution Blue bars denote a histogram of data divided into 1 sec bins. Red curve is a Poisson curve with rate = median count rate of data. |
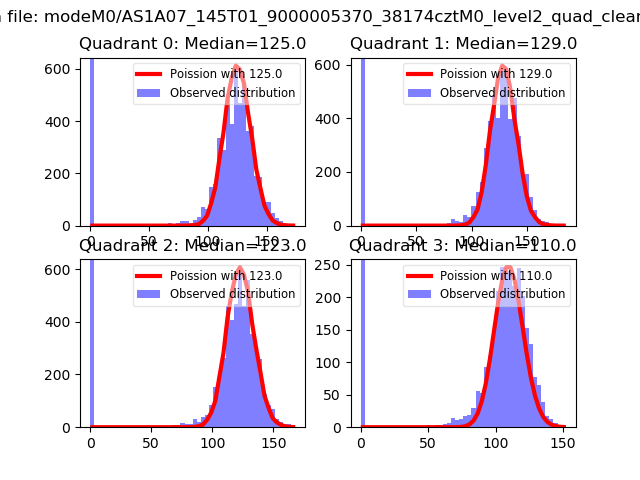 |
 |
| Quadrant-wise count rates Data is divided into 100 sec bins |
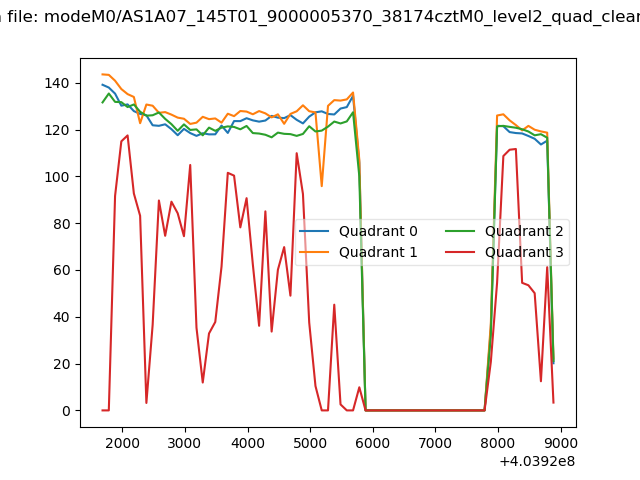 |
|
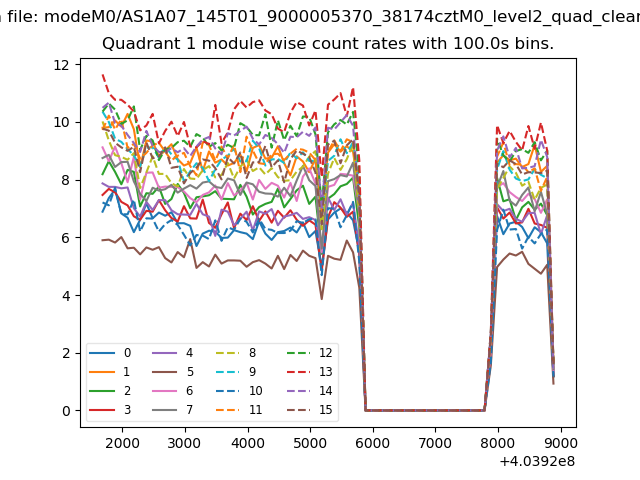
| Module-wise count rates for Quadrant A Data is divided into 100 sec bins |
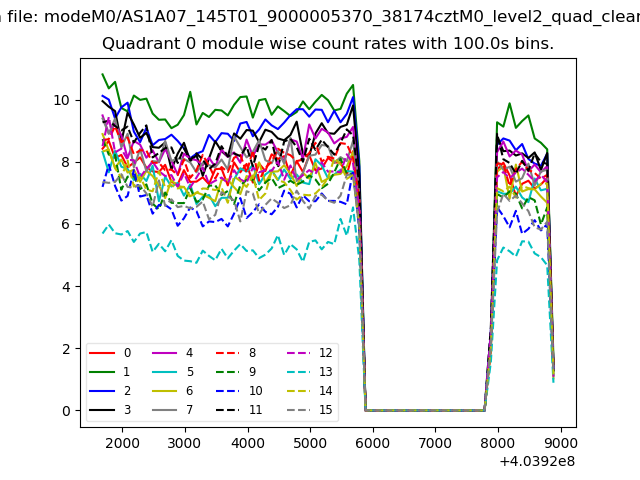 |
 |
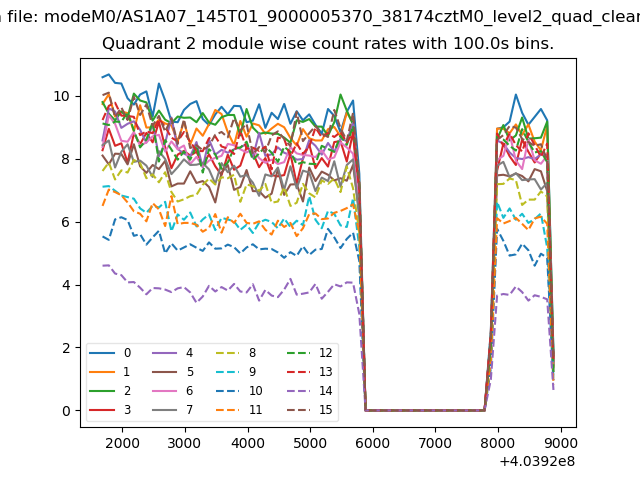
| Module-wise count rates for Quadrant B Data is divided into 100 sec bins |
 |
 |
| Module-wise count rates for Quadrant C Data is divided into 100 sec bins |
 |
 |
| Module-wise count rates for Quadrant D Data is divided into 100 sec bins |
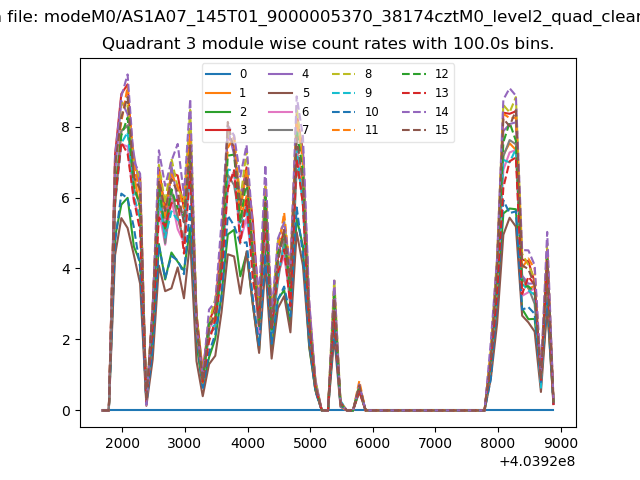 |
 |
| Parameter | Plot |
|---|---|
| CZT HV Monitor | 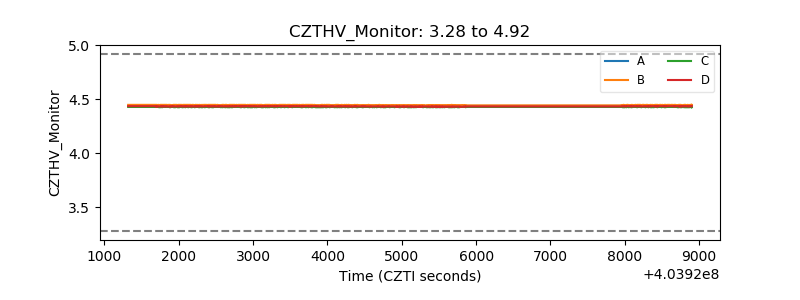 |
| D_VDD | 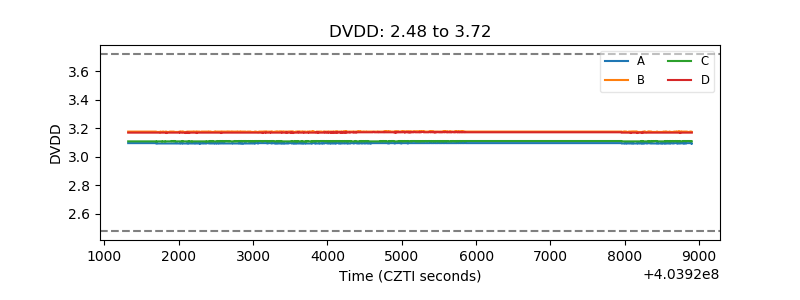 |
| Temperature 1 | 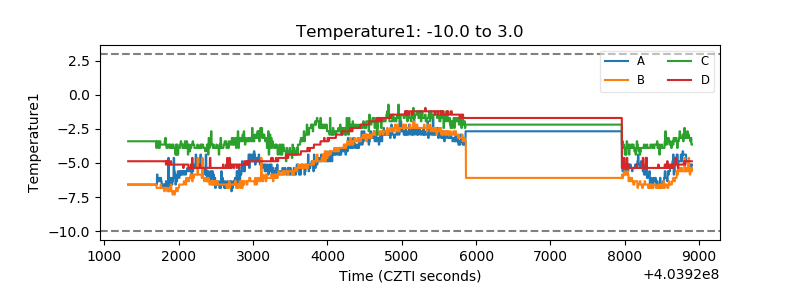 |
| Veto HV Monitor | 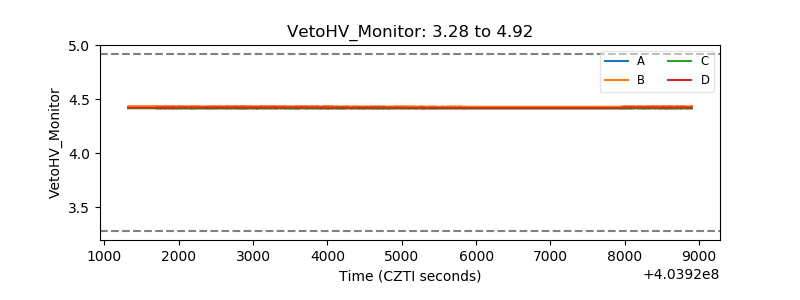 |
| Veto LLD | 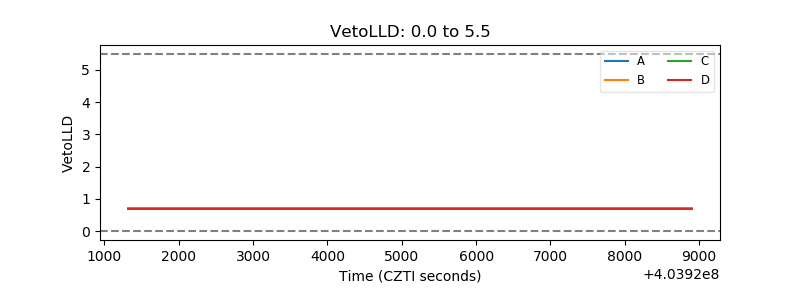 |
| Alpha Counter | 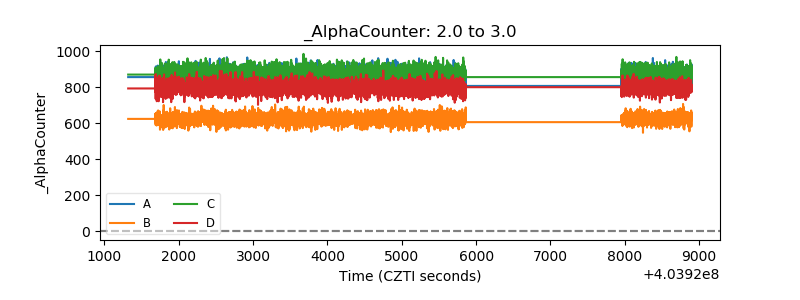 |
| _CPM_Rate | 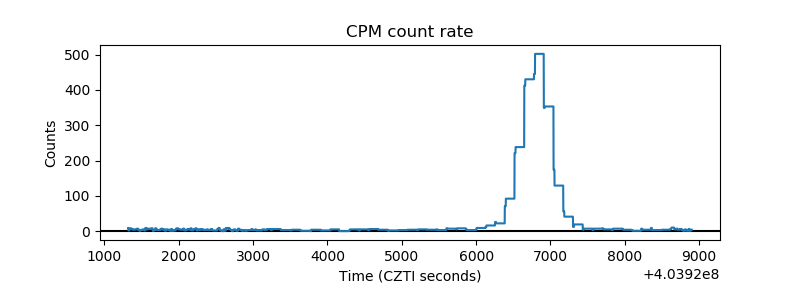 |
| CZT Counter | 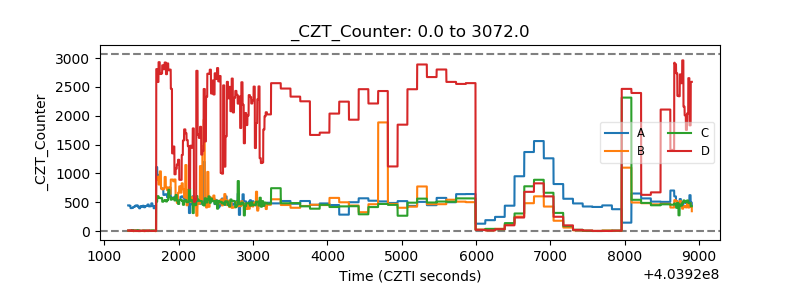 |
| +2.5 Volts monitor | 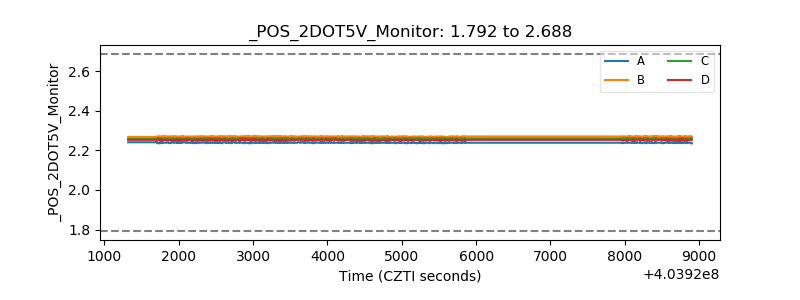 |
| +5 Volts monitor | 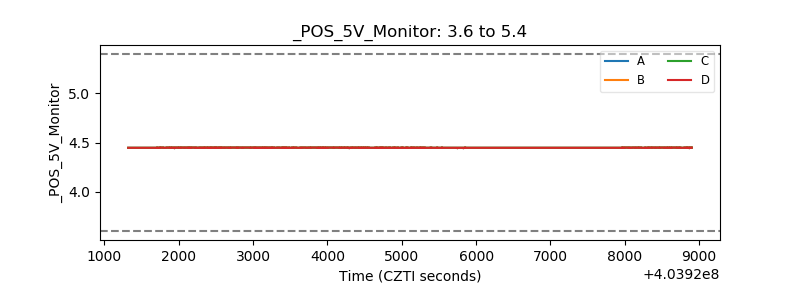 |
| _ROLL_ROT | 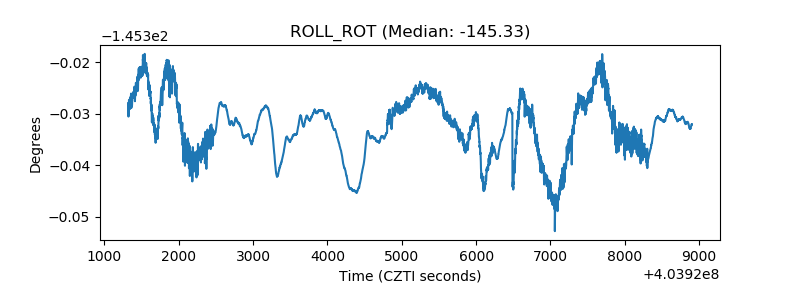 |
| _Roll_DEC | 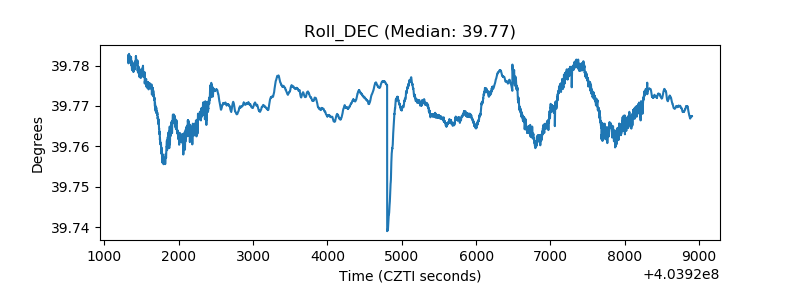 |
| _Roll_RA | 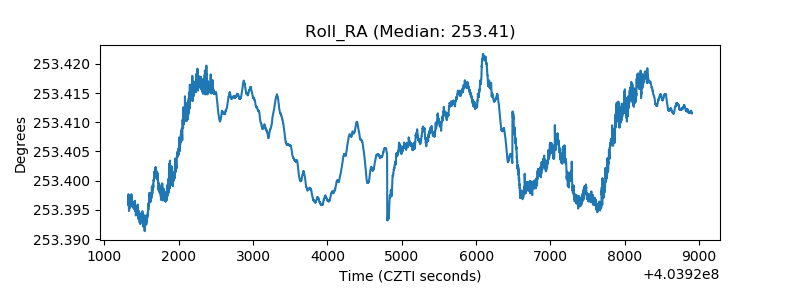 |
| Veto Counter | 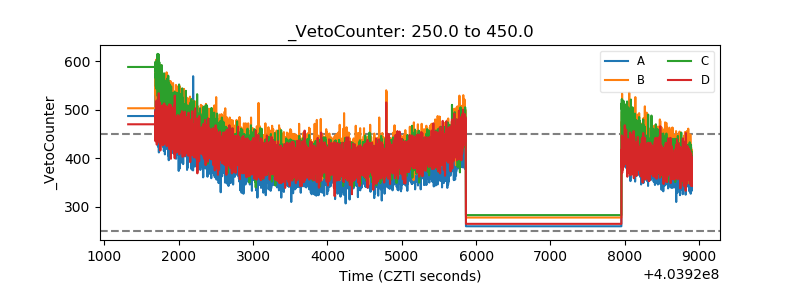 |