| Param | Original file | Final file |
|---|---|---|
| Filename | modeM0/AS1A07_145T01_9000005370_38175cztM0_level2.fits | modeM0/AS1A07_145T01_9000005370_38175cztM0_level2_quad_clean.evt |
| Size (bytes) | 501,675,840 | 81,305,280 |
| Size | 478.4 MB | 77.5 MB |
| Events in quadrant A | 2,742,096 | 612,385 |
| Events in quadrant B | 2,457,456 | 631,831 |
| Events in quadrant C | 2,633,600 | 603,310 |
| Events in quadrant D | 10,332,105 | 250,334 |
| Mode M9 | |||
|---|---|---|---|
| Quadrant | BADHDUFLAG | Total packets | Discarded packets |
| A | 0 | 34 | 0 |
| B | 0 | 34 | 0 |
| C | 0 | 34 | 0 |
| D | 0 | 35 | 0 |
| Mode SS | |||
|---|---|---|---|
| Quadrant | BADHDUFLAG | Total packets | Discarded packets |
| A | 0 | 104 | 0 |
| B | 0 | 104 | 0 |
| C | 0 | 104 | 0 |
| D | 0 | 104 | 0 |
| Mode M0 | |||
|---|---|---|---|
| Quadrant | BADHDUFLAG | Total packets | Discarded packets |
| A | 0 | 11209 | 3 |
| B | 0 | 10735 | 2 |
| C | 0 | 10898 | 2 |
| D | 0 | 34292 | 2 |
| Quadrant | Total seconds | Saturated seconds | Saturation percentage |
|---|---|---|---|
| A | 5204 | 15 | 0.288240% |
| B | 5204 | 16 | 0.307456% |
| C | 5204 | 17 | 0.326672% |
| D | 5204 | 3035 | 58.320523% |
Noise dominated data is calculated using 1-second bins in cleaned event files. If a bin has >2000 counts, and if more than 50% of those come from <1% of pixels, then it is considered to be noise-dominated and hence unusable.
| Quadrant | # 1 sec bins | Bins with >0 counts | Bins with >2000 counts | High rate bins dominated by noise | Noise dominated (total time) | Noise dominated (detector-on time) | Marked lightcurve |
|---|---|---|---|---|---|---|---|
| A | 7117 | 5204 | 6 | 6 | 0.08% | 0.12% | 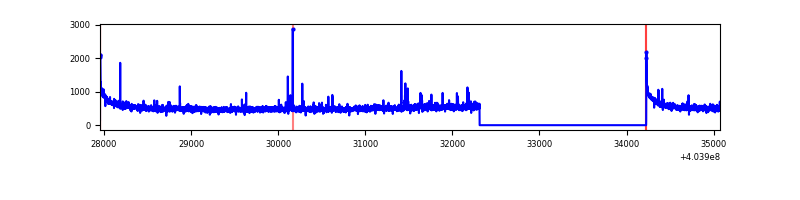 |
| B | 7117 | 5205 | 5 | 5 | 0.07% | 0.10% | 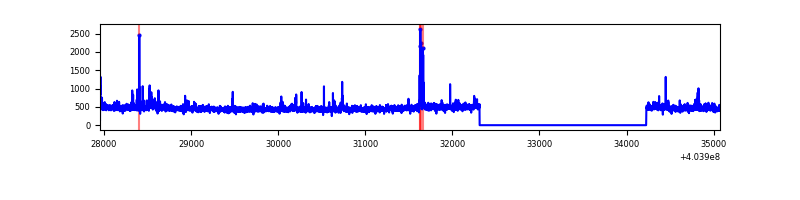 |
| C | 7116 | 5204 | 13 | 13 | 0.18% | 0.25% | 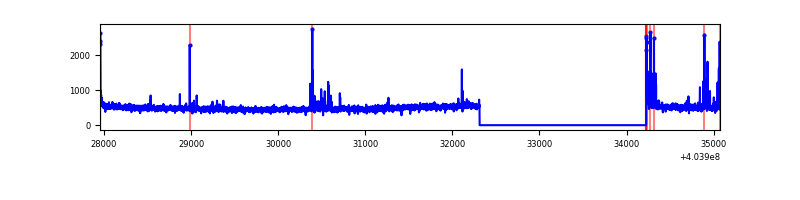 |
| D | 7116 | 5203 | 3220 | 3220 | 45.25% | 61.89% | 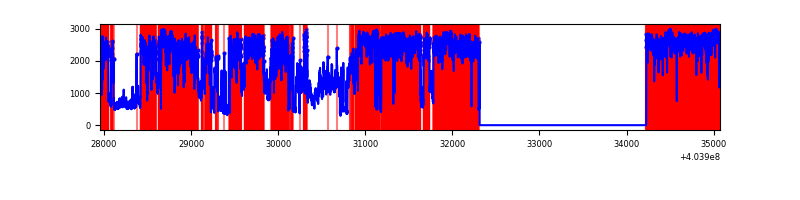 |
Top three noisy pixels from each quadrant. If the there are fewer than three noisy pixels in the level2.evt file, extra rows are filled as -1
| Pixel properties | Quadrant properties | ||||||
|---|---|---|---|---|---|---|---|
| Quadrant | DetID | PixID | Counts | Sigma | Mean | Median | Sigma |
| A | 10 | 83 | 361099 | 3002.27 | 595 | 584 | 120.1 |
| A | 12 | 189 | 36681 | 300.61 | 595 | 584 | 120.1 |
| A | 9 | 143 | 32356 | 264.59 | 595 | 584 | 120.1 |
| B | 4 | 171 | 40939 | 350.57 | 592 | 576 | 115.1 |
| B | 15 | 85 | 37116 | 317.37 | 592 | 576 | 115.1 |
| B | 0 | 229 | 15717 | 131.51 | 592 | 576 | 115.1 |
| C | 15 | 214 | 218631 | 1623.65 | 575 | 580 | 134.3 |
| C | 14 | 254 | 81804 | 604.81 | 575 | 580 | 134.3 |
| C | 3 | 233 | 34949 | 255.92 | 575 | 580 | 134.3 |
| D | 12 | 227 | 8242316 | 75552.0 | 446 | 435 | 109.1 |
| D | 12 | 235 | 123383 | 1127.04 | 446 | 435 | 109.1 |
| D | 13 | 249 | 70014 | 637.82 | 446 | 435 | 109.1 |
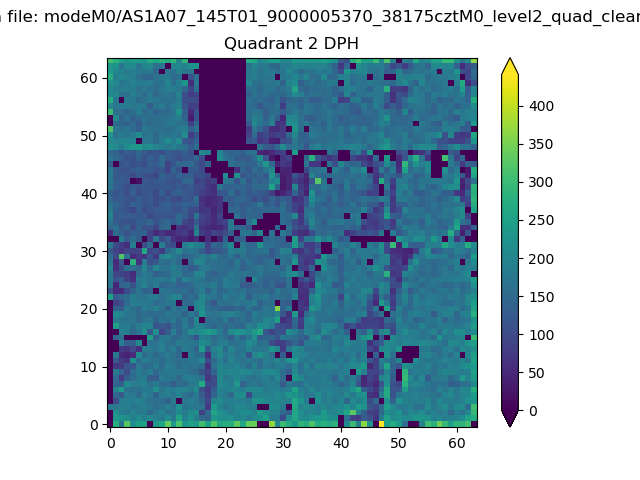
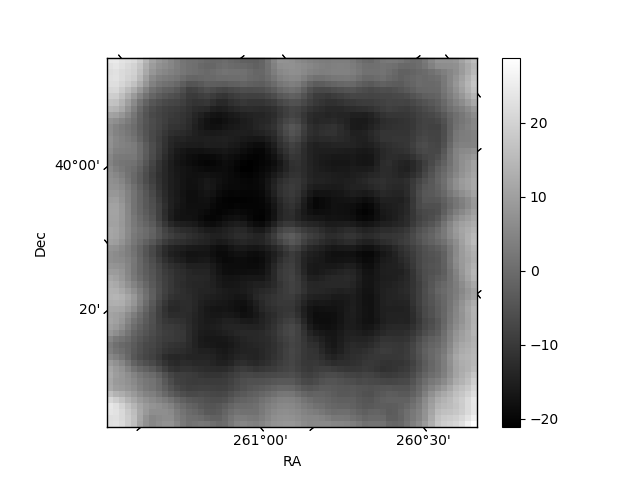
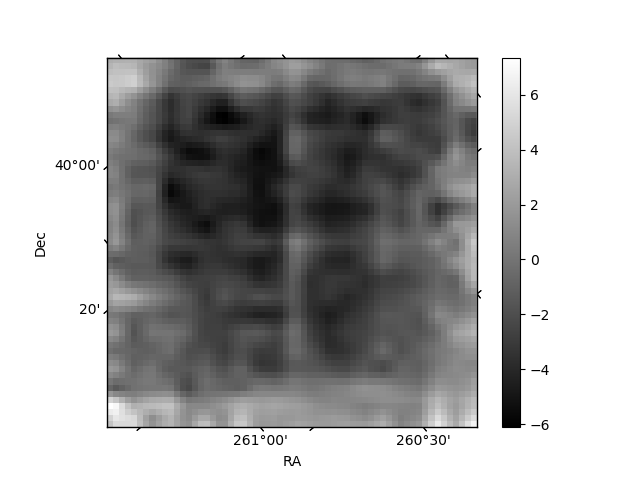
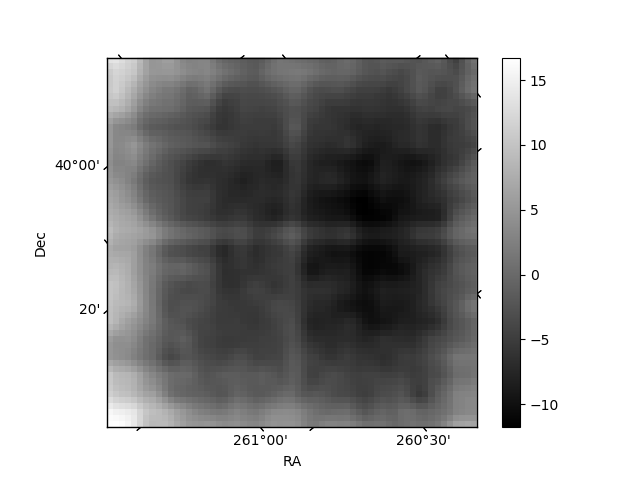
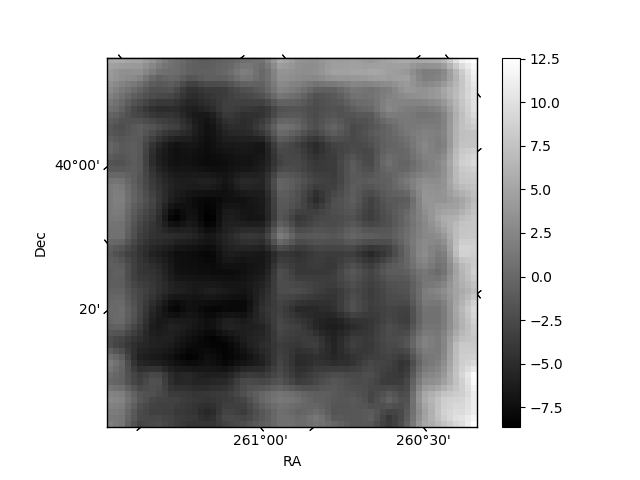
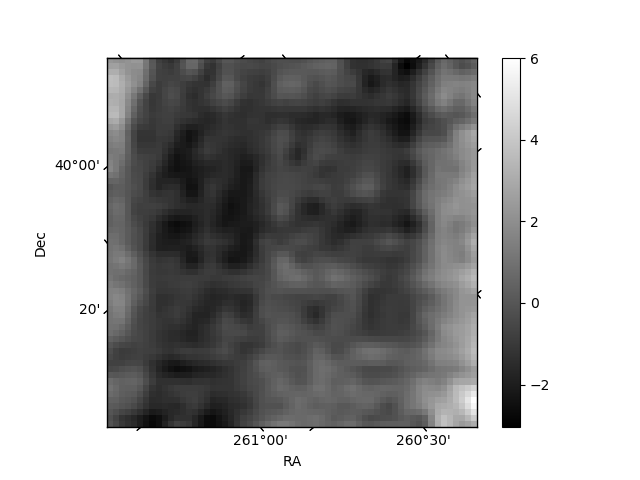
Histogram calculated using DETX and DETY for each event in the final _common_clean file
| Quadrant A | 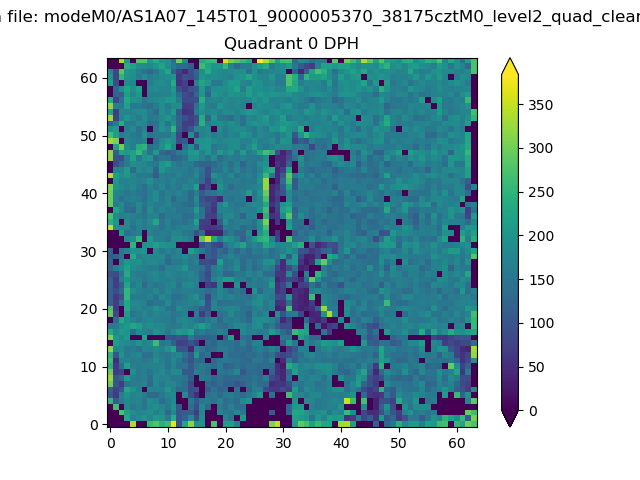 |
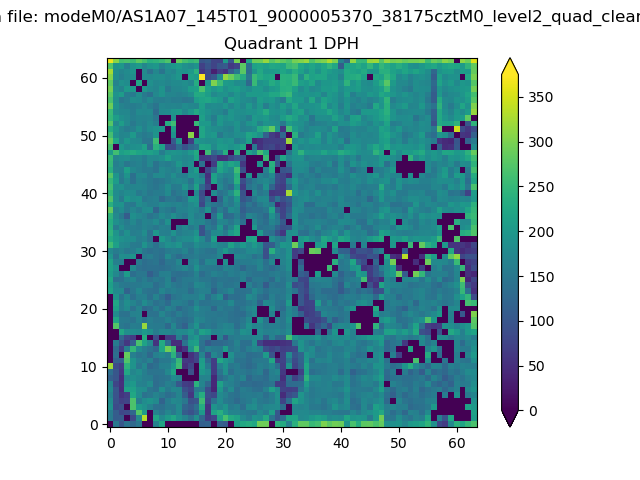 |
Quadrant B |
|---|---|---|---|
| Quadrant D | 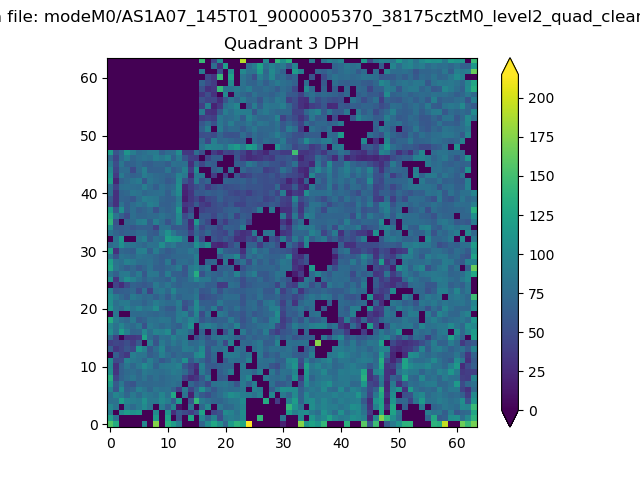 |
 |
Quadrant C |
| Plot type | Count rate plots | Images |
|---|---|---|
| Comparison with Poisson distribution Blue bars denote a histogram of data divided into 1 sec bins. Red curve is a Poisson curve with rate = median count rate of data. |
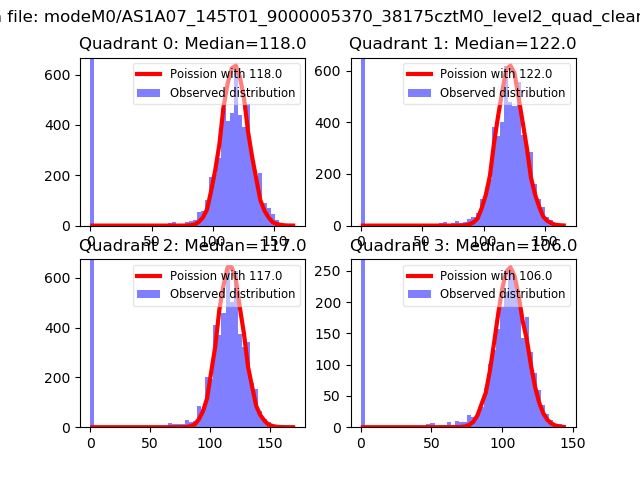 |
 |
| Quadrant-wise count rates Data is divided into 100 sec bins |
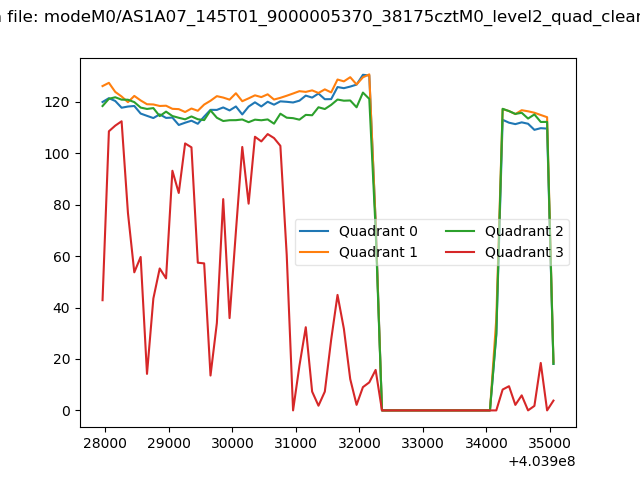 |
|
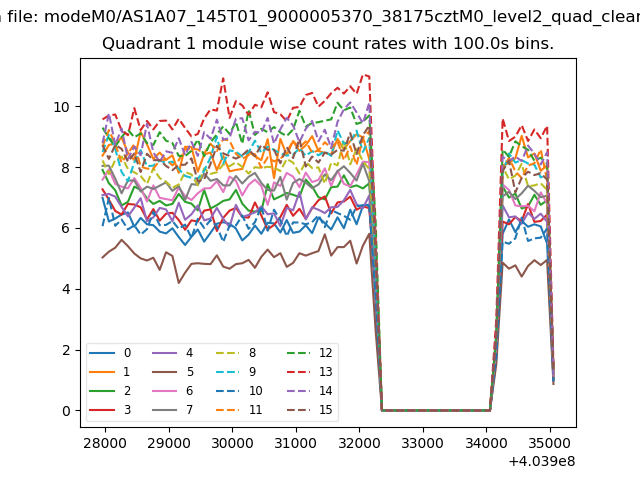
| Module-wise count rates for Quadrant A Data is divided into 100 sec bins |
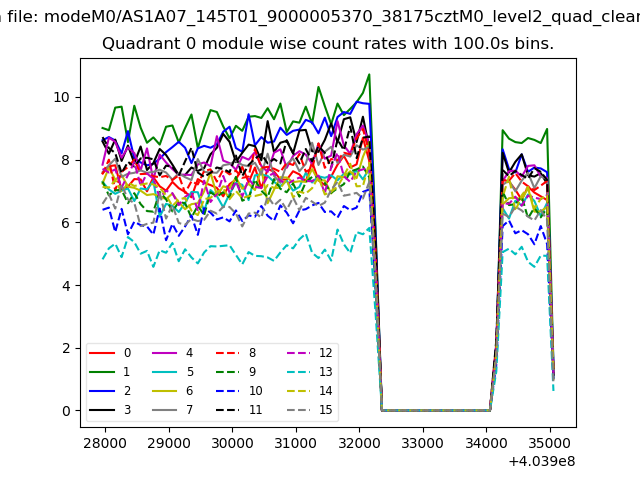 |
 |
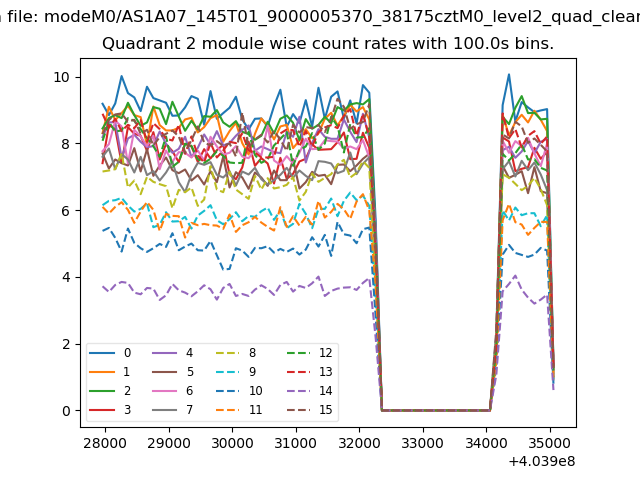
| Module-wise count rates for Quadrant B Data is divided into 100 sec bins |
 |
 |
| Module-wise count rates for Quadrant C Data is divided into 100 sec bins |
 |
 |
| Module-wise count rates for Quadrant D Data is divided into 100 sec bins |
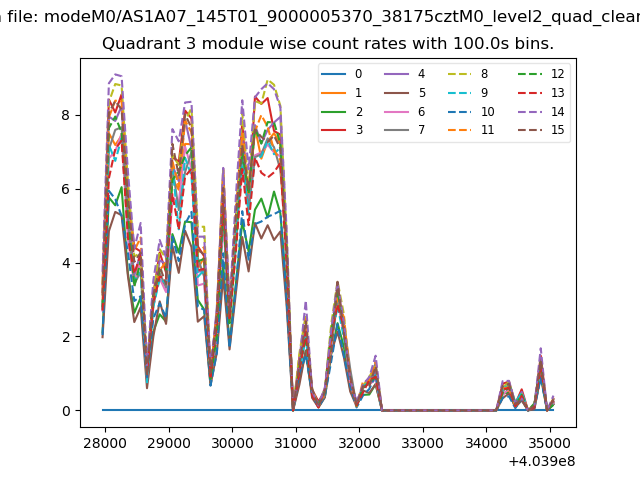 |
 |
| Parameter | Plot |
|---|---|
| CZT HV Monitor | 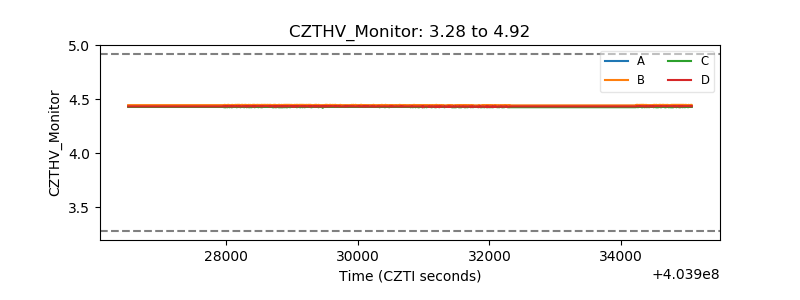 |
| D_VDD | 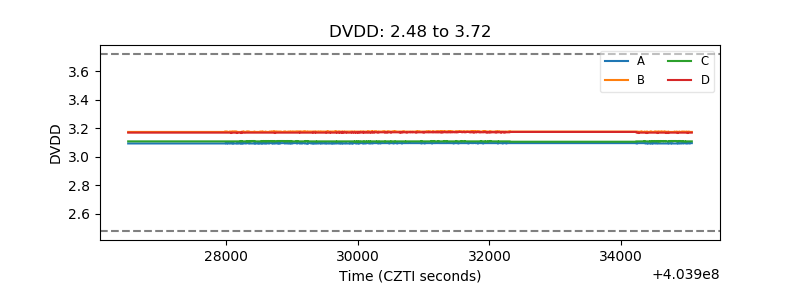 |
| Temperature 1 | 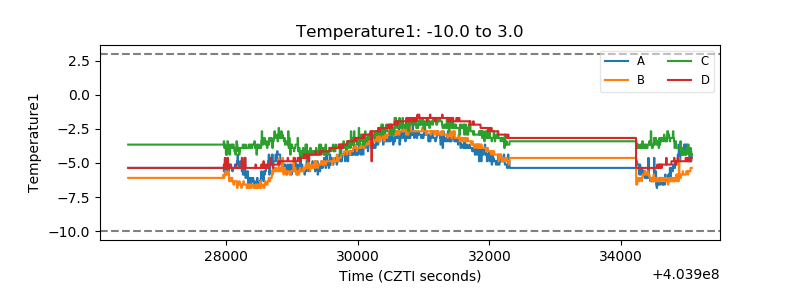 |
| Veto HV Monitor | 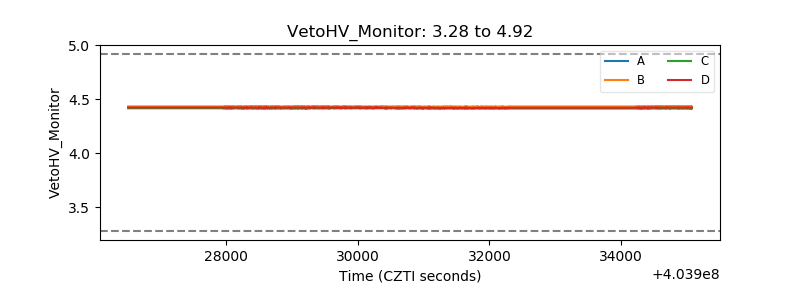 |
| Veto LLD | 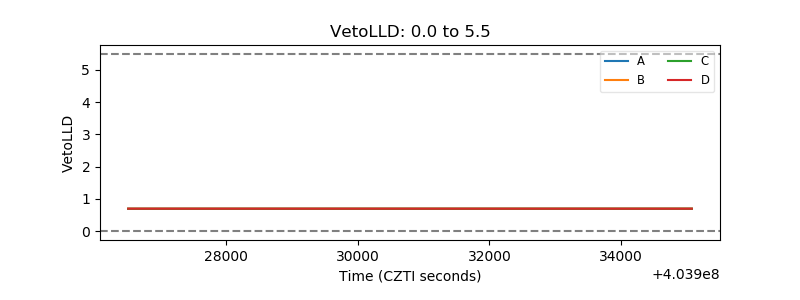 |
| Alpha Counter | 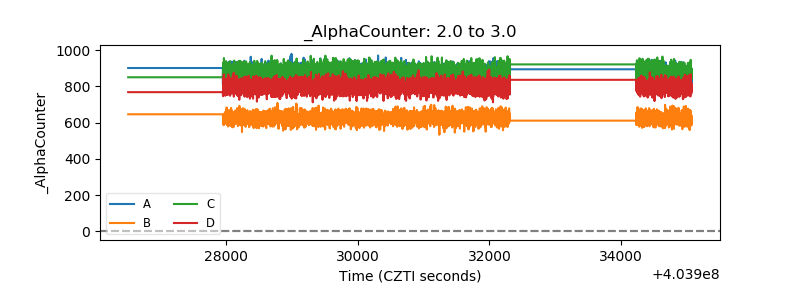 |
| _CPM_Rate | 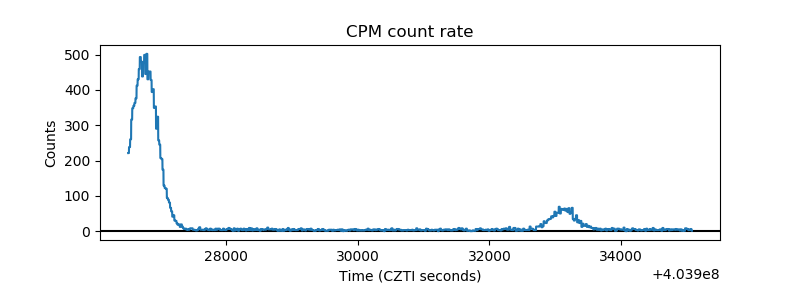 |
| CZT Counter | 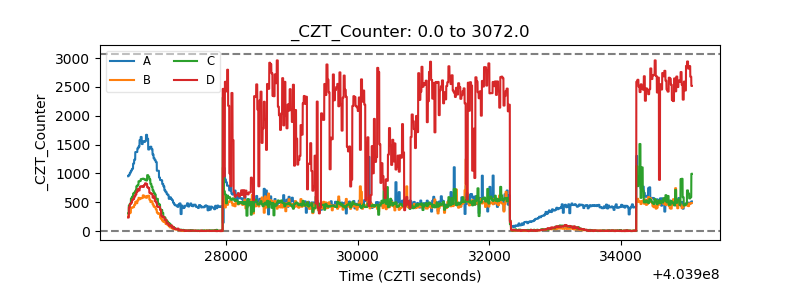 |
| +2.5 Volts monitor | 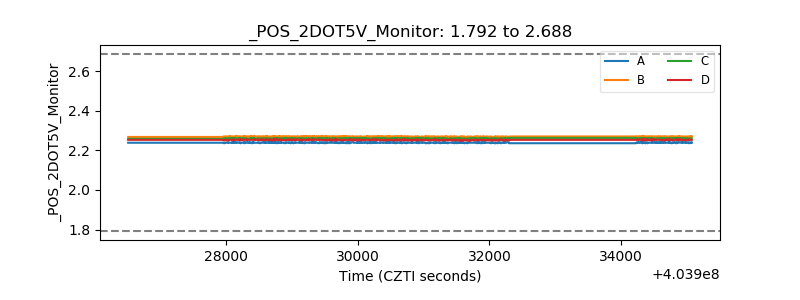 |
| +5 Volts monitor | 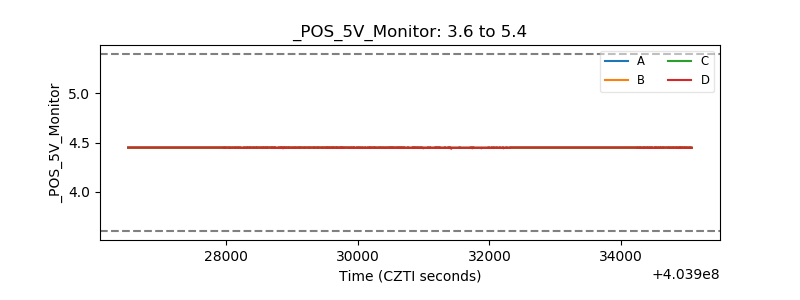 |
| _ROLL_ROT | 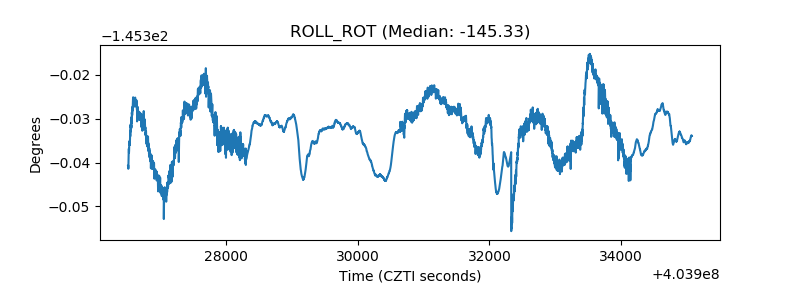 |
| _Roll_DEC | 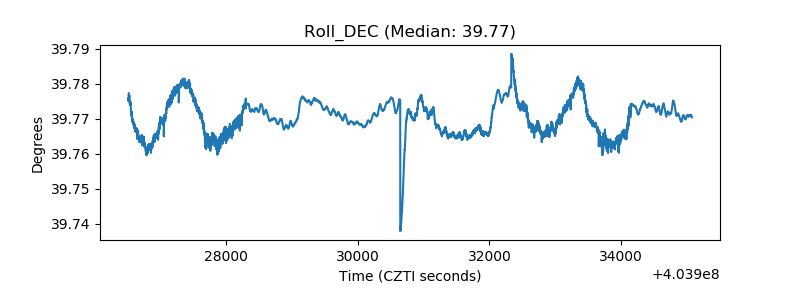 |
| _Roll_RA | 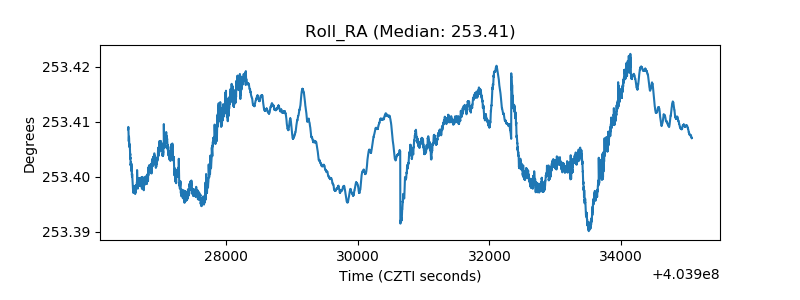 |
| Veto Counter | 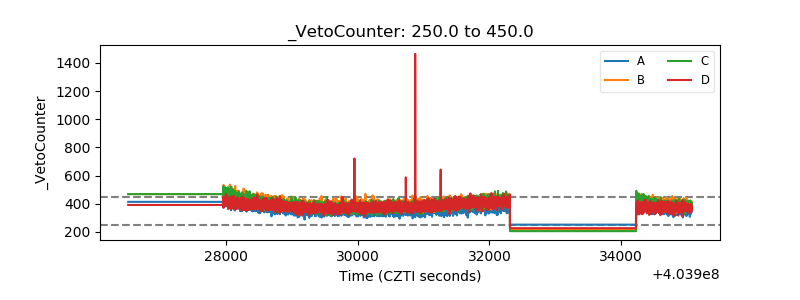 |