| Param | Original file | Final file |
|---|---|---|
| Filename | modeM0/AS1A07_145T01_9000005370_38176cztM0_level2.fits | modeM0/AS1A07_145T01_9000005370_38176cztM0_level2_quad_clean.evt |
| Size (bytes) | 513,866,880 | 87,505,920 |
| Size | 490.1 MB | 83.5 MB |
| Events in quadrant A | 2,855,608 | 633,854 |
| Events in quadrant B | 2,937,160 | 642,319 |
| Events in quadrant C | 3,937,978 | 588,007 |
| Events in quadrant D | 8,863,205 | 400,572 |
| Mode M9 | |||
|---|---|---|---|
| Quadrant | BADHDUFLAG | Total packets | Discarded packets |
| A | 0 | 16 | 0 |
| B | 0 | 16 | 0 |
| C | 0 | 16 | 0 |
| D | 0 | 17 | 0 |
| Mode SS | |||
|---|---|---|---|
| Quadrant | BADHDUFLAG | Total packets | Discarded packets |
| A | 0 | 110 | 0 |
| B | 0 | 110 | 0 |
| C | 0 | 110 | 0 |
| D | 0 | 110 | 0 |
| Mode M0 | |||
|---|---|---|---|
| Quadrant | BADHDUFLAG | Total packets | Discarded packets |
| A | 0 | 11742 | 3 |
| B | 0 | 12465 | 2 |
| C | 0 | 15036 | 2 |
| D | 0 | 30166 | 2 |
| Quadrant | Total seconds | Saturated seconds | Saturation percentage |
|---|---|---|---|
| A | 5507 | 18 | 0.326857% |
| B | 5507 | 96 | 1.743236% |
| C | 5507 | 389 | 7.063737% |
| D | 5507 | 1865 | 33.865989% |
Noise dominated data is calculated using 1-second bins in cleaned event files. If a bin has >2000 counts, and if more than 50% of those come from <1% of pixels, then it is considered to be noise-dominated and hence unusable.
| Quadrant | # 1 sec bins | Bins with >0 counts | Bins with >2000 counts | High rate bins dominated by noise | Noise dominated (total time) | Noise dominated (detector-on time) | Marked lightcurve |
|---|---|---|---|---|---|---|---|
| A | 7089 | 5506 | 7 | 7 | 0.10% | 0.13% | 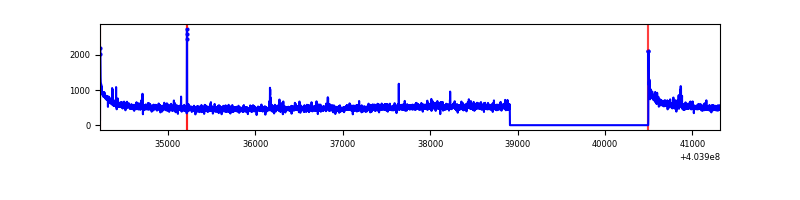 |
| B | 7089 | 5506 | 47 | 47 | 0.66% | 0.85% | 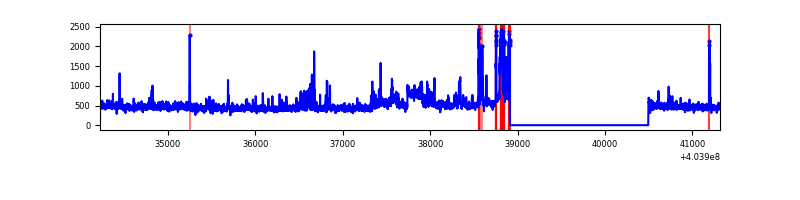 |
| C | 7089 | 5506 | 356 | 356 | 5.02% | 6.47% | 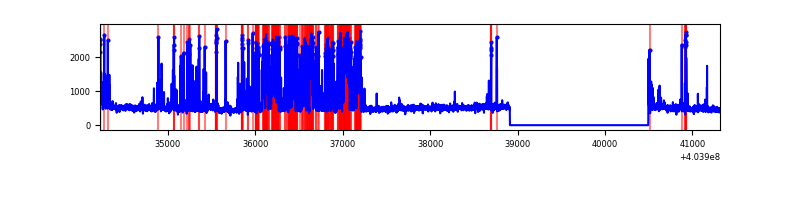 |
| D | 7089 | 5506 | 1990 | 1990 | 28.07% | 36.14% |  |
Top three noisy pixels from each quadrant. If the there are fewer than three noisy pixels in the level2.evt file, extra rows are filled as -1
| Pixel properties | Quadrant properties | ||||||
|---|---|---|---|---|---|---|---|
| Quadrant | DetID | PixID | Counts | Sigma | Mean | Median | Sigma |
| A | 10 | 83 | 376968 | 2976.77 | 623 | 610 | 126.4 |
| A | 12 | 189 | 35266 | 274.11 | 623 | 610 | 126.4 |
| A | 9 | 143 | 16963 | 129.34 | 623 | 610 | 126.4 |
| B | 5 | 184 | 192474 | 1616.76 | 613 | 597 | 118.7 |
| B | 12 | 18 | 184848 | 1552.51 | 613 | 597 | 118.7 |
| B | 0 | 183 | 39146 | 324.82 | 613 | 597 | 118.7 |
| C | 14 | 254 | 1384096 | 10102.72 | 586 | 591 | 136.9 |
| C | 15 | 214 | 225072 | 1639.22 | 586 | 591 | 136.9 |
| C | 3 | 233 | 20249 | 143.55 | 586 | 591 | 136.9 |
| D | 12 | 227 | 6291846 | 48714.99 | 525 | 510 | 129.1 |
| D | 12 | 217 | 204097 | 1576.41 | 525 | 510 | 129.1 |
| D | 7 | 55 | 151413 | 1168.47 | 525 | 510 | 129.1 |
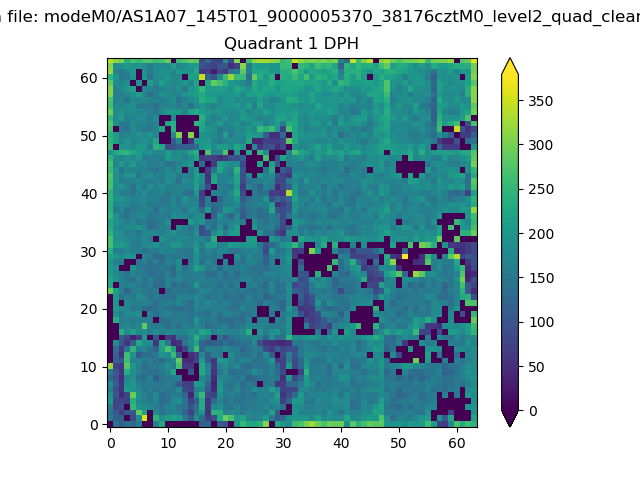
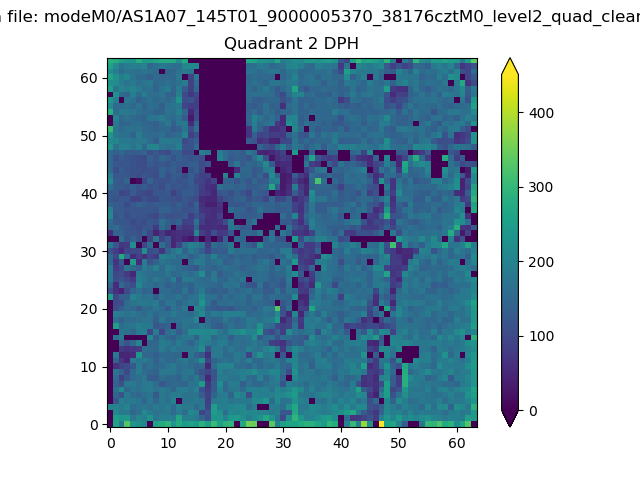
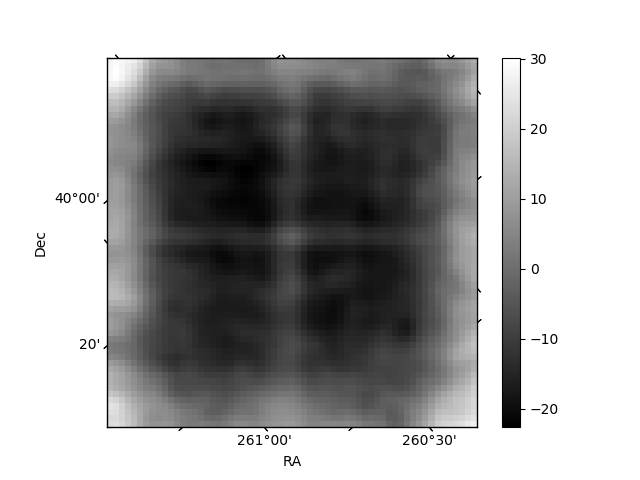
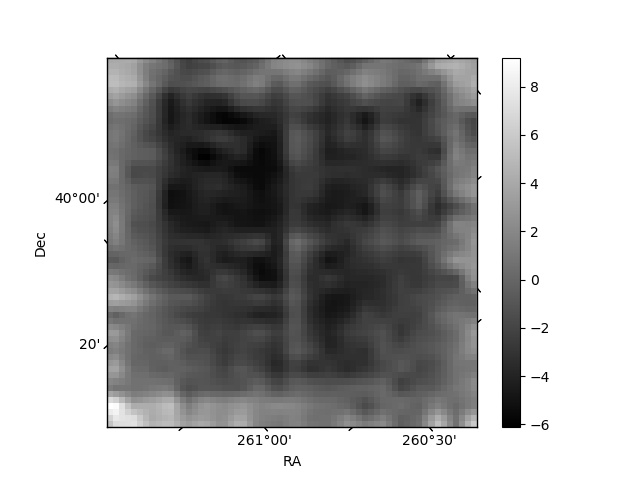
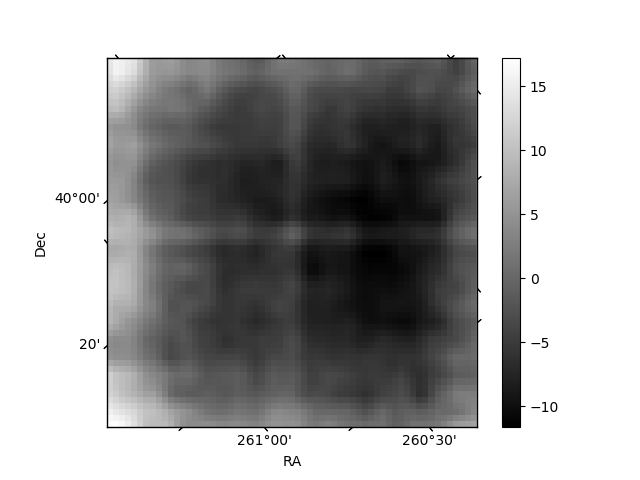
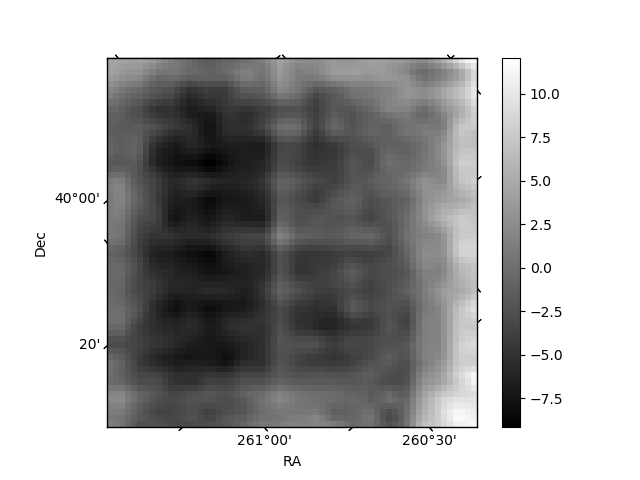
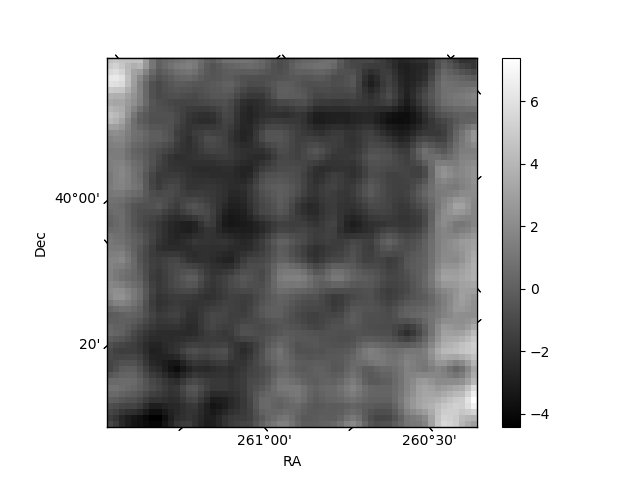
Histogram calculated using DETX and DETY for each event in the final _common_clean file
| Quadrant A | 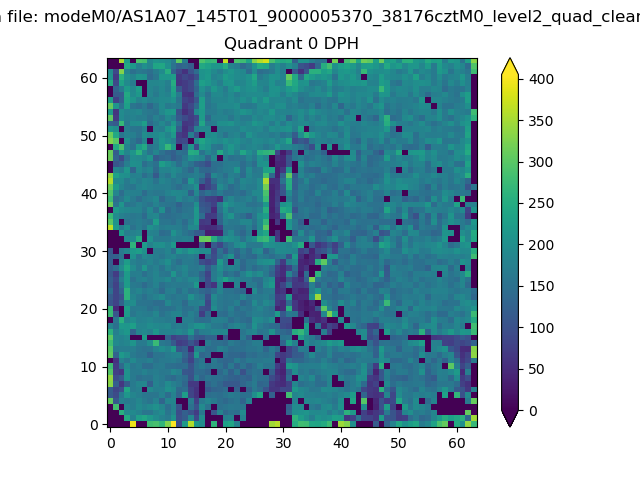 |
 |
Quadrant B |
|---|---|---|---|
| Quadrant D | 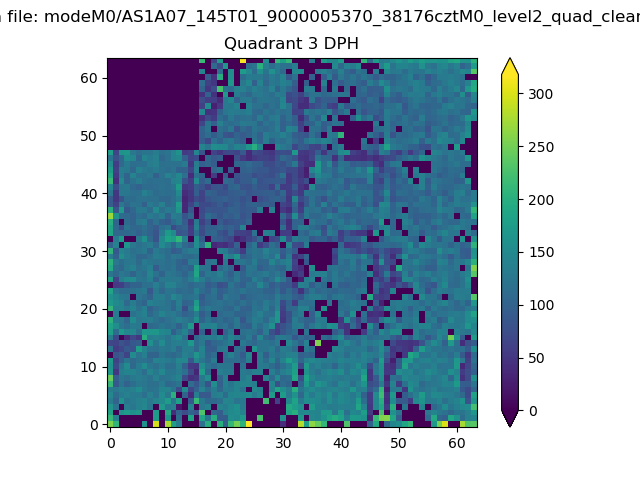 |
 |
Quadrant C |
| Plot type | Count rate plots | Images |
|---|---|---|
| Comparison with Poisson distribution Blue bars denote a histogram of data divided into 1 sec bins. Red curve is a Poisson curve with rate = median count rate of data. |
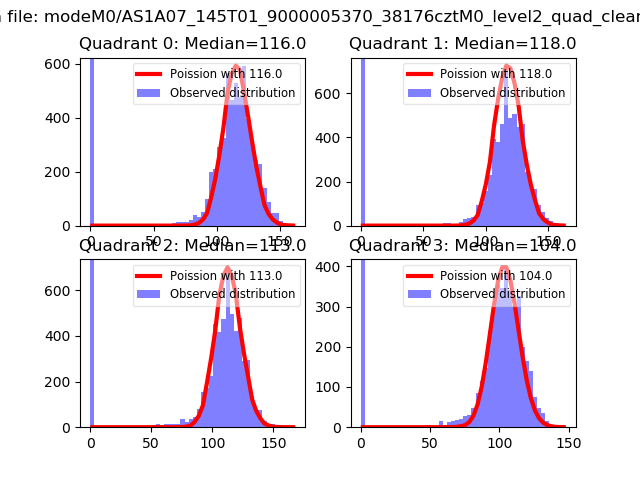 |
 |
| Quadrant-wise count rates Data is divided into 100 sec bins |
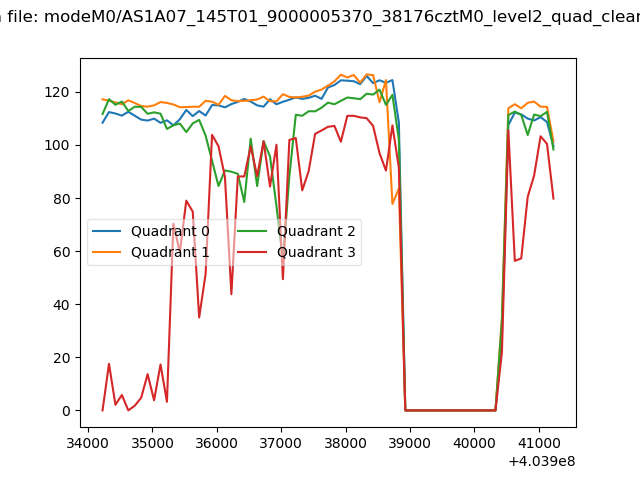 |
|
| Module-wise count rates for Quadrant A Data is divided into 100 sec bins |
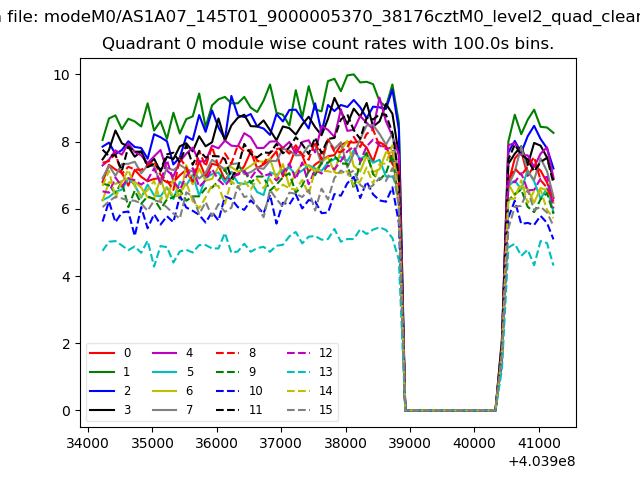 |
 |
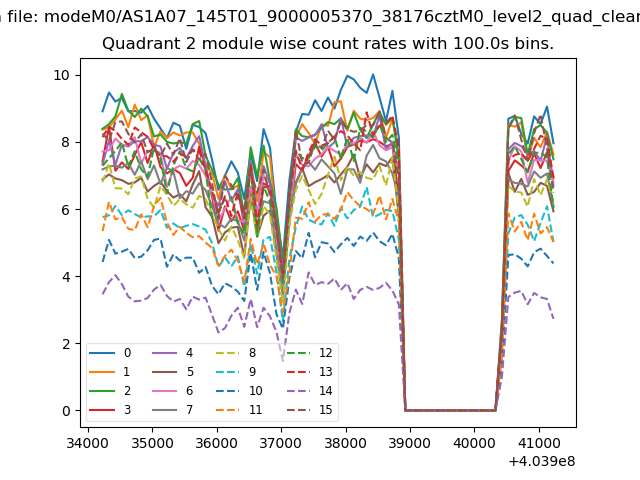
| Module-wise count rates for Quadrant B Data is divided into 100 sec bins |
 |
 |
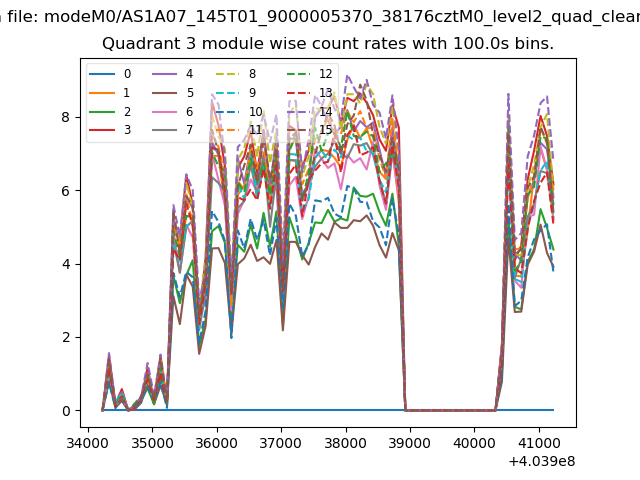
| Module-wise count rates for Quadrant C Data is divided into 100 sec bins |
 |
 |
| Module-wise count rates for Quadrant D Data is divided into 100 sec bins |
 |
 |
| Parameter | Plot |
|---|---|
| CZT HV Monitor | 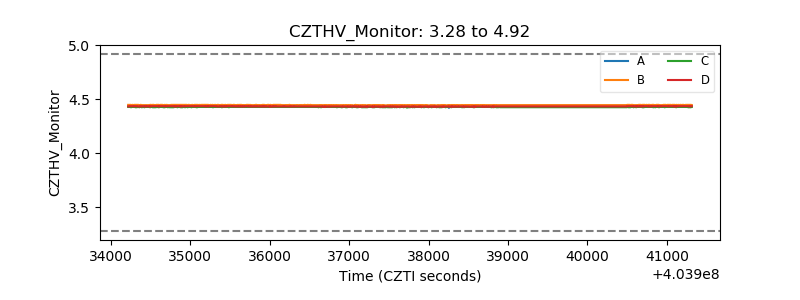 |
| D_VDD | 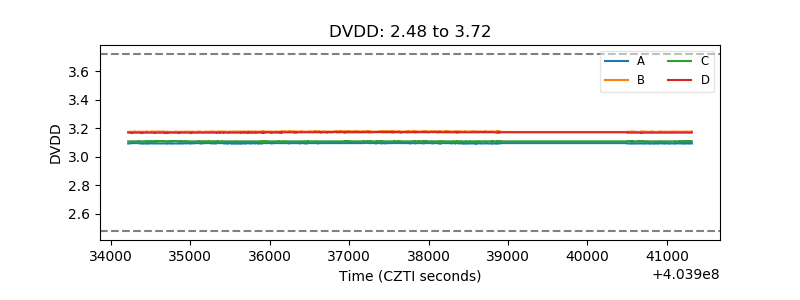 |
| Temperature 1 | 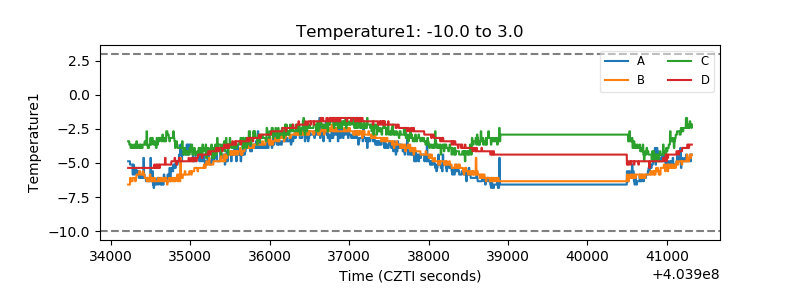 |
| Veto HV Monitor |  |
| Veto LLD | 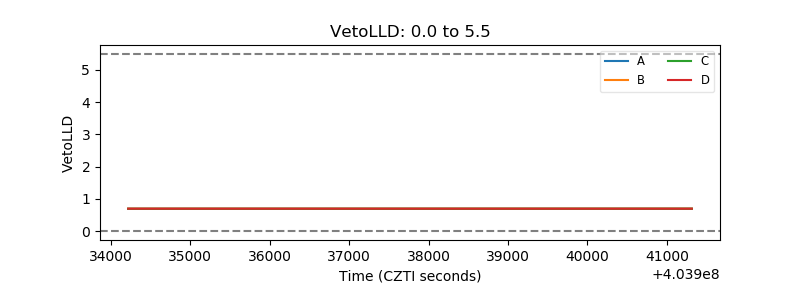 |
| Alpha Counter | 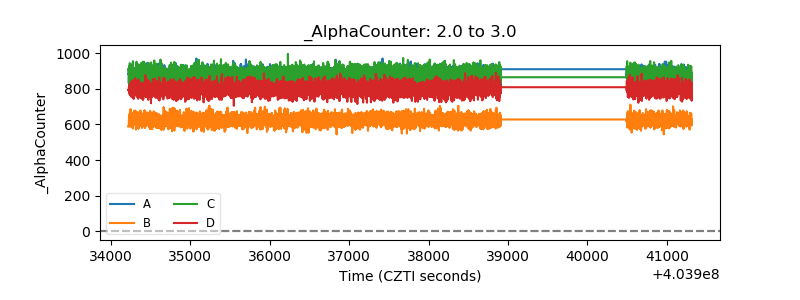 |
| _CPM_Rate | 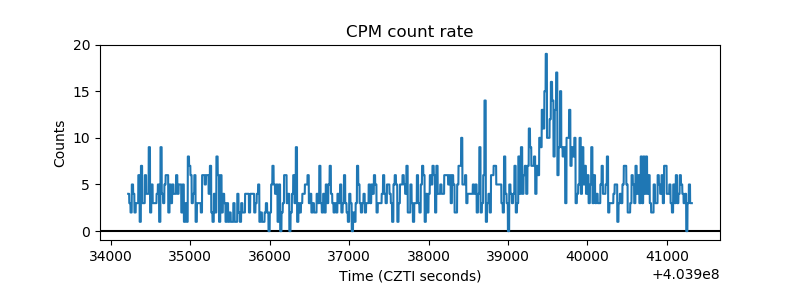 |
| CZT Counter | 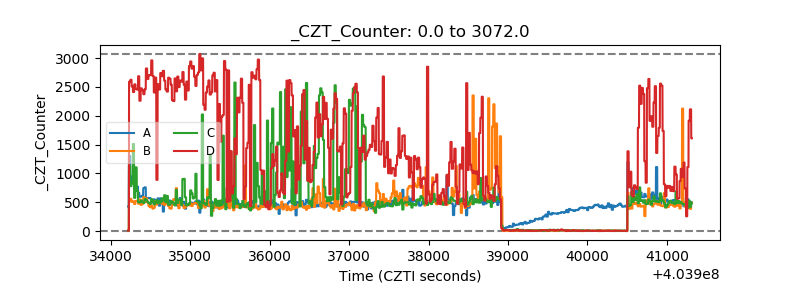 |
| +2.5 Volts monitor | 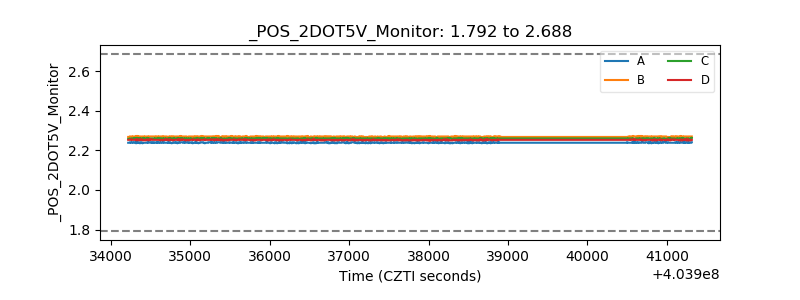 |
| +5 Volts monitor | 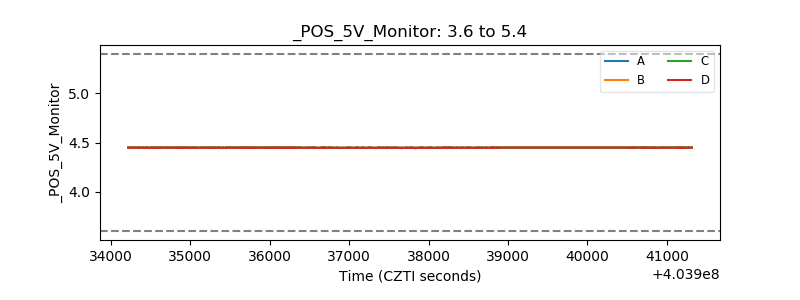 |
| _ROLL_ROT | 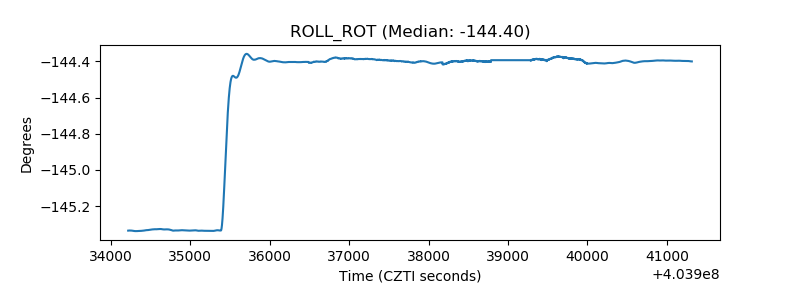 |
| _Roll_DEC | 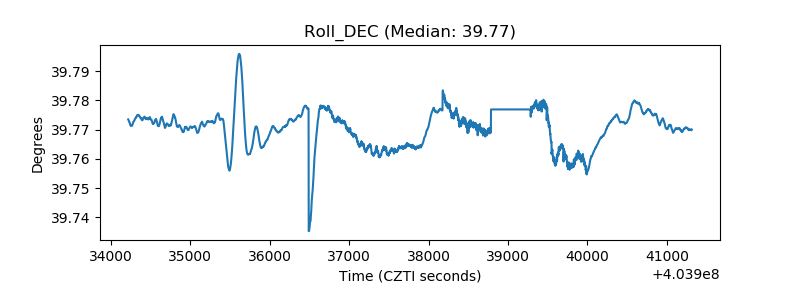 |
| _Roll_RA | 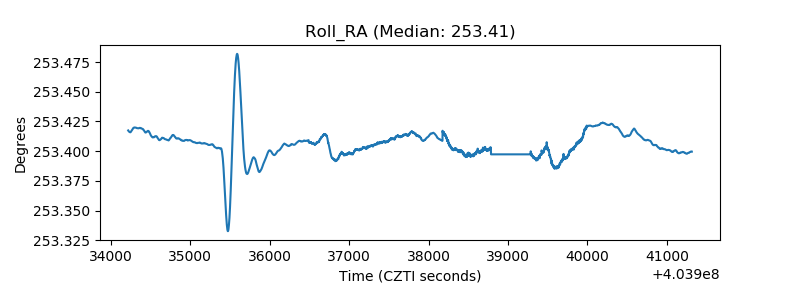 |
| Veto Counter | 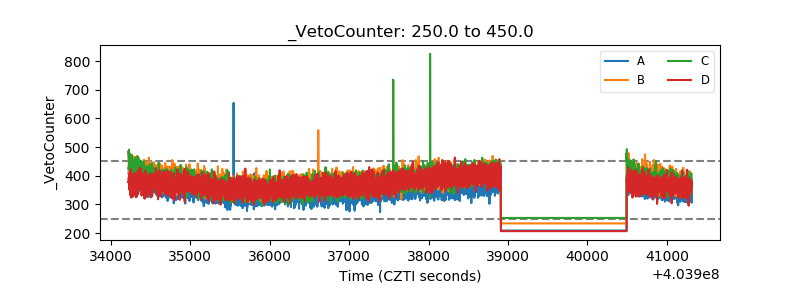 |