| Param | Original file | Final file |
|---|---|---|
| Filename | modeM0/AS1A07_145T01_9000005370_38177cztM0_level2.fits | modeM0/AS1A07_145T01_9000005370_38177cztM0_level2_quad_clean.evt |
| Size (bytes) | 493,018,560 | 91,679,040 |
| Size | 470.2 MB | 87.4 MB |
| Events in quadrant A | 3,024,623 | 659,407 |
| Events in quadrant B | 2,727,237 | 674,720 |
| Events in quadrant C | 2,931,394 | 640,906 |
| Events in quadrant D | 9,117,570 | 396,949 |
| Mode M9 | |||
|---|---|---|---|
| Quadrant | BADHDUFLAG | Total packets | Discarded packets |
| A | 0 | 25 | 0 |
| B | 0 | 25 | 0 |
| C | 0 | 25 | 0 |
| D | 0 | 26 | 0 |
| Mode SS | |||
|---|---|---|---|
| Quadrant | BADHDUFLAG | Total packets | Discarded packets |
| A | 0 | 118 | 0 |
| B | 0 | 118 | 0 |
| C | 0 | 118 | 0 |
| D | 0 | 118 | 0 |
| Mode M0 | |||
|---|---|---|---|
| Quadrant | BADHDUFLAG | Total packets | Discarded packets |
| A | 0 | 12444 | 3 |
| B | 0 | 11956 | 2 |
| C | 0 | 12186 | 2 |
| D | 0 | 31086 | 2 |
| Quadrant | Total seconds | Saturated seconds | Saturation percentage |
|---|---|---|---|
| A | 5775 | 20 | 0.346320% |
| B | 5775 | 31 | 0.536797% |
| C | 5775 | 19 | 0.329004% |
| D | 5775 | 2140 | 37.056277% |
Noise dominated data is calculated using 1-second bins in cleaned event files. If a bin has >2000 counts, and if more than 50% of those come from <1% of pixels, then it is considered to be noise-dominated and hence unusable.
| Quadrant | # 1 sec bins | Bins with >0 counts | Bins with >2000 counts | High rate bins dominated by noise | Noise dominated (total time) | Noise dominated (detector-on time) | Marked lightcurve |
|---|---|---|---|---|---|---|---|
| A | 7146 | 5775 | 8 | 8 | 0.11% | 0.14% | 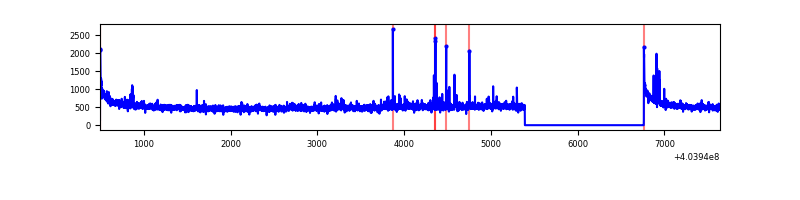 |
| B | 7146 | 5774 | 15 | 15 | 0.21% | 0.26% | 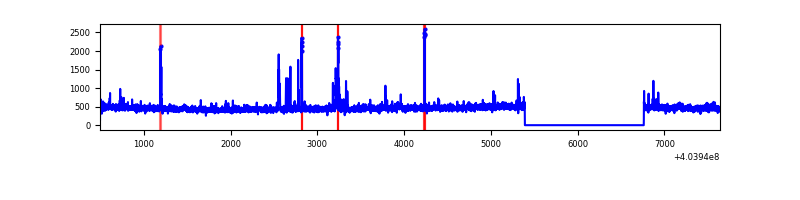 |
| C | 7146 | 5774 | 12 | 12 | 0.17% | 0.21% | 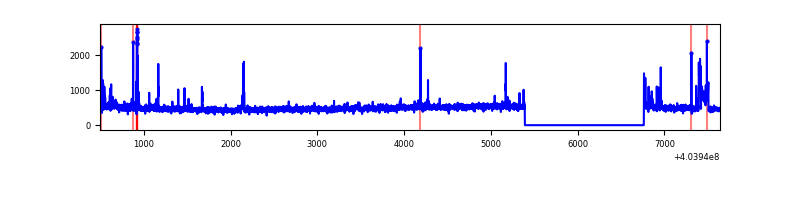 |
| D | 7146 | 5774 | 2285 | 2285 | 31.98% | 39.57% | 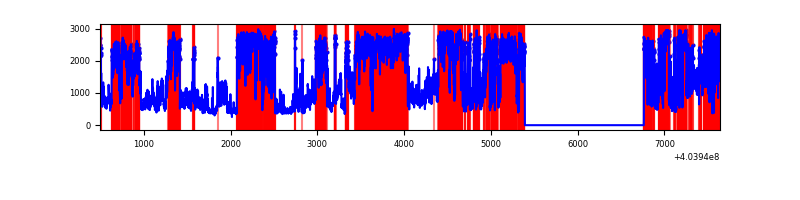 |
Top three noisy pixels from each quadrant. If the there are fewer than three noisy pixels in the level2.evt file, extra rows are filled as -1
| Pixel properties | Quadrant properties | ||||||
|---|---|---|---|---|---|---|---|
| Quadrant | DetID | PixID | Counts | Sigma | Mean | Median | Sigma |
| A | 10 | 83 | 388487 | 2915.04 | 650 | 638 | 133.1 |
| A | 12 | 189 | 55762 | 414.31 | 650 | 638 | 133.1 |
| A | 10 | 255 | 30969 | 227.97 | 650 | 638 | 133.1 |
| B | 15 | 85 | 59687 | 469.09 | 646 | 629 | 125.9 |
| B | 4 | 171 | 50592 | 396.85 | 646 | 629 | 125.9 |
| B | 0 | 229 | 21539 | 166.08 | 646 | 629 | 125.9 |
| C | 15 | 214 | 243234 | 1636.79 | 631 | 634 | 148.2 |
| C | 14 | 254 | 175431 | 1179.33 | 631 | 634 | 148.2 |
| C | 3 | 233 | 40302 | 267.63 | 631 | 634 | 148.2 |
| D | 12 | 227 | 6555836 | 48366.49 | 547 | 532 | 135.5 |
| D | 12 | 235 | 139339 | 1024.15 | 547 | 532 | 135.5 |
| D | 7 | 55 | 97956 | 718.82 | 547 | 532 | 135.5 |
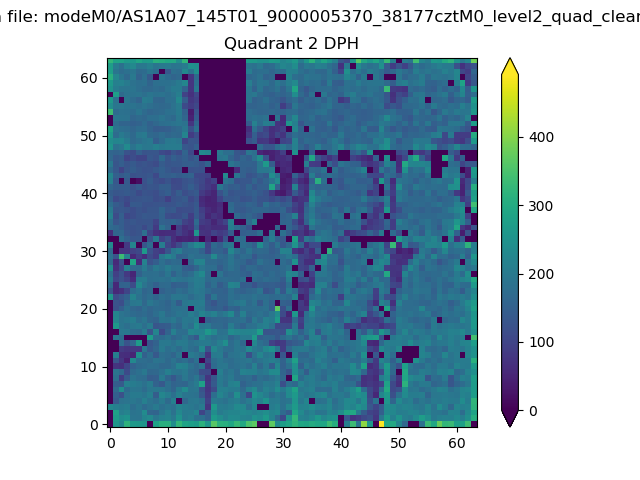
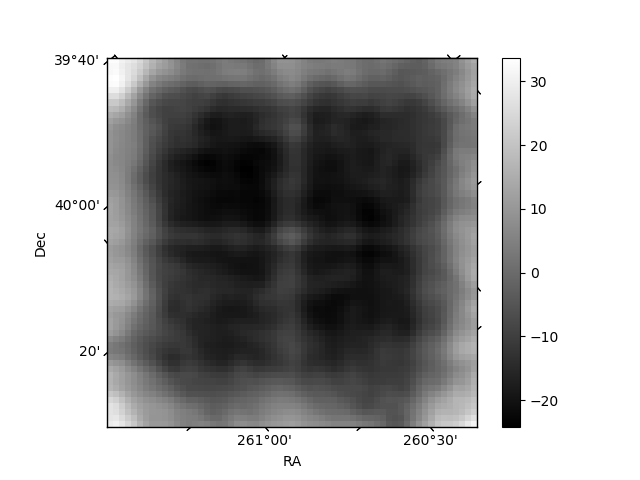
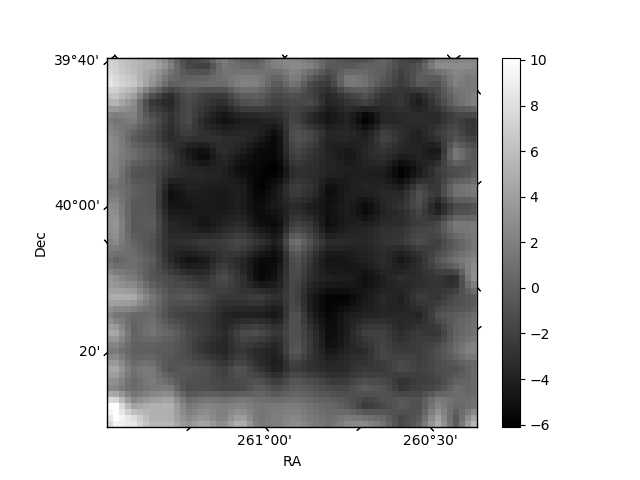
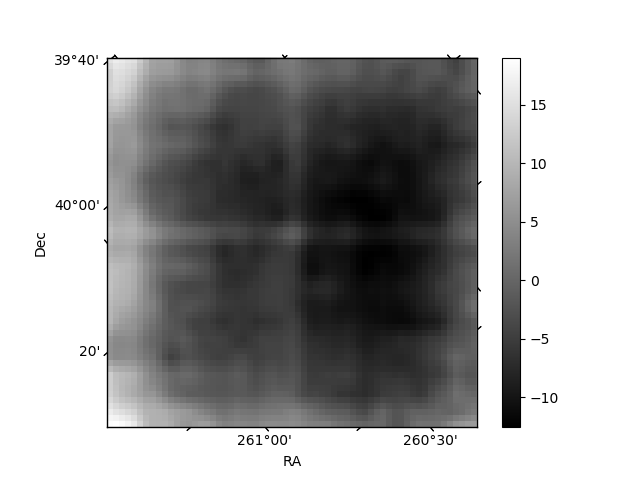
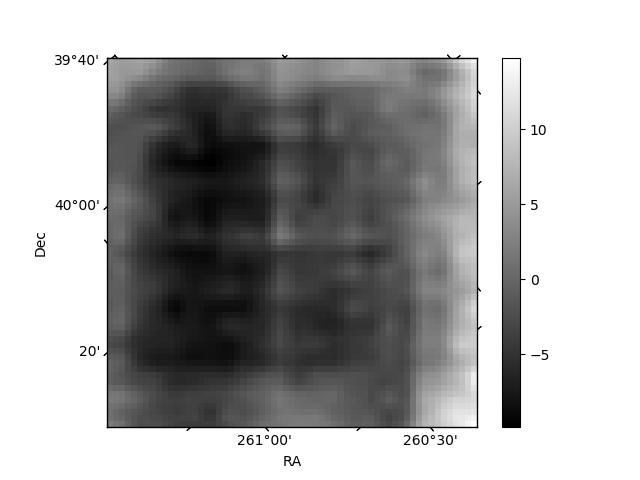
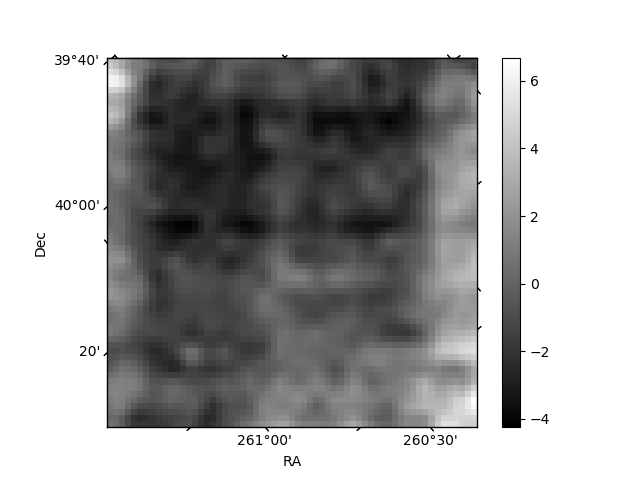
Histogram calculated using DETX and DETY for each event in the final _common_clean file
| Quadrant A | 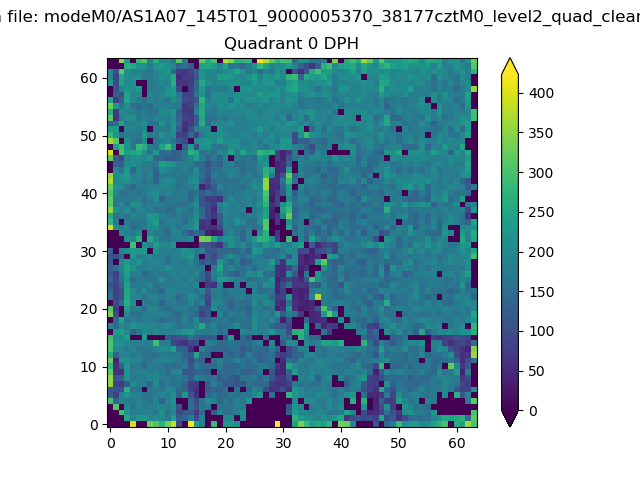 |
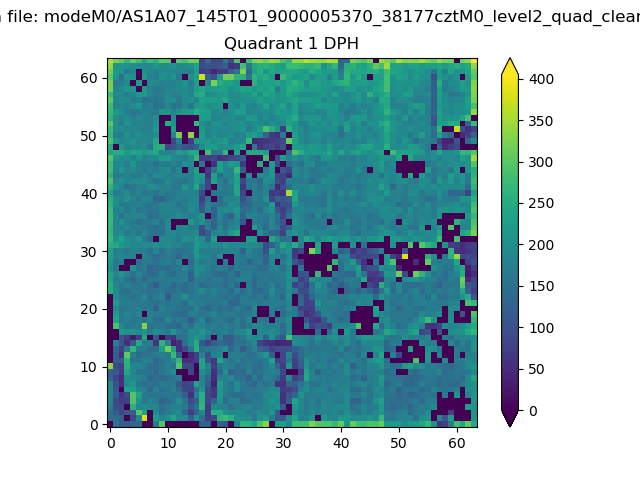 |
Quadrant B |
|---|---|---|---|
| Quadrant D | 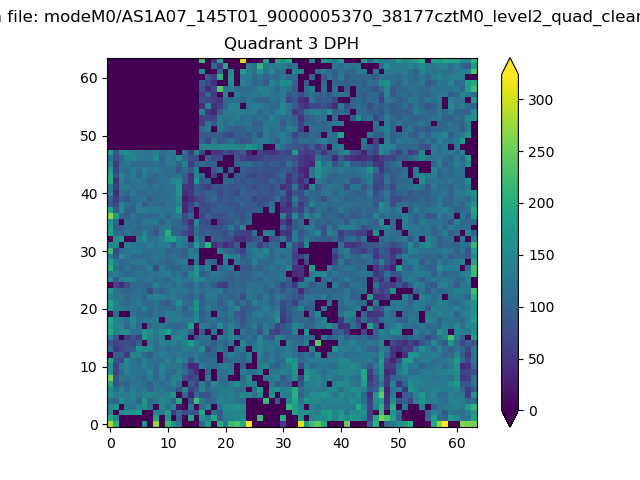 |
 |
Quadrant C |
| Plot type | Count rate plots | Images |
|---|---|---|
| Comparison with Poisson distribution Blue bars denote a histogram of data divided into 1 sec bins. Red curve is a Poisson curve with rate = median count rate of data. |
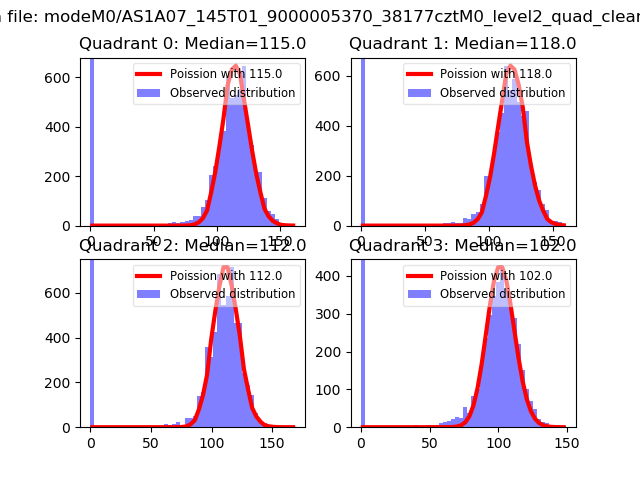 |
 |
| Quadrant-wise count rates Data is divided into 100 sec bins |
 |
|
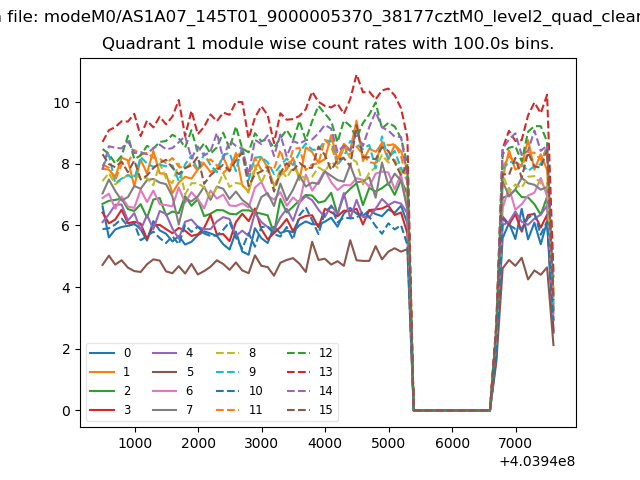
| Module-wise count rates for Quadrant A Data is divided into 100 sec bins |
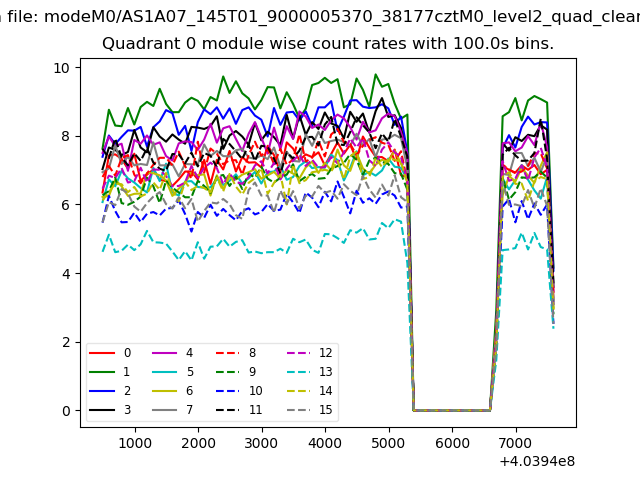 |
 |
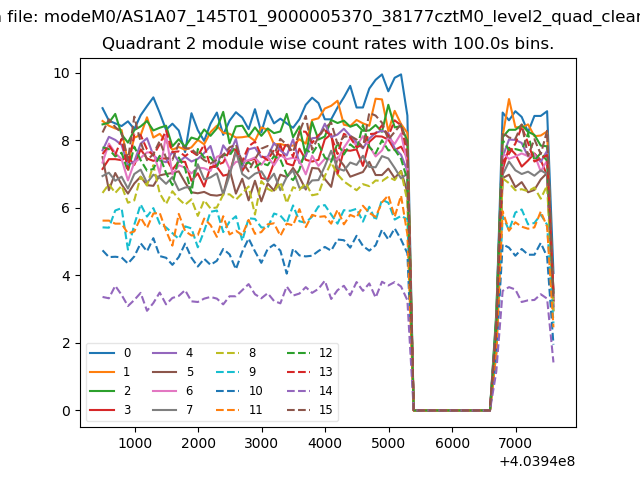
| Module-wise count rates for Quadrant B Data is divided into 100 sec bins |
 |
 |
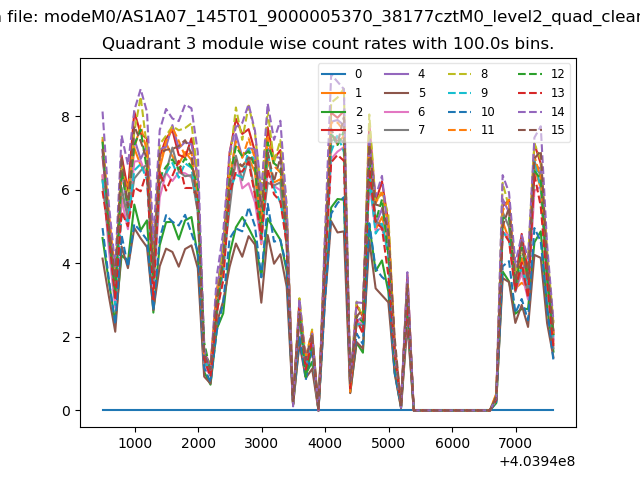
| Module-wise count rates for Quadrant C Data is divided into 100 sec bins |
 |
 |
| Module-wise count rates for Quadrant D Data is divided into 100 sec bins |
 |
 |
| Parameter | Plot |
|---|---|
| CZT HV Monitor | 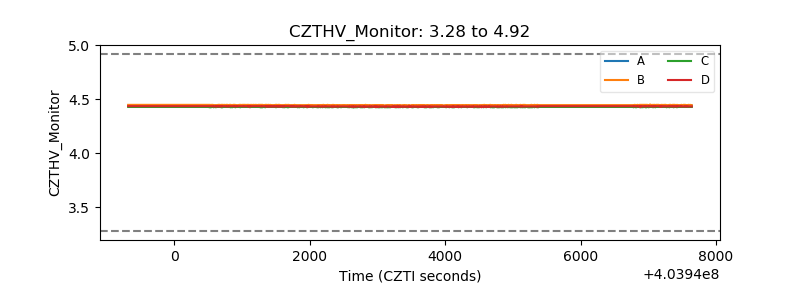 |
| D_VDD | 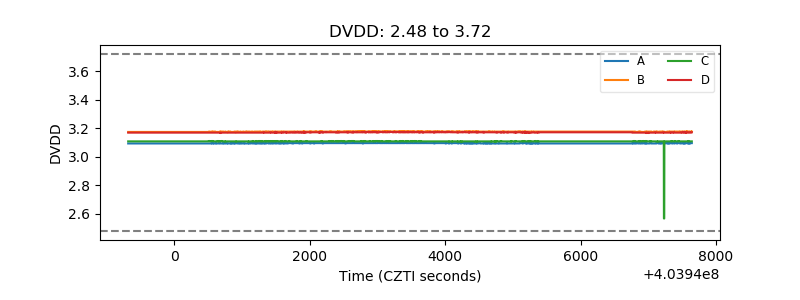 |
| Temperature 1 | 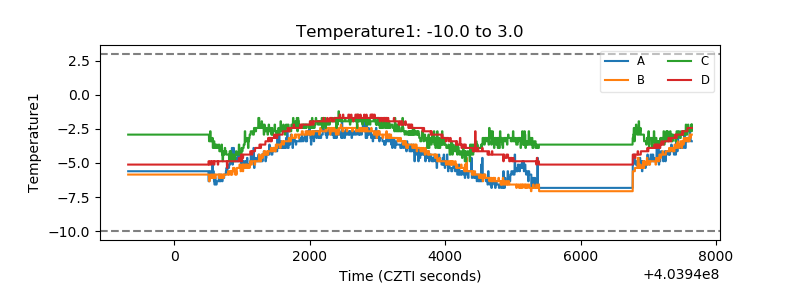 |
| Veto HV Monitor | 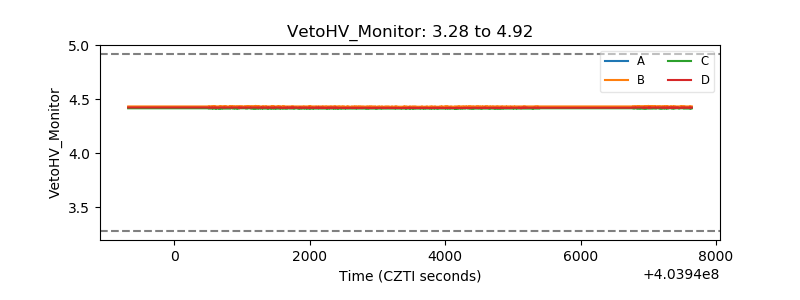 |
| Veto LLD | 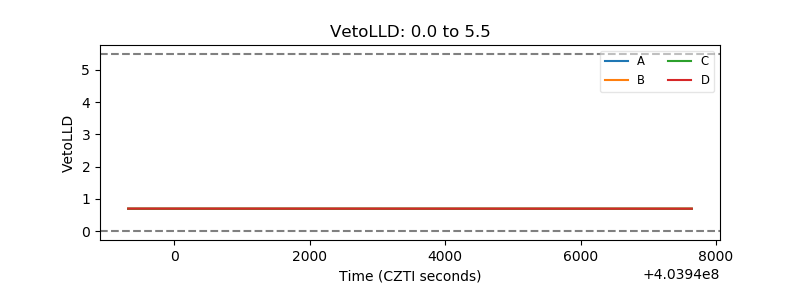 |
| Alpha Counter | 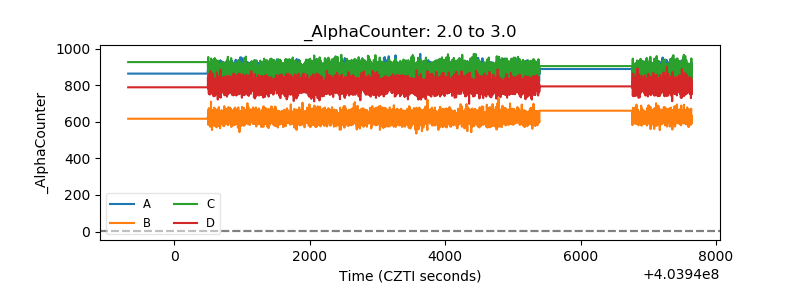 |
| _CPM_Rate | 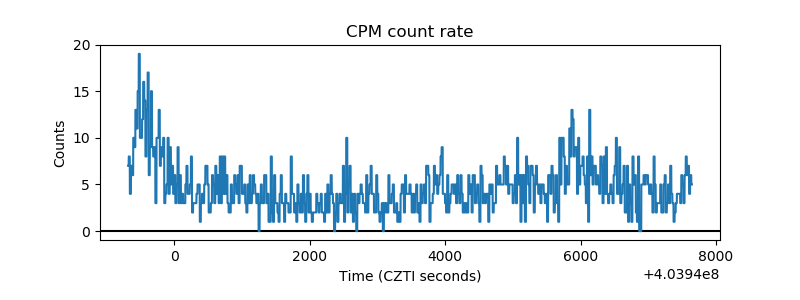 |
| CZT Counter | 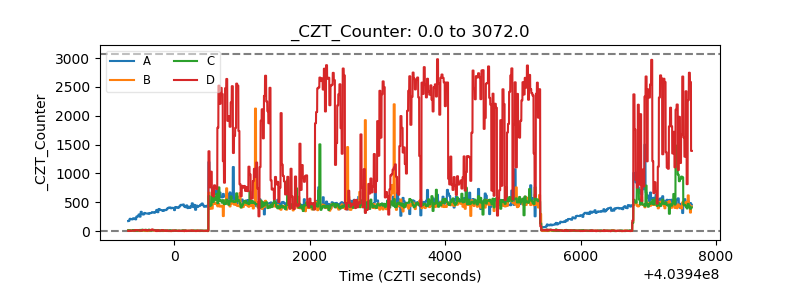 |
| +2.5 Volts monitor | 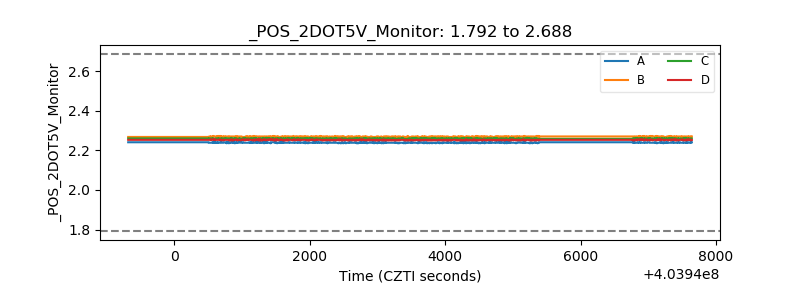 |
| +5 Volts monitor | 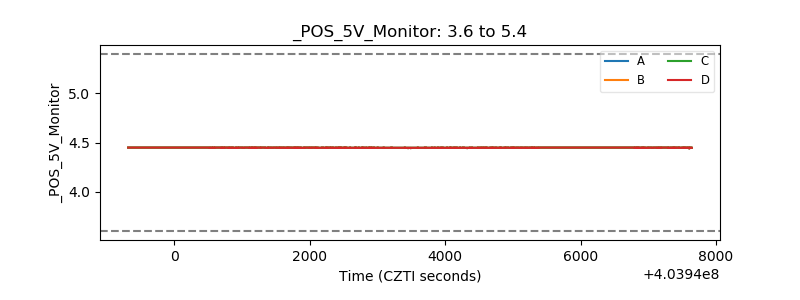 |
| _ROLL_ROT | 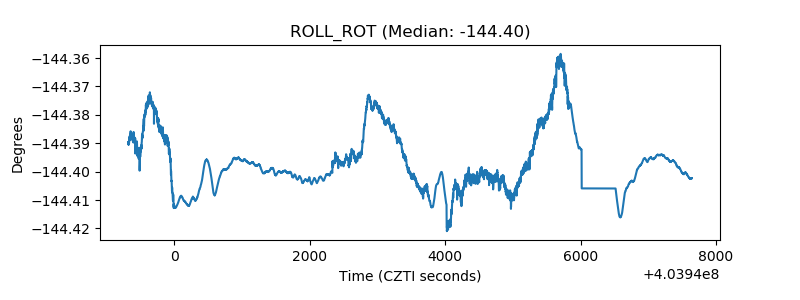 |
| _Roll_DEC | 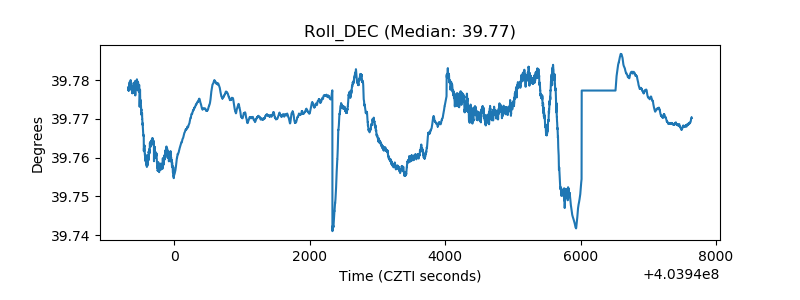 |
| _Roll_RA | 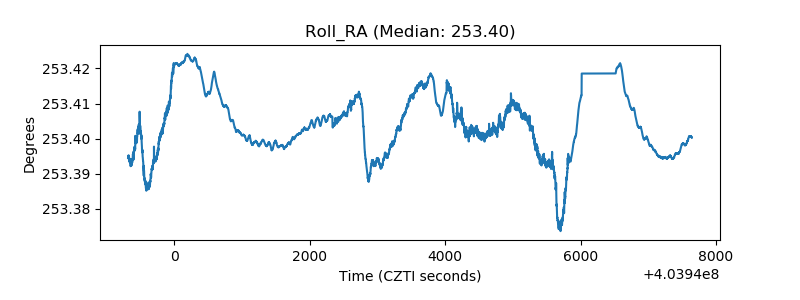 |
| Veto Counter | 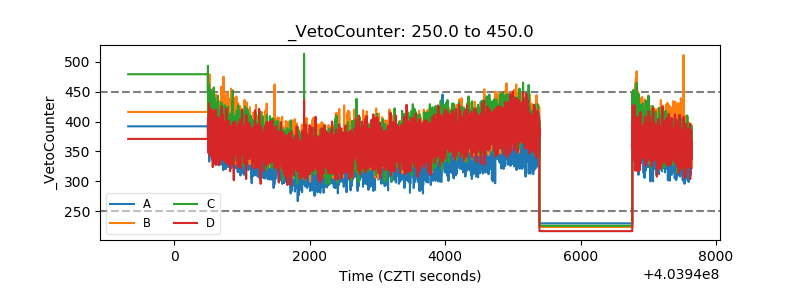 |