| Param | Original file | Final file |
|---|---|---|
| Filename | modeM0/AS1A07_145T01_9000005370_38178cztM0_level2.fits | modeM0/AS1A07_145T01_9000005370_38178cztM0_level2_quad_clean.evt |
| Size (bytes) | 456,439,680 | 96,655,680 |
| Size | 435.3 MB | 92.2 MB |
| Events in quadrant A | 3,071,043 | 683,633 |
| Events in quadrant B | 2,753,963 | 698,148 |
| Events in quadrant C | 3,047,286 | 658,883 |
| Events in quadrant D | 7,558,542 | 467,942 |
| Mode M9 | |||
|---|---|---|---|
| Quadrant | BADHDUFLAG | Total packets | Discarded packets |
| A | 0 | 14 | 0 |
| B | 0 | 14 | 0 |
| C | 0 | 14 | 0 |
| D | 0 | 15 | 0 |
| Mode SS | |||
|---|---|---|---|
| Quadrant | BADHDUFLAG | Total packets | Discarded packets |
| A | 0 | 124 | 0 |
| B | 0 | 124 | 0 |
| C | 0 | 124 | 0 |
| D | 0 | 124 | 0 |
| Mode M0 | |||
|---|---|---|---|
| Quadrant | BADHDUFLAG | Total packets | Discarded packets |
| A | 0 | 12683 | 3 |
| B | 0 | 12195 | 2 |
| C | 0 | 12691 | 2 |
| D | 0 | 26370 | 2 |
| Quadrant | Total seconds | Saturated seconds | Saturation percentage |
|---|---|---|---|
| A | 5977 | 14 | 0.234231% |
| B | 5977 | 14 | 0.234231% |
| C | 5977 | 18 | 0.301154% |
| D | 5977 | 1564 | 26.166973% |
Noise dominated data is calculated using 1-second bins in cleaned event files. If a bin has >2000 counts, and if more than 50% of those come from <1% of pixels, then it is considered to be noise-dominated and hence unusable.
| Quadrant | # 1 sec bins | Bins with >0 counts | Bins with >2000 counts | High rate bins dominated by noise | Noise dominated (total time) | Noise dominated (detector-on time) | Marked lightcurve |
|---|---|---|---|---|---|---|---|
| A | 7261 | 5978 | 3 | 3 | 0.04% | 0.05% | 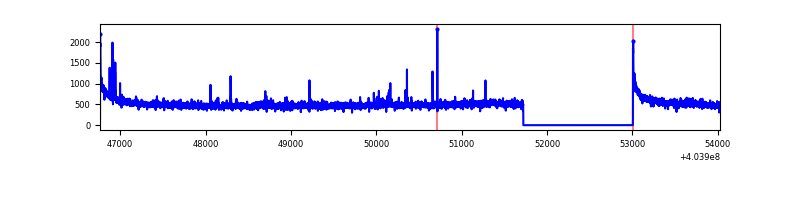 |
| B | 7260 | 5976 | 7 | 7 | 0.10% | 0.12% | 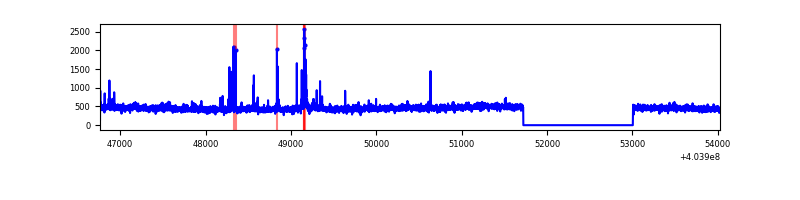 |
| C | 7260 | 5976 | 8 | 8 | 0.11% | 0.13% | 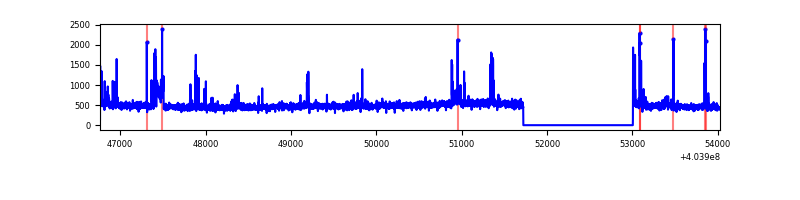 |
| D | 7260 | 5976 | 1585 | 1585 | 21.83% | 26.52% | 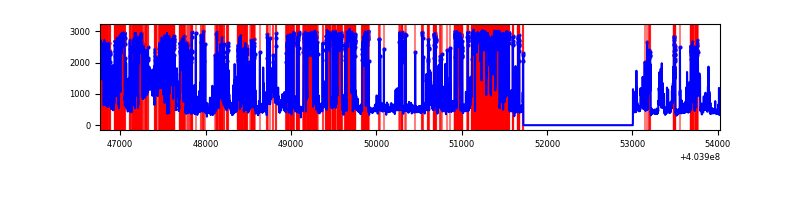 |
Top three noisy pixels from each quadrant. If the there are fewer than three noisy pixels in the level2.evt file, extra rows are filled as -1
| Pixel properties | Quadrant properties | ||||||
|---|---|---|---|---|---|---|---|
| Quadrant | DetID | PixID | Counts | Sigma | Mean | Median | Sigma |
| A | 10 | 83 | 405084 | 2920.43 | 671 | 654 | 138.5 |
| A | 12 | 189 | 35255 | 249.86 | 671 | 654 | 138.5 |
| A | 9 | 143 | 28112 | 198.28 | 671 | 654 | 138.5 |
| B | 4 | 171 | 55120 | 422.82 | 667 | 649 | 128.8 |
| B | 0 | 230 | 29093 | 220.79 | 667 | 649 | 128.8 |
| B | 15 | 85 | 17818 | 133.27 | 667 | 649 | 128.8 |
| C | 15 | 214 | 248122 | 1623.37 | 651 | 652 | 152.4 |
| C | 14 | 254 | 177671 | 1161.22 | 651 | 652 | 152.4 |
| C | 3 | 233 | 42550 | 274.85 | 651 | 652 | 152.4 |
| D | 12 | 227 | 4332957 | 32309.88 | 547 | 532 | 134.1 |
| D | 12 | 235 | 405404 | 3019.41 | 547 | 532 | 134.1 |
| D | 13 | 171 | 299403 | 2228.89 | 547 | 532 | 134.1 |
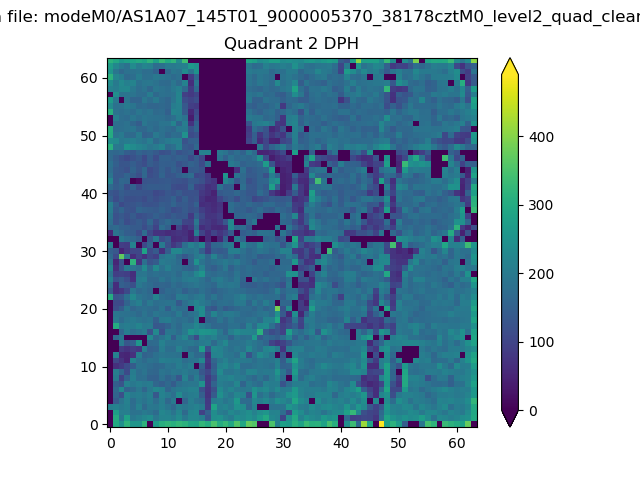
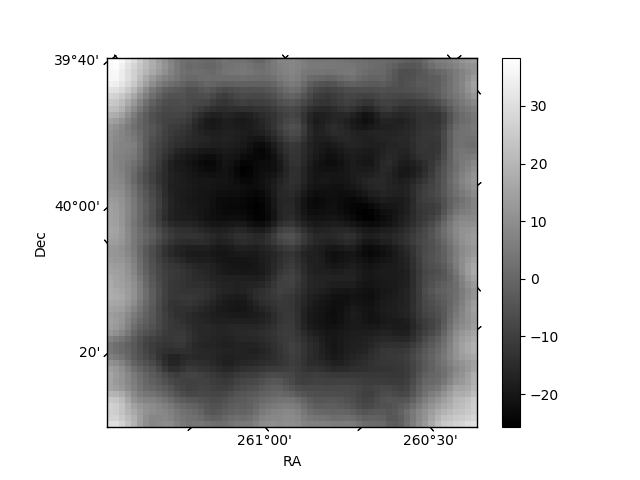
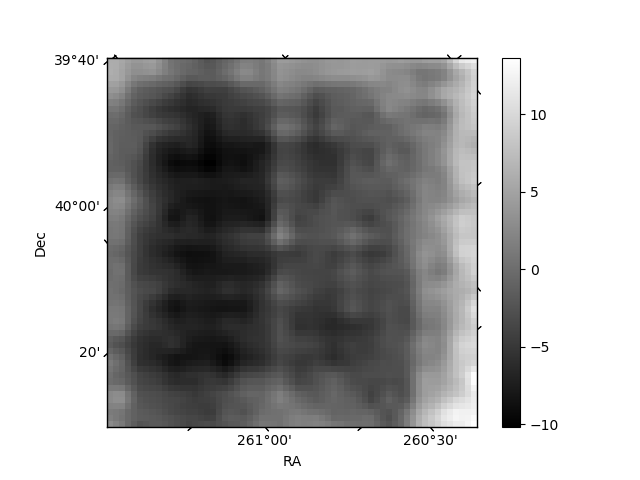
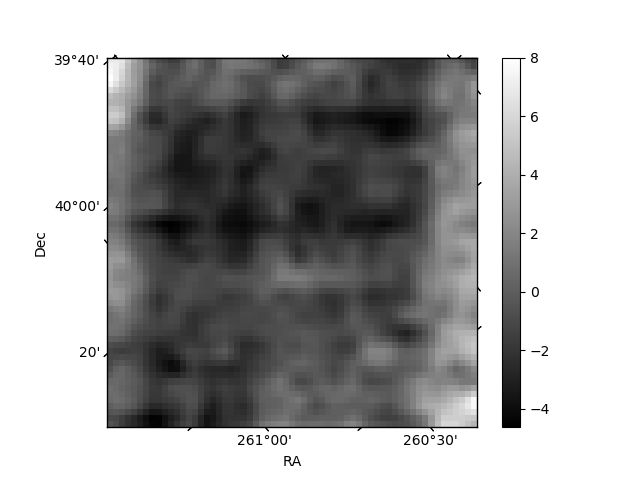
Histogram calculated using DETX and DETY for each event in the final _common_clean file
| Quadrant A | 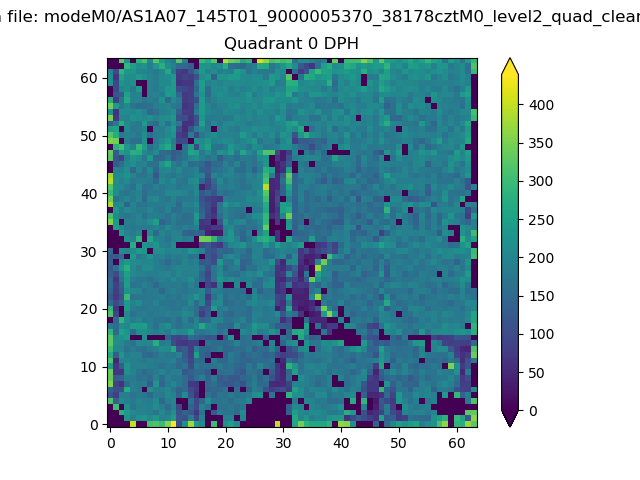 |
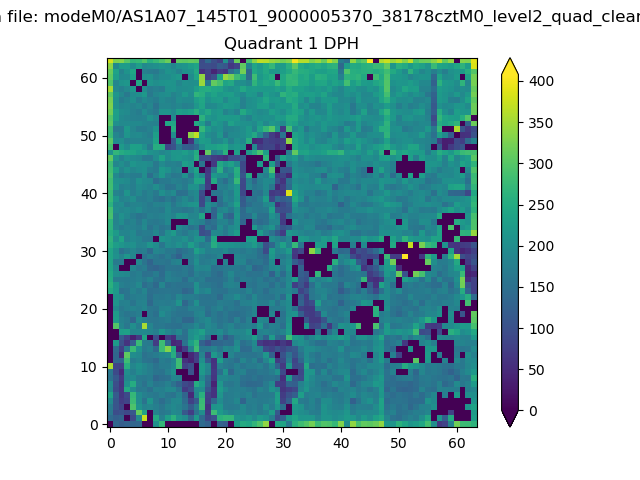 |
Quadrant B |
|---|---|---|---|
| Quadrant D | 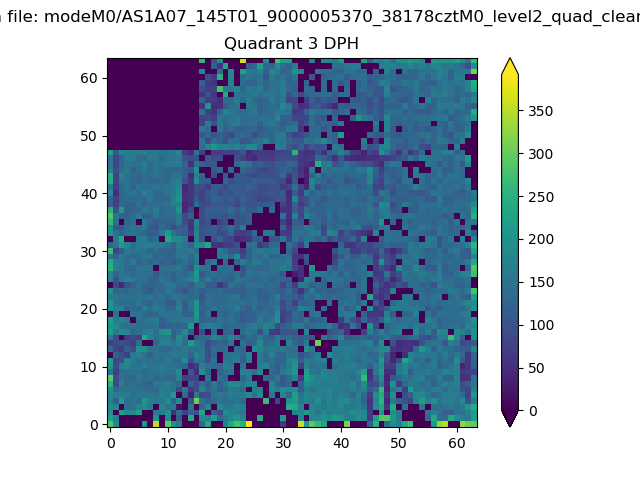 |
 |
Quadrant C |
| Plot type | Count rate plots | Images |
|---|---|---|
| Comparison with Poisson distribution Blue bars denote a histogram of data divided into 1 sec bins. Red curve is a Poisson curve with rate = median count rate of data. |
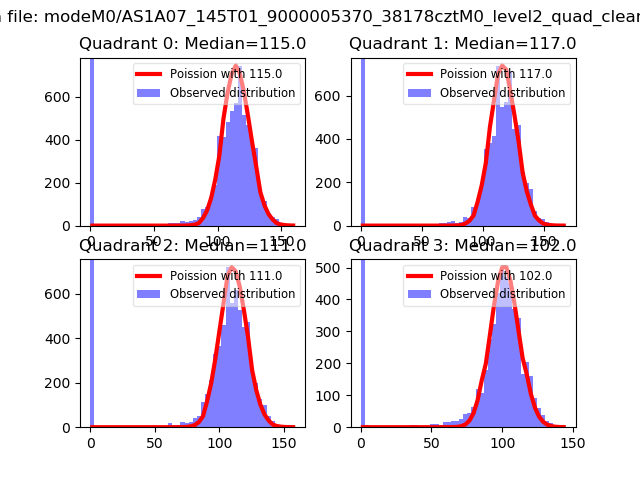 |
 |
| Quadrant-wise count rates Data is divided into 100 sec bins |
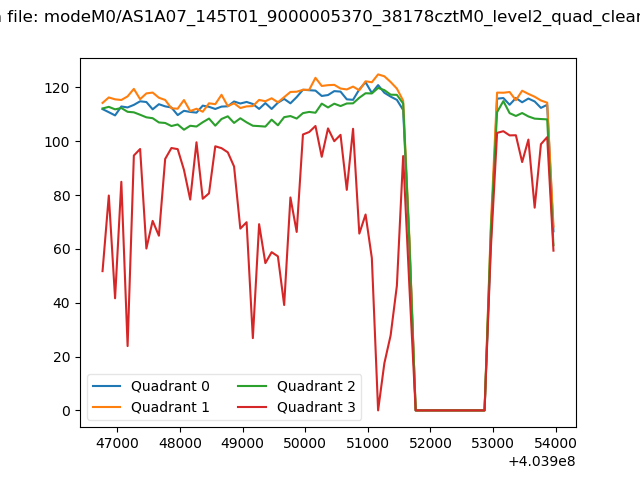 |
|
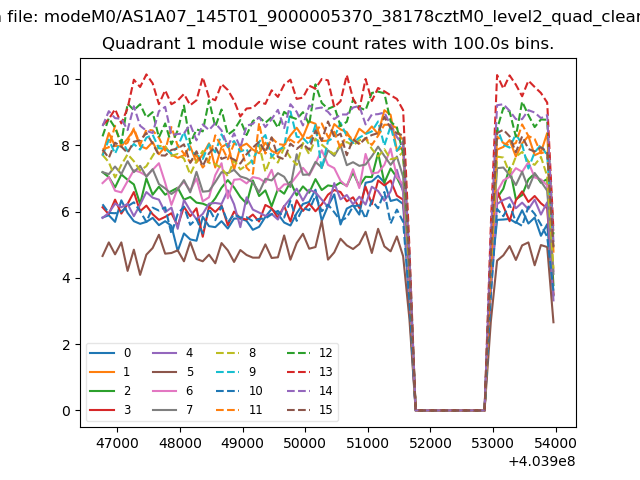
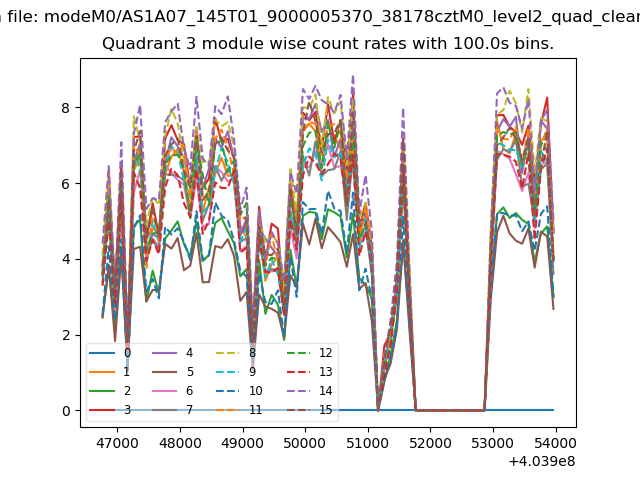
| Module-wise count rates for Quadrant A Data is divided into 100 sec bins |
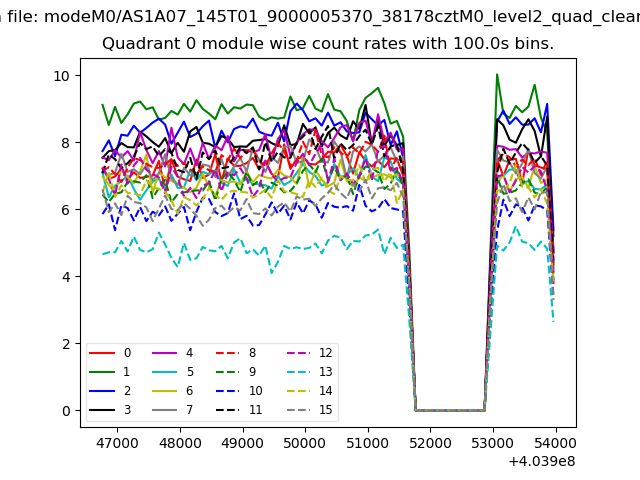 |
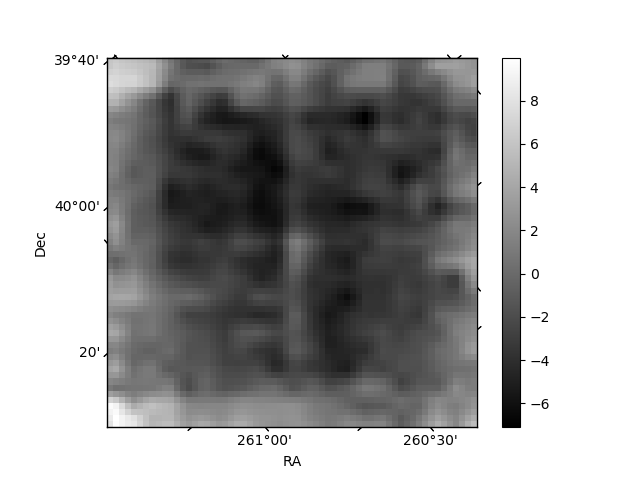 |
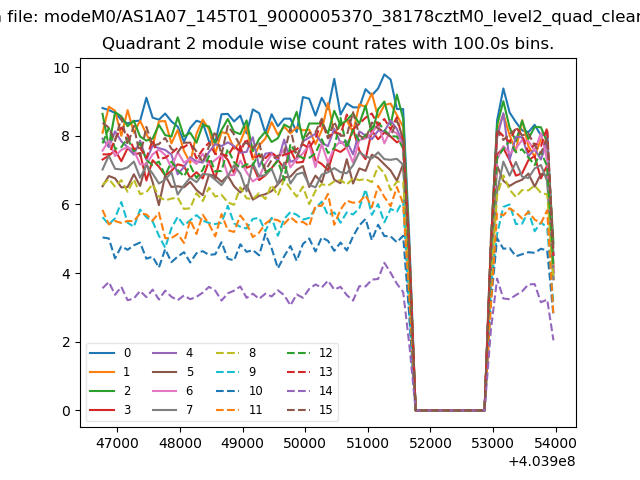
| Module-wise count rates for Quadrant B Data is divided into 100 sec bins |
 |
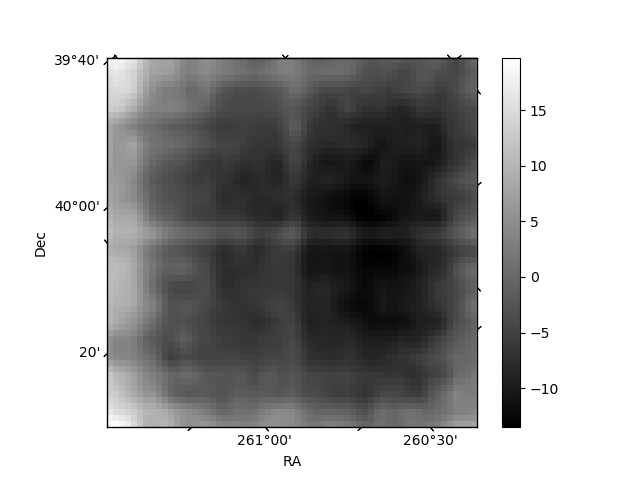 |
| Module-wise count rates for Quadrant C Data is divided into 100 sec bins |
 |
 |
| Module-wise count rates for Quadrant D Data is divided into 100 sec bins |
 |
 |
| Parameter | Plot |
|---|---|
| CZT HV Monitor | 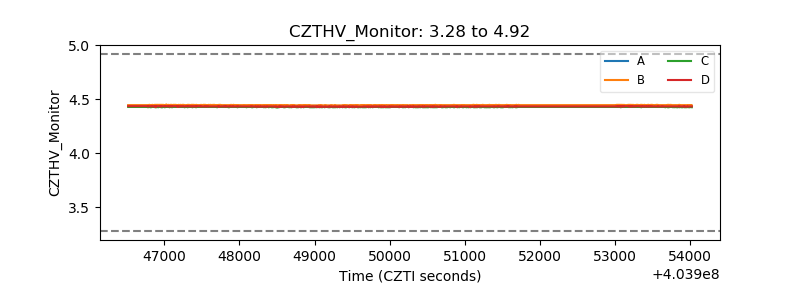 |
| D_VDD | 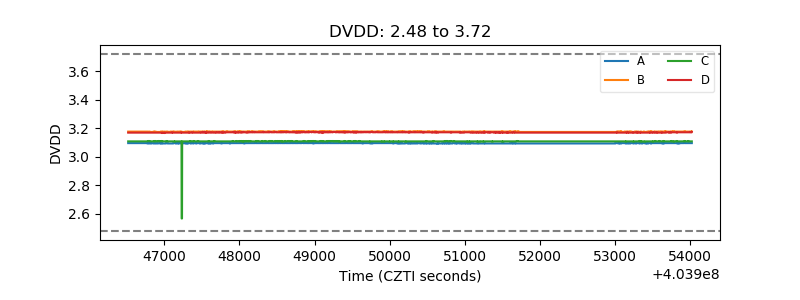 |
| Temperature 1 | 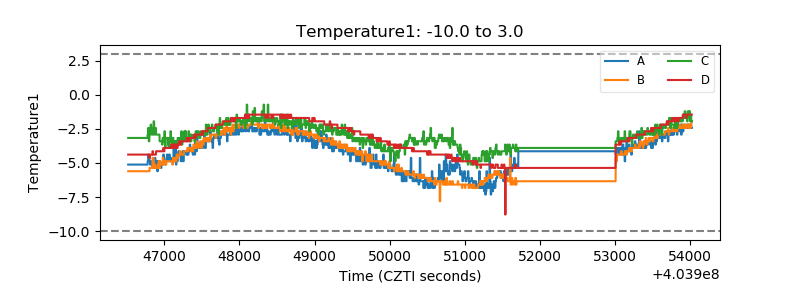 |
| Veto HV Monitor |  |
| Veto LLD | 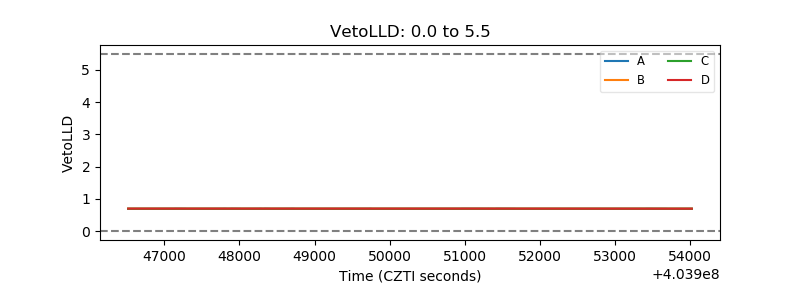 |
| Alpha Counter | 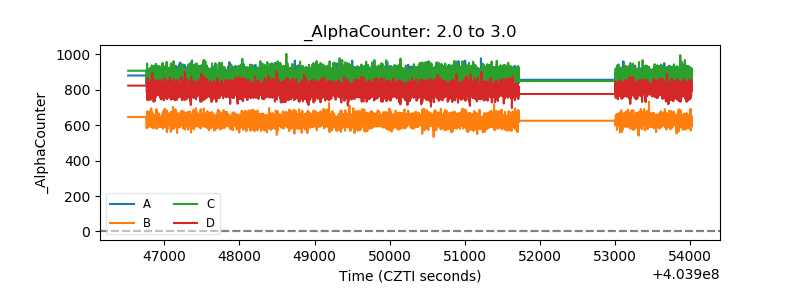 |
| _CPM_Rate | 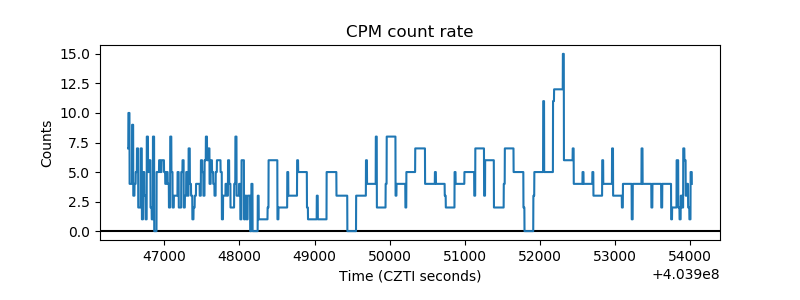 |
| CZT Counter | 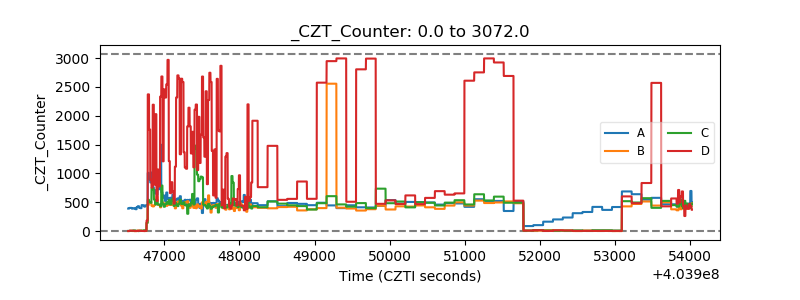 |
| +2.5 Volts monitor | 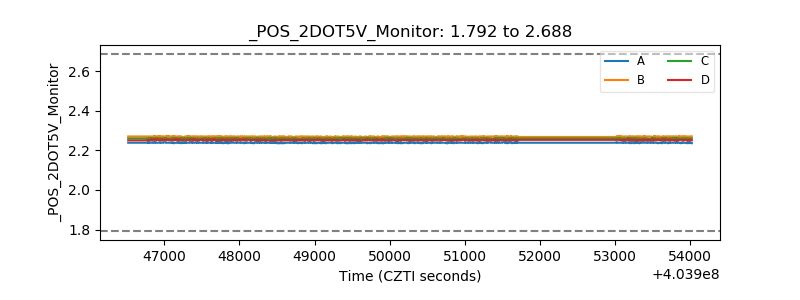 |
| +5 Volts monitor | 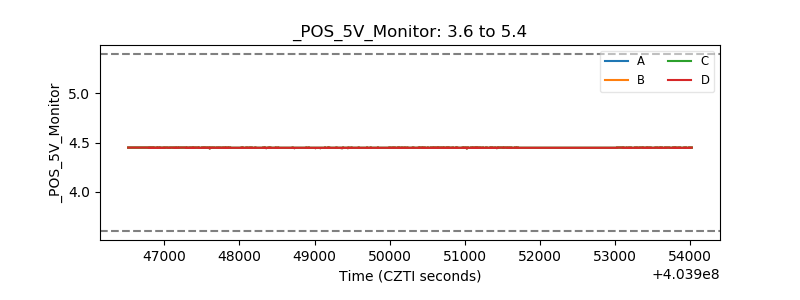 |
| _ROLL_ROT | 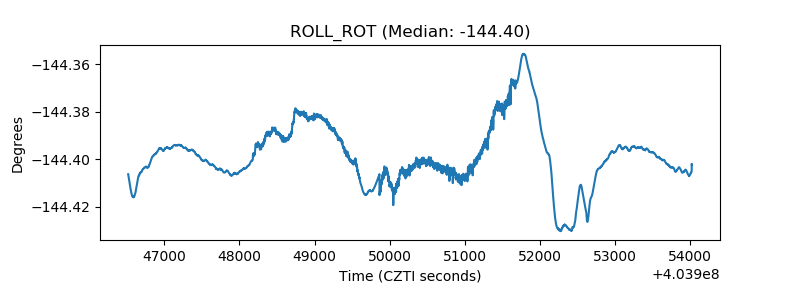 |
| _Roll_DEC | 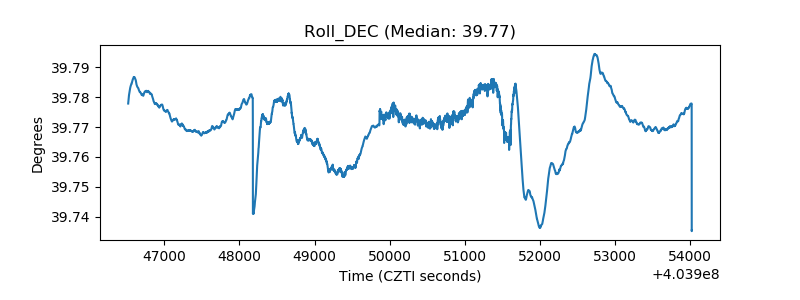 |
| _Roll_RA | 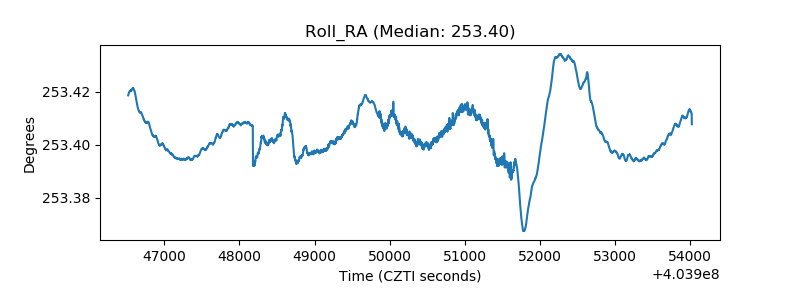 |
| Veto Counter | 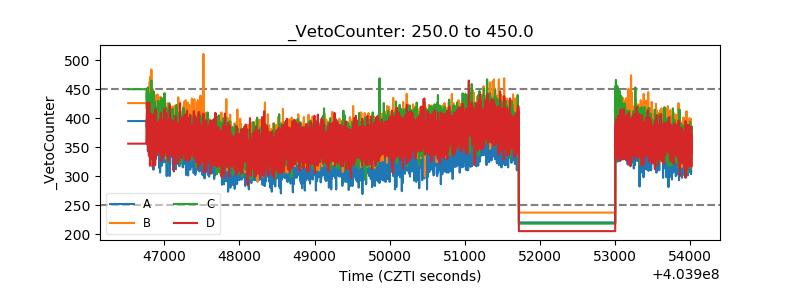 |