| Param | Original file | Final file |
|---|---|---|
| Filename | modeM0/AS1A07_145T01_9000005370_38180cztM0_level2.fits | modeM0/AS1A07_145T01_9000005370_38180cztM0_level2_quad_clean.evt |
| Size (bytes) | 694,396,800 | 176,054,400 |
| Size | 662.2 MB | 167.9 MB |
| Events in quadrant A | 5,403,473 | 1,206,142 |
| Events in quadrant B | 4,956,079 | 1,227,232 |
| Events in quadrant C | 5,984,277 | 1,148,810 |
| Events in quadrant D | 8,531,678 | 1,008,172 |
| Mode M9 | |||
|---|---|---|---|
| Quadrant | BADHDUFLAG | Total packets | Discarded packets |
| A | 0 | 27 | 0 |
| B | 0 | 27 | 0 |
| C | 0 | 27 | 0 |
| D | 0 | 27 | 0 |
| Mode SS | |||
|---|---|---|---|
| Quadrant | BADHDUFLAG | Total packets | Discarded packets |
| A | 0 | 218 | 0 |
| B | 0 | 218 | 0 |
| C | 0 | 218 | 0 |
| D | 0 | 218 | 0 |
| Mode M0 | |||
|---|---|---|---|
| Quadrant | BADHDUFLAG | Total packets | Discarded packets |
| A | 0 | 22456 | 3 |
| B | 0 | 21933 | 2 |
| C | 0 | 24269 | 2 |
| D | 0 | 32458 | 2 |
| Quadrant | Total seconds | Saturated seconds | Saturation percentage |
|---|---|---|---|
| A | 10688 | 22 | 0.205838% |
| B | 10688 | 46 | 0.430389% |
| C | 10688 | 210 | 1.964820% |
| D | 10688 | 832 | 7.784431% |
Noise dominated data is calculated using 1-second bins in cleaned event files. If a bin has >2000 counts, and if more than 50% of those come from <1% of pixels, then it is considered to be noise-dominated and hence unusable.
| Quadrant | # 1 sec bins | Bins with >0 counts | Bins with >2000 counts | High rate bins dominated by noise | Noise dominated (total time) | Noise dominated (detector-on time) | Marked lightcurve |
|---|---|---|---|---|---|---|---|
| A | 13405 | 10690 | 4 | 4 | 0.03% | 0.04% |  |
| B | 13405 | 10688 | 41 | 41 | 0.31% | 0.38% |  |
| C | 13405 | 10688 | 210 | 210 | 1.57% | 1.96% |  |
| D | 13405 | 10688 | 854 | 854 | 6.37% | 7.99% |  |
Top three noisy pixels from each quadrant. If the there are fewer than three noisy pixels in the level2.evt file, extra rows are filled as -1
| Pixel properties | Quadrant properties | ||||||
|---|---|---|---|---|---|---|---|
| Quadrant | DetID | PixID | Counts | Sigma | Mean | Median | Sigma |
| A | 10 | 83 | 641787 | 2656.97 | 1198 | 1173 | 241.1 |
| A | 12 | 189 | 64503 | 262.66 | 1198 | 1173 | 241.1 |
| A | 9 | 143 | 47685 | 192.91 | 1198 | 1173 | 241.1 |
| B | 5 | 172 | 81404 | 349.9 | 1190 | 1159 | 229.3 |
| B | 15 | 85 | 60886 | 260.43 | 1190 | 1159 | 229.3 |
| B | 0 | 230 | 50318 | 214.35 | 1190 | 1159 | 229.3 |
| C | 14 | 254 | 860040 | 3192.89 | 1159 | 1165 | 269.0 |
| C | 15 | 214 | 435037 | 1612.93 | 1159 | 1165 | 269.0 |
| C | 1 | 23 | 85175 | 312.31 | 1159 | 1165 | 269.0 |
| D | 12 | 227 | 1804885 | 6635.14 | 1127 | 1096 | 271.9 |
| D | 12 | 235 | 1116124 | 4101.57 | 1127 | 1096 | 271.9 |
| D | 12 | 233 | 387712 | 1422.15 | 1127 | 1096 | 271.9 |
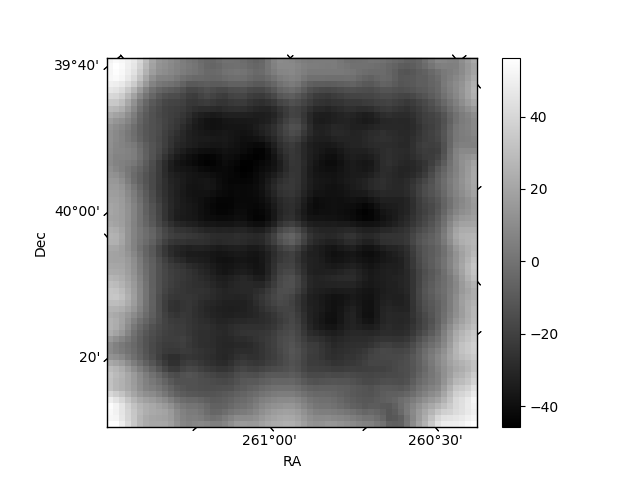
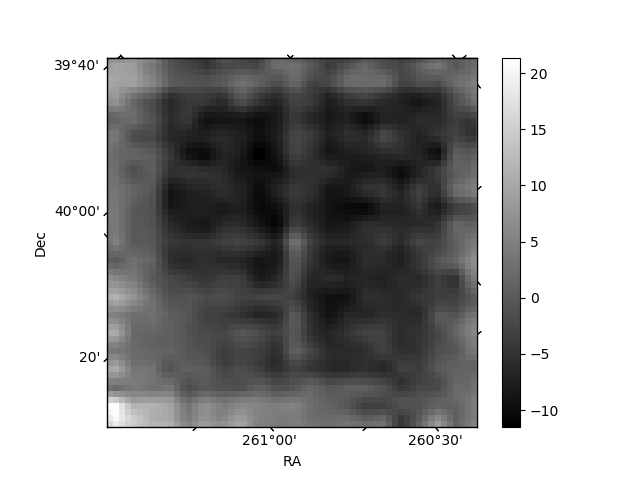
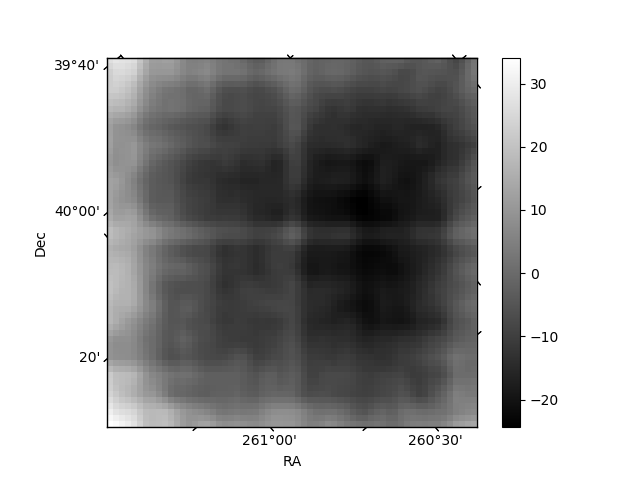
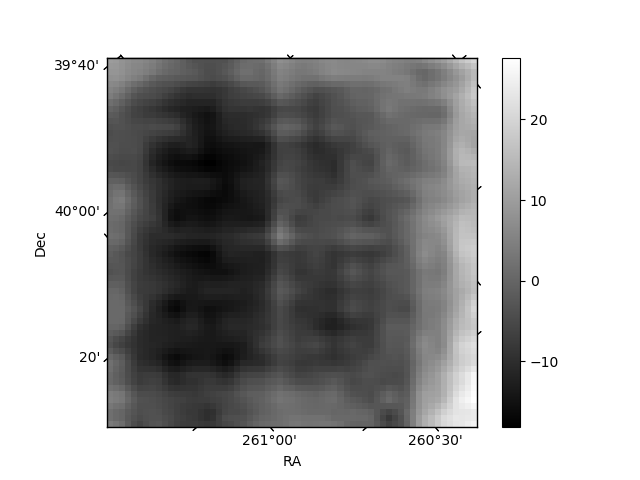
Histogram calculated using DETX and DETY for each event in the final _common_clean file
| Quadrant A |  |
 |
Quadrant B |
|---|---|---|---|
| Quadrant D |  |
 |
Quadrant C |
| Plot type | Count rate plots | Images |
|---|---|---|
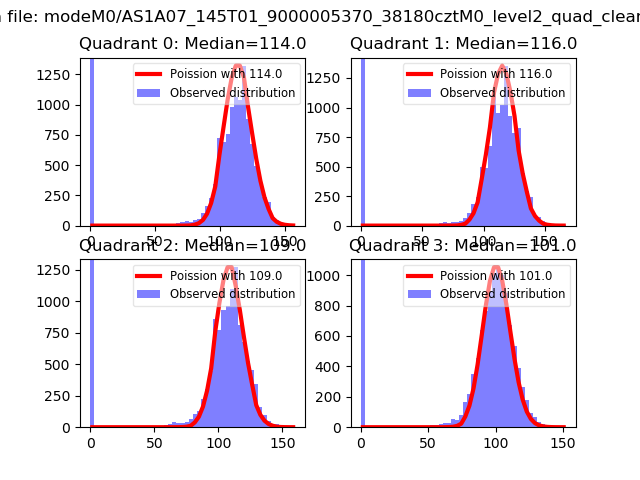
| Comparison with Poisson distribution Blue bars denote a histogram of data divided into 1 sec bins. Red curve is a Poisson curve with rate = median count rate of data. |
 |
 |
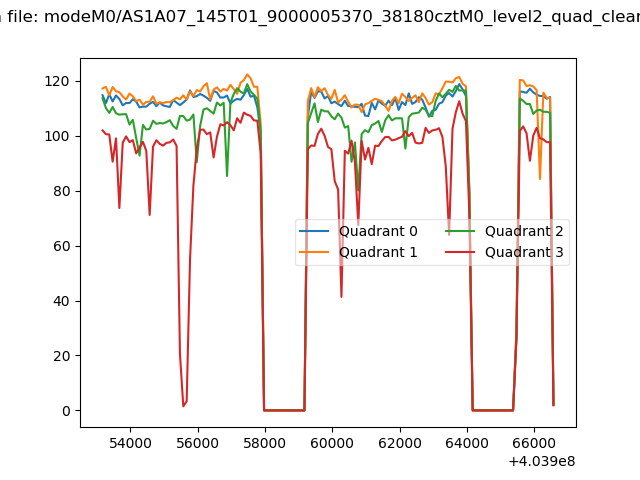
| Quadrant-wise count rates Data is divided into 100 sec bins |
 |
|
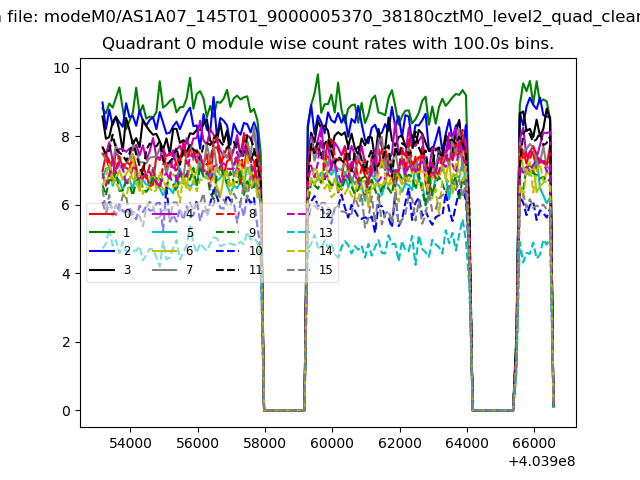
| Module-wise count rates for Quadrant A Data is divided into 100 sec bins |
 |
 |
| Module-wise count rates for Quadrant B Data is divided into 100 sec bins |
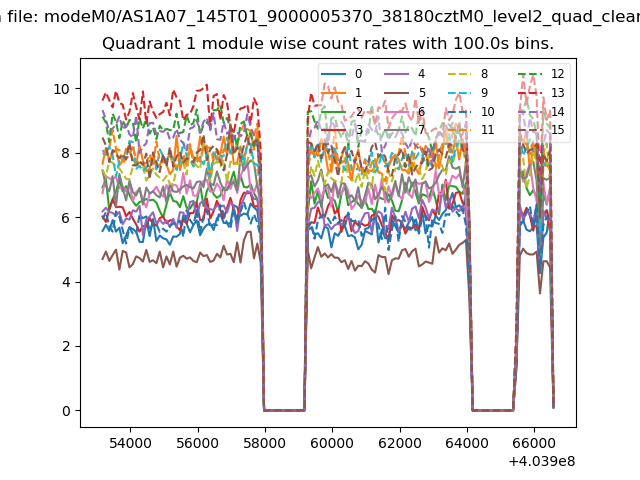 |
 |
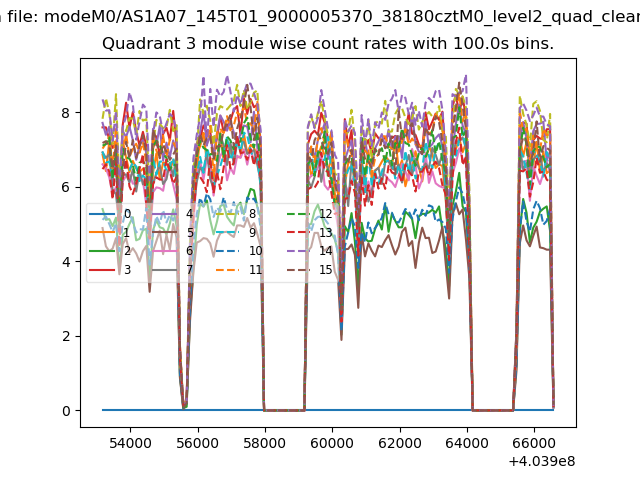
| Module-wise count rates for Quadrant C Data is divided into 100 sec bins |
 |
 |
| Module-wise count rates for Quadrant D Data is divided into 100 sec bins |
 |
 |
| Parameter | Plot |
|---|---|
| CZT HV Monitor | 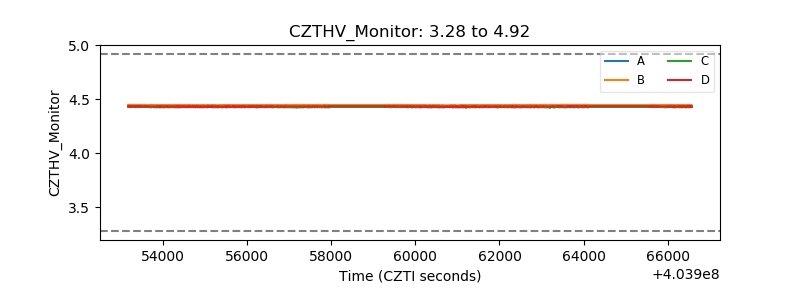 |
| D_VDD | 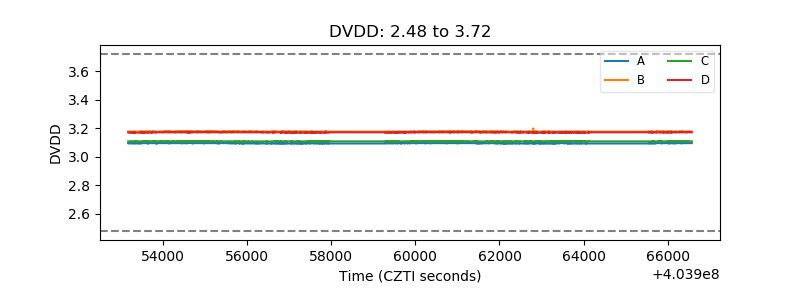 |
| Temperature 1 | 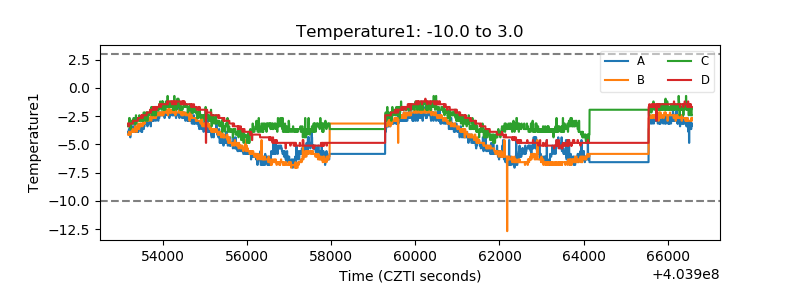 |
| Veto HV Monitor | 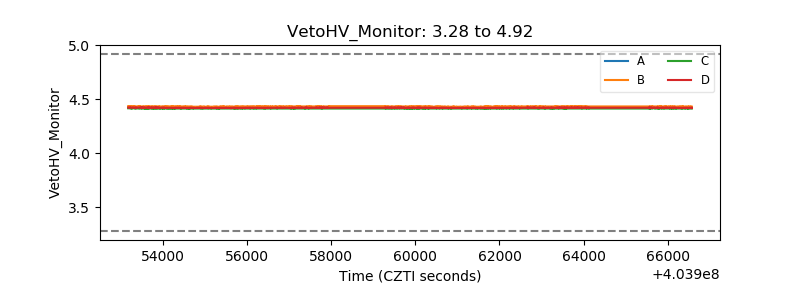 |
| Veto LLD | 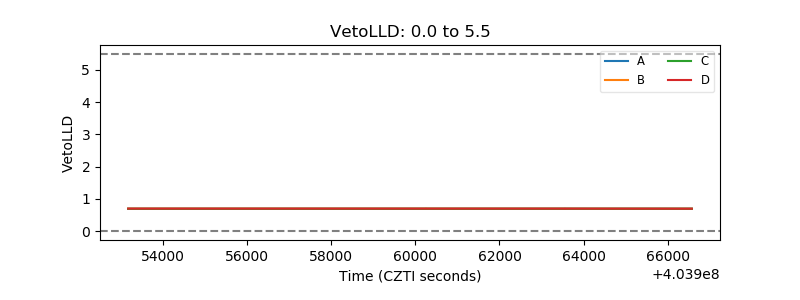 |
| Alpha Counter | 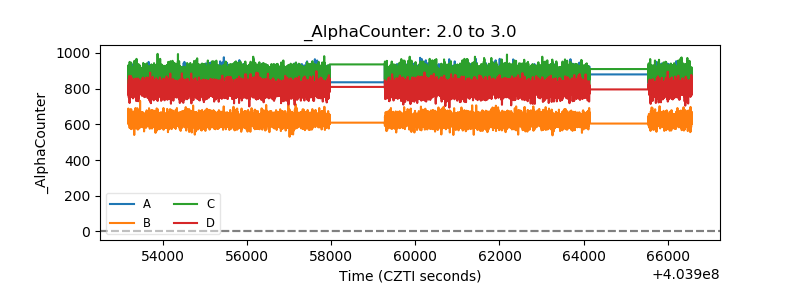 |
| _CPM_Rate | 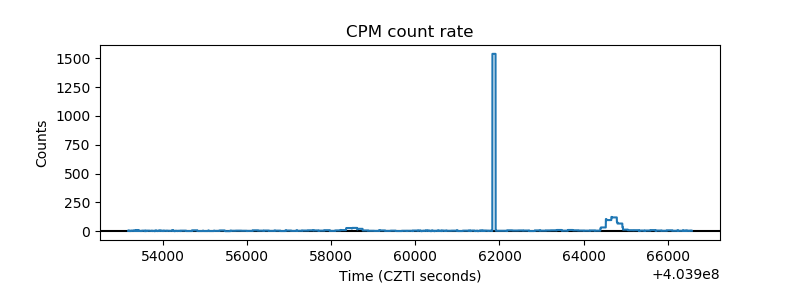 |
| CZT Counter | 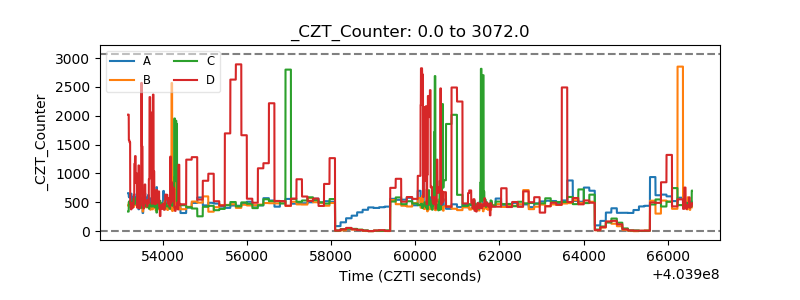 |
| +2.5 Volts monitor | 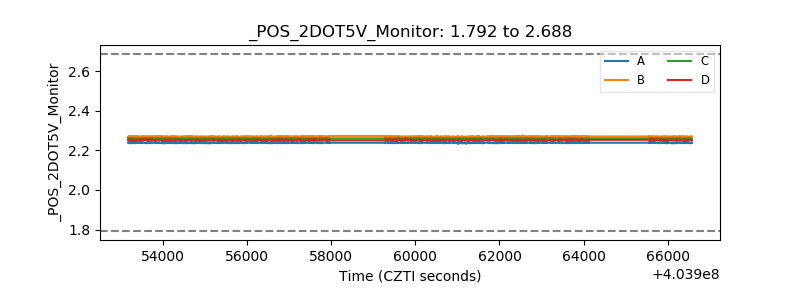 |
| +5 Volts monitor |  |
| _ROLL_ROT | 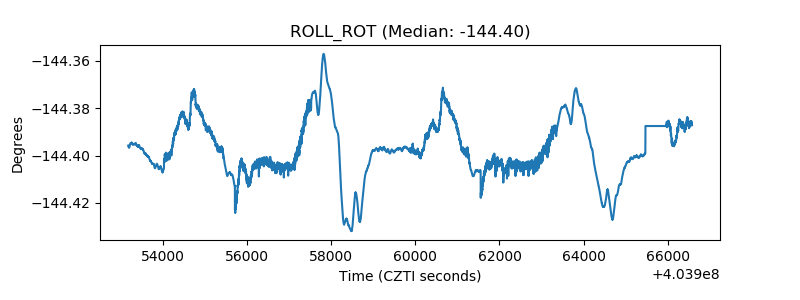 |
| _Roll_DEC | 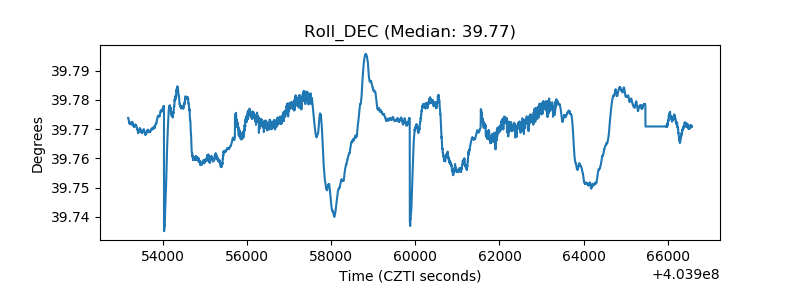 |
| _Roll_RA | 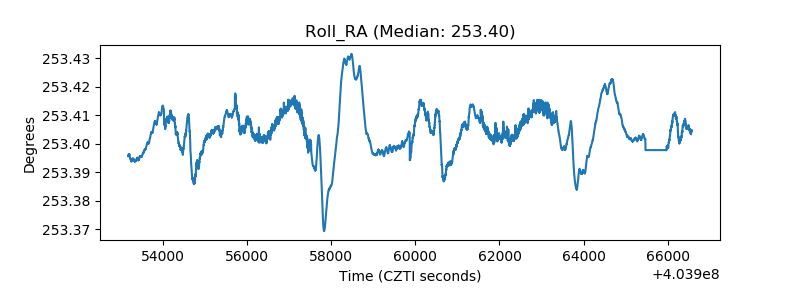 |
| Veto Counter | 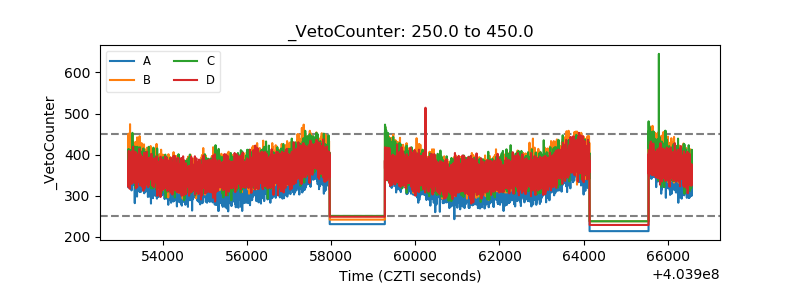 |