| Param | Original file | Final file |
|---|---|---|
| Filename | modeM0/AS1A07_145T01_9000005370_38181cztM0_level2.fits | modeM0/AS1A07_145T01_9000005370_38181cztM0_level2_quad_clean.evt |
| Size (bytes) | 335,675,520 | 96,900,480 |
| Size | 320.1 MB | 92.4 MB |
| Events in quadrant A | 3,050,550 | 653,483 |
| Events in quadrant B | 2,695,871 | 664,227 |
| Events in quadrant C | 2,827,230 | 633,610 |
| Events in quadrant D | 3,403,021 | 579,804 |
| Mode M9 | |||
|---|---|---|---|
| Quadrant | BADHDUFLAG | Total packets | Discarded packets |
| A | 0 | 18 | 0 |
| B | 0 | 18 | 0 |
| C | 0 | 18 | 0 |
| D | 0 | 19 | 0 |
| Mode SS | |||
|---|---|---|---|
| Quadrant | BADHDUFLAG | Total packets | Discarded packets |
| A | 0 | 118 | 0 |
| B | 0 | 118 | 0 |
| C | 0 | 118 | 0 |
| D | 0 | 118 | 0 |
| Mode M0 | |||
|---|---|---|---|
| Quadrant | BADHDUFLAG | Total packets | Discarded packets |
| A | 0 | 12619 | 3 |
| B | 0 | 11928 | 2 |
| C | 0 | 11875 | 2 |
| D | 0 | 13930 | 2 |
| Quadrant | Total seconds | Saturated seconds | Saturation percentage |
|---|---|---|---|
| A | 5762 | 22 | 0.381812% |
| B | 5762 | 41 | 0.711558% |
| C | 5762 | 22 | 0.381812% |
| D | 5762 | 142 | 2.464422% |
Noise dominated data is calculated using 1-second bins in cleaned event files. If a bin has >2000 counts, and if more than 50% of those come from <1% of pixels, then it is considered to be noise-dominated and hence unusable.
| Quadrant | # 1 sec bins | Bins with >0 counts | Bins with >2000 counts | High rate bins dominated by noise | Noise dominated (total time) | Noise dominated (detector-on time) | Marked lightcurve |
|---|---|---|---|---|---|---|---|
| A | 7286 | 5763 | 14 | 14 | 0.19% | 0.24% | 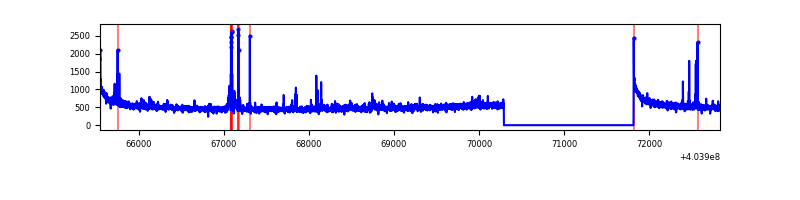 |
| B | 7285 | 5761 | 32 | 32 | 0.44% | 0.56% | 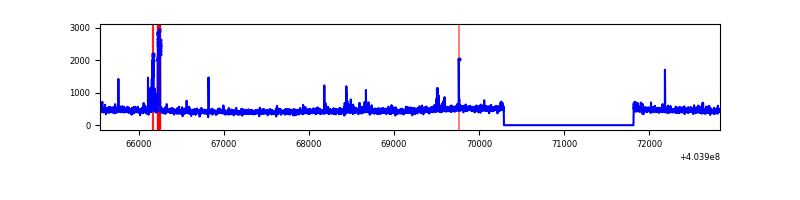 |
| C | 7285 | 5761 | 19 | 19 | 0.26% | 0.33% | 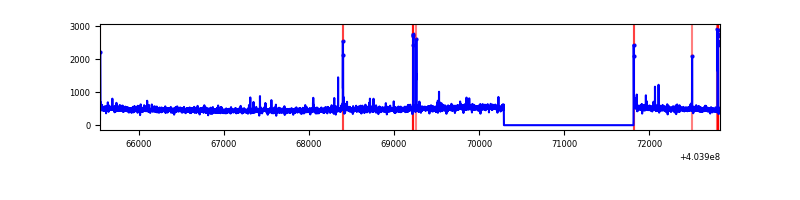 |
| D | 7285 | 5761 | 127 | 127 | 1.74% | 2.20% | 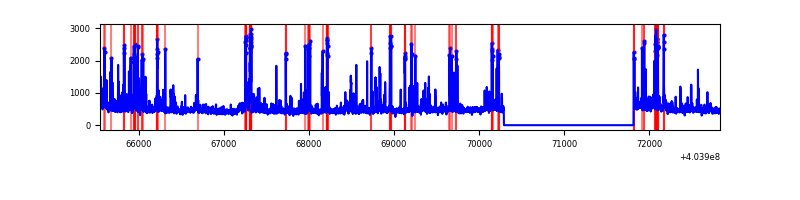 |
Top three noisy pixels from each quadrant. If the there are fewer than three noisy pixels in the level2.evt file, extra rows are filled as -1
| Pixel properties | Quadrant properties | ||||||
|---|---|---|---|---|---|---|---|
| Quadrant | DetID | PixID | Counts | Sigma | Mean | Median | Sigma |
| A | 10 | 83 | 398981 | 3017.33 | 645 | 630 | 132.0 |
| A | 9 | 143 | 80105 | 601.99 | 645 | 630 | 132.0 |
| A | 12 | 189 | 61806 | 463.38 | 645 | 630 | 132.0 |
| B | 5 | 172 | 81554 | 658.18 | 640 | 622 | 123.0 |
| B | 15 | 85 | 33823 | 270.0 | 640 | 622 | 123.0 |
| B | 0 | 230 | 23597 | 186.84 | 640 | 622 | 123.0 |
| C | 15 | 214 | 239259 | 1618.35 | 630 | 633 | 147.4 |
| C | 14 | 254 | 52716 | 353.22 | 630 | 633 | 147.4 |
| C | 3 | 233 | 32305 | 214.8 | 630 | 633 | 147.4 |
| D | 13 | 249 | 303589 | 1971.26 | 628 | 613 | 153.7 |
| D | 12 | 233 | 124691 | 807.29 | 628 | 613 | 153.7 |
| D | 7 | 55 | 78614 | 507.5 | 628 | 613 | 153.7 |
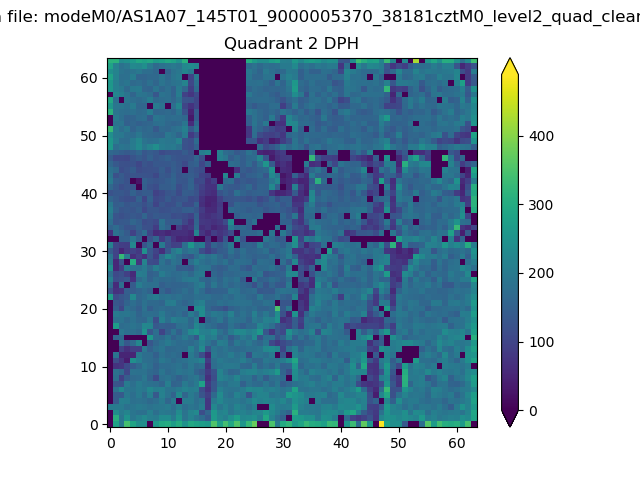
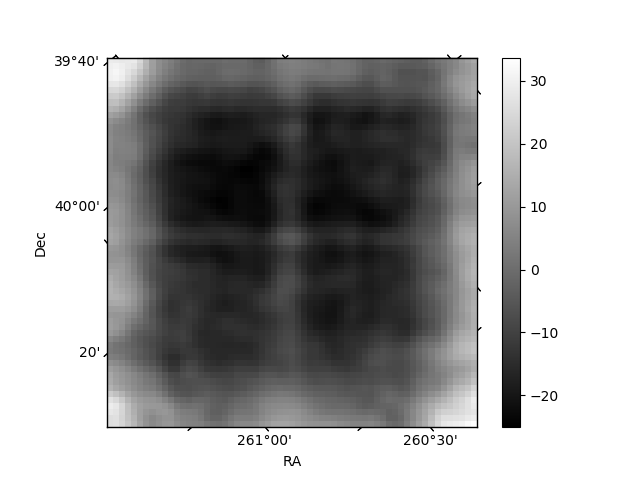
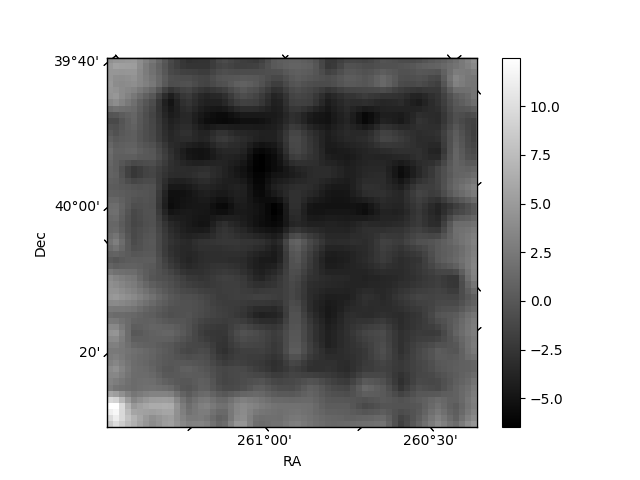
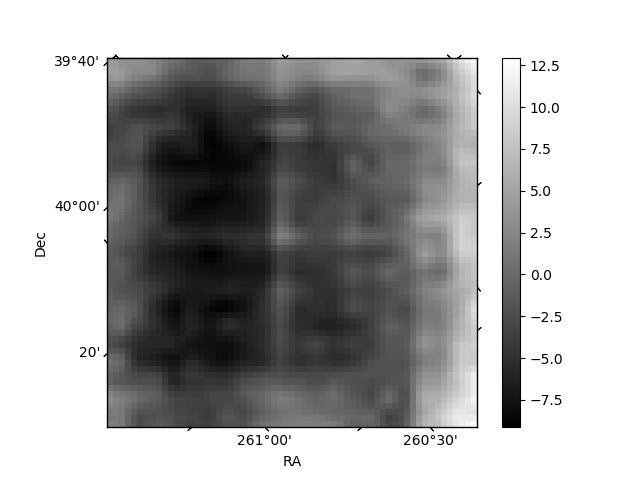
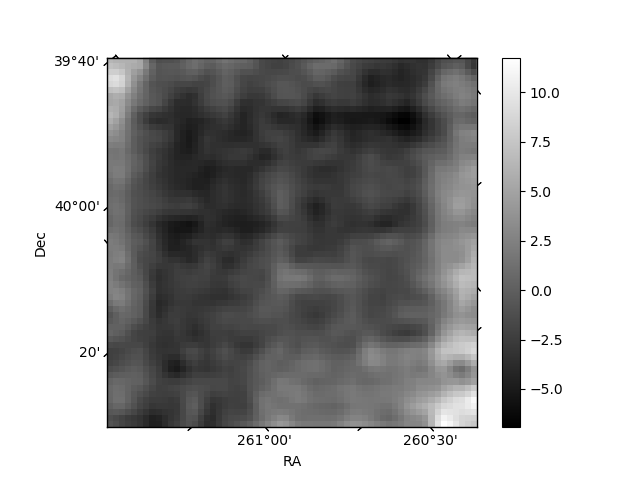
Histogram calculated using DETX and DETY for each event in the final _common_clean file
| Quadrant A | 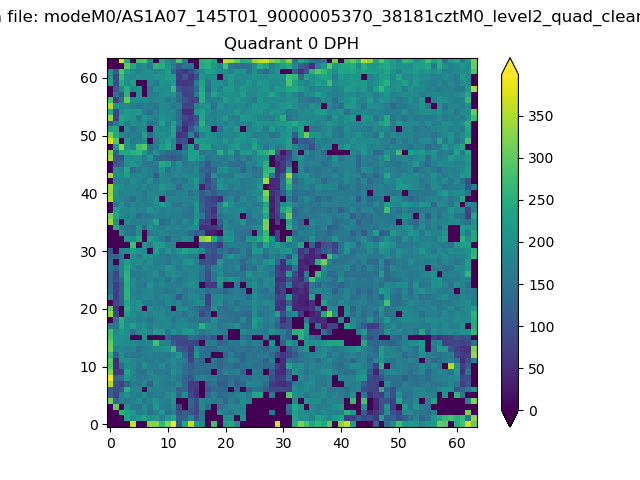 |
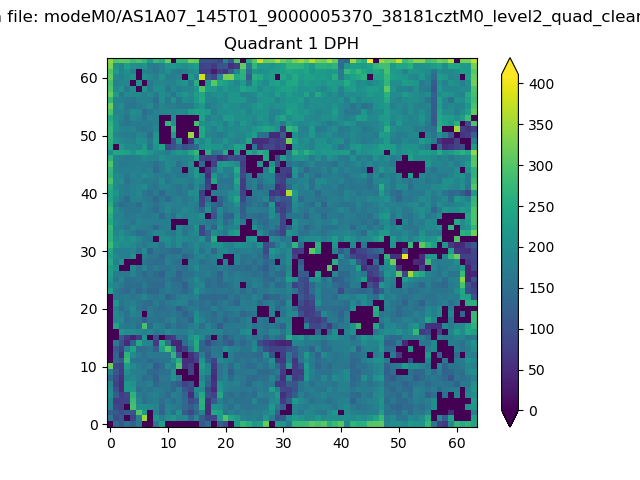 |
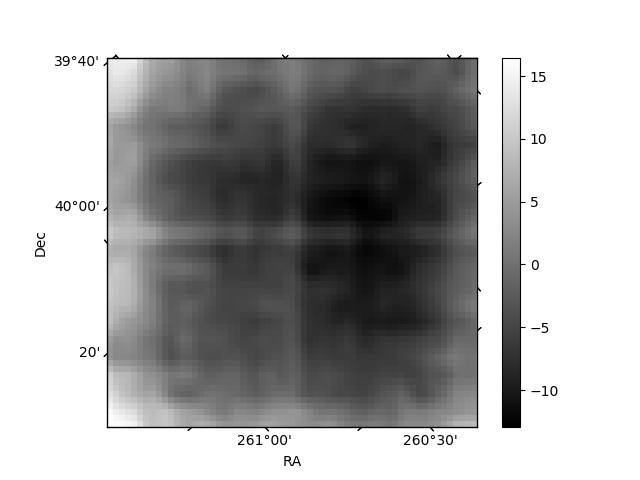
Quadrant B |
|---|---|---|---|
| Quadrant D | 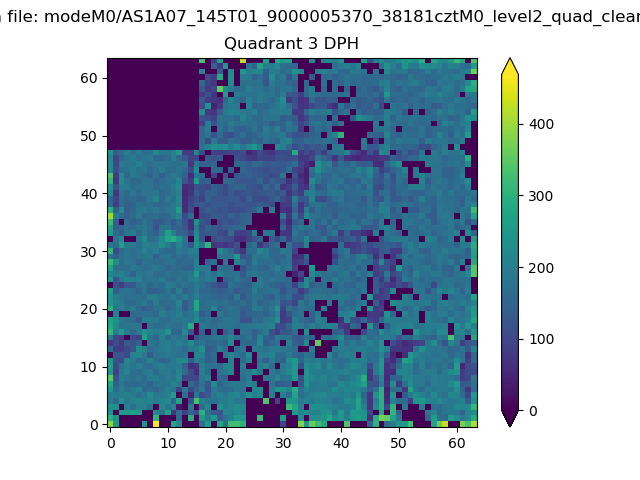 |
 |
Quadrant C |
| Plot type | Count rate plots | Images |
|---|---|---|
| Comparison with Poisson distribution Blue bars denote a histogram of data divided into 1 sec bins. Red curve is a Poisson curve with rate = median count rate of data. |
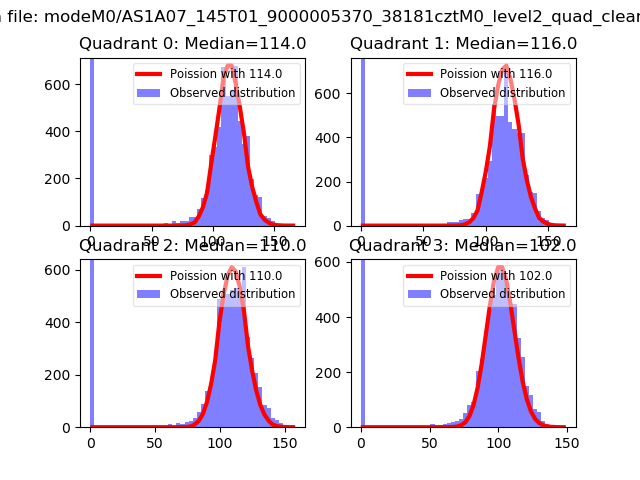 |
 |
| Quadrant-wise count rates Data is divided into 100 sec bins |
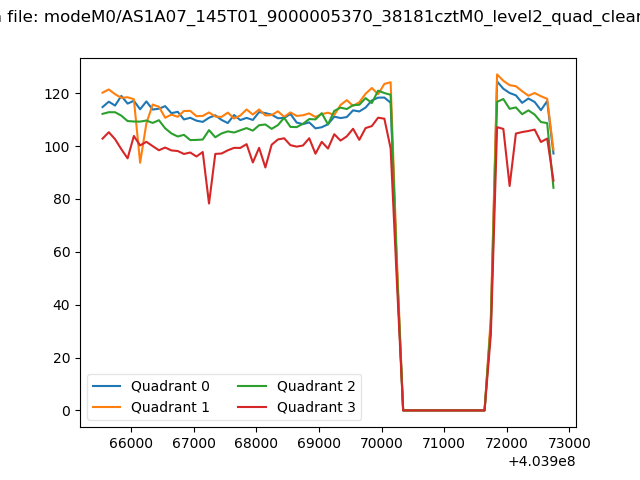 |
|
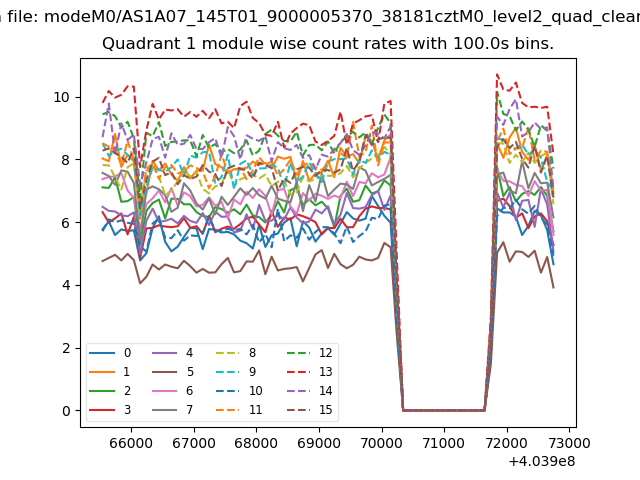
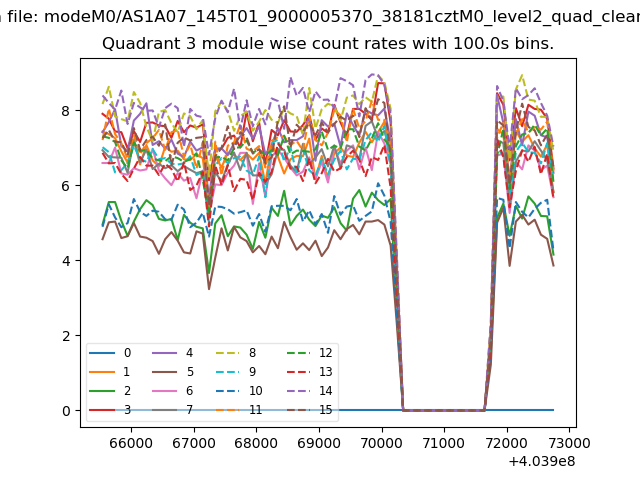
| Module-wise count rates for Quadrant A Data is divided into 100 sec bins |
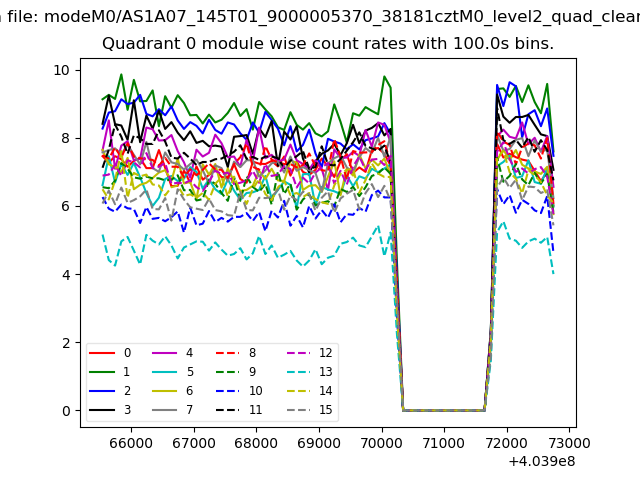 |
 |
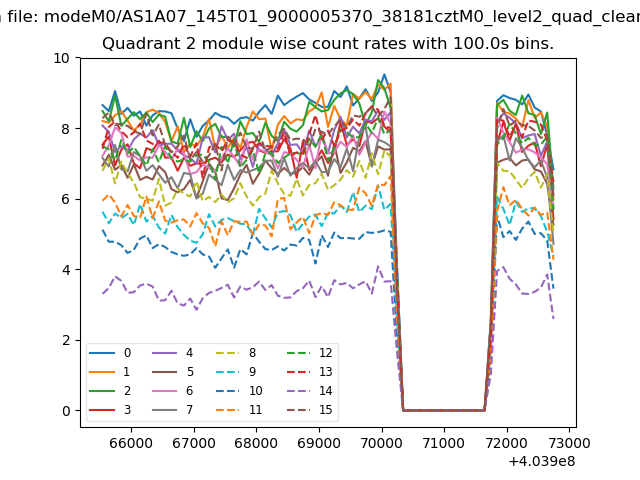
| Module-wise count rates for Quadrant B Data is divided into 100 sec bins |
 |
 |
| Module-wise count rates for Quadrant C Data is divided into 100 sec bins |
 |
 |
| Module-wise count rates for Quadrant D Data is divided into 100 sec bins |
 |
 |
| Parameter | Plot |
|---|---|
| CZT HV Monitor | 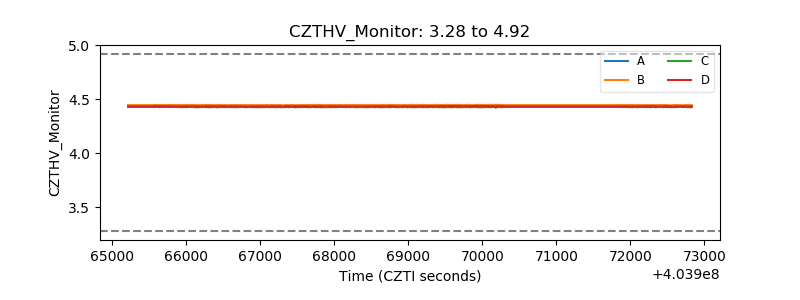 |
| D_VDD | 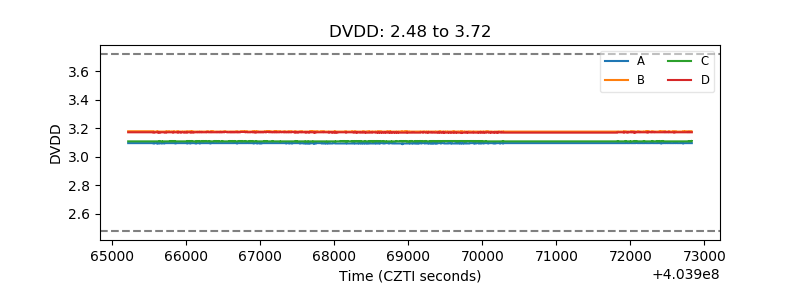 |
| Temperature 1 | 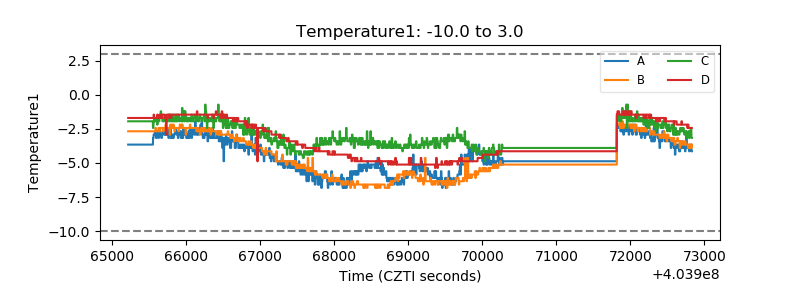 |
| Veto HV Monitor | 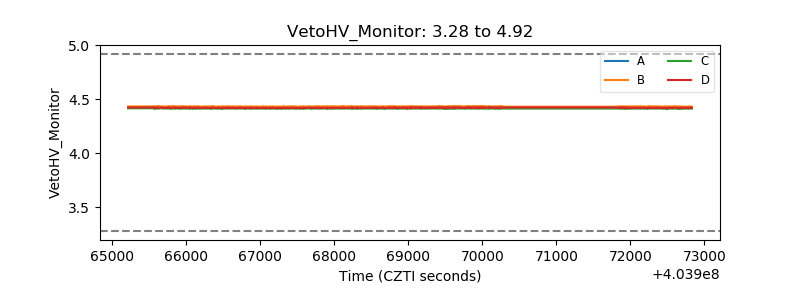 |
| Veto LLD | 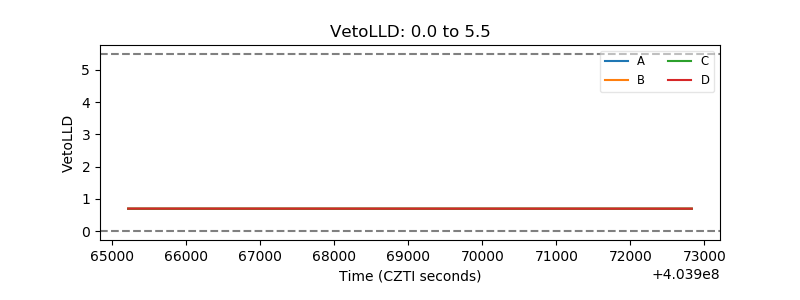 |
| Alpha Counter | 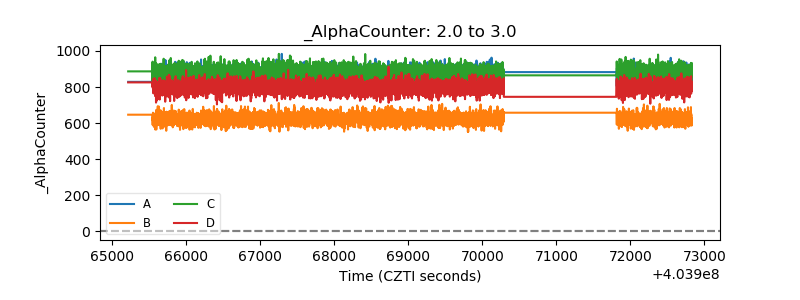 |
| _CPM_Rate | 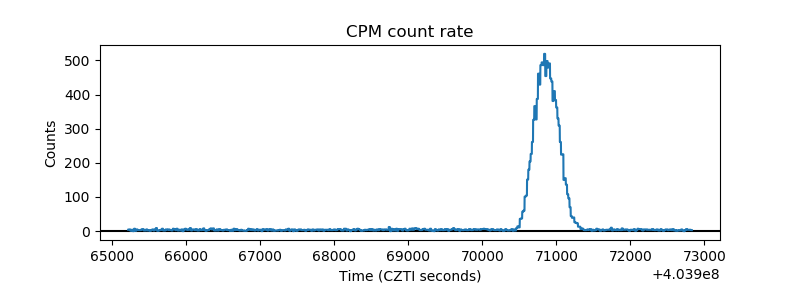 |
| CZT Counter | 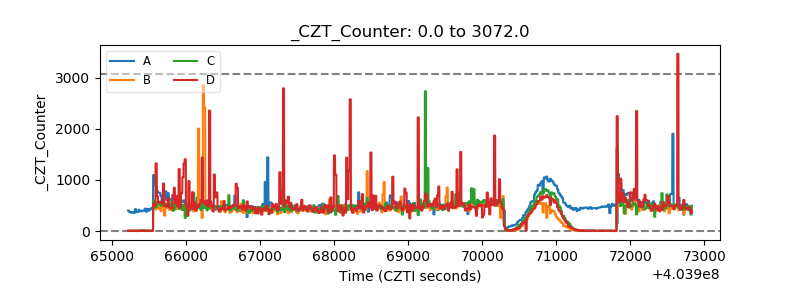 |
| +2.5 Volts monitor | 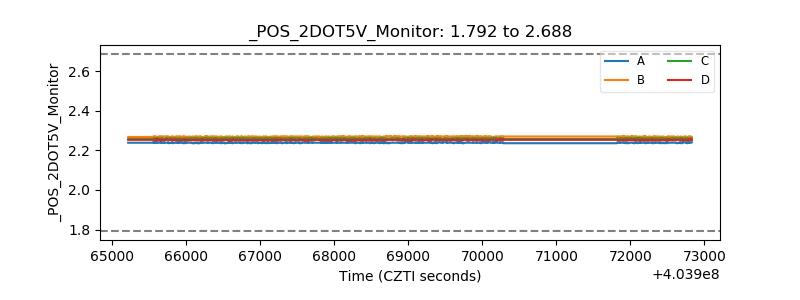 |
| +5 Volts monitor | 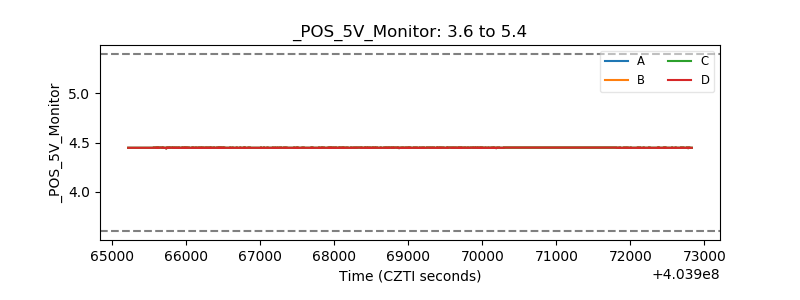 |
| _ROLL_ROT | 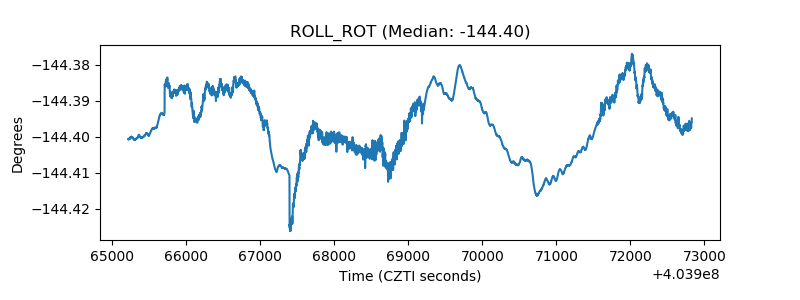 |
| _Roll_DEC | 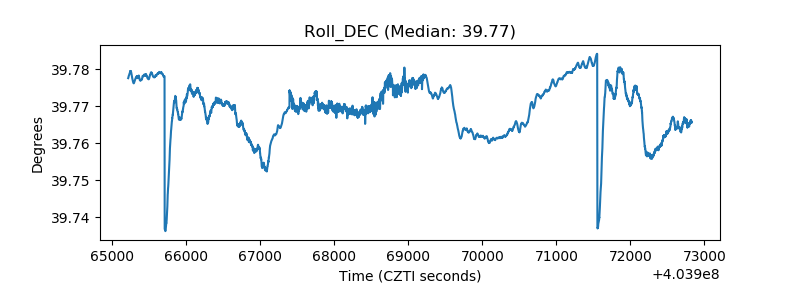 |
| _Roll_RA | 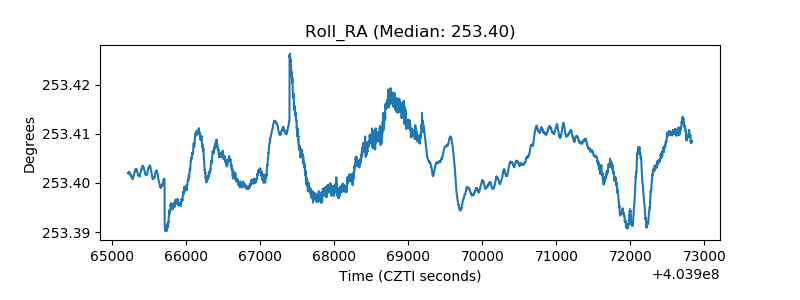 |
| Veto Counter | 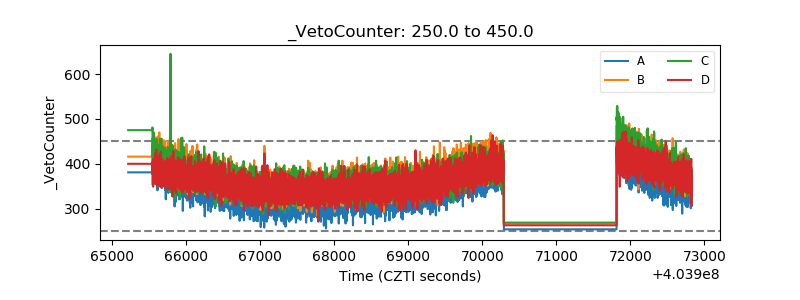 |