| Param | Original file | Final file |
|---|---|---|
| Filename | modeM0/AS1A07_145T01_9000005370_38182cztM0_level2.fits | modeM0/AS1A07_145T01_9000005370_38182cztM0_level2_quad_clean.evt |
| Size (bytes) | 325,474,560 | 97,968,960 |
| Size | 310.4 MB | 93.4 MB |
| Events in quadrant A | 3,034,027 | 660,730 |
| Events in quadrant B | 2,661,764 | 673,950 |
| Events in quadrant C | 2,862,056 | 640,588 |
| Events in quadrant D | 3,044,911 | 591,847 |
| Mode M9 | |||
|---|---|---|---|
| Quadrant | BADHDUFLAG | Total packets | Discarded packets |
| A | 0 | 21 | 0 |
| B | 0 | 21 | 0 |
| C | 0 | 21 | 0 |
| D | 0 | 22 | 0 |
| Mode SS | |||
|---|---|---|---|
| Quadrant | BADHDUFLAG | Total packets | Discarded packets |
| A | 0 | 116 | 0 |
| B | 0 | 116 | 0 |
| C | 0 | 116 | 0 |
| D | 0 | 116 | 0 |
| Mode M0 | |||
|---|---|---|---|
| Quadrant | BADHDUFLAG | Total packets | Discarded packets |
| A | 0 | 12486 | 3 |
| B | 0 | 11751 | 2 |
| C | 0 | 11936 | 2 |
| D | 0 | 12837 | 2 |
| Quadrant | Total seconds | Saturated seconds | Saturation percentage |
|---|---|---|---|
| A | 5712 | 13 | 0.227591% |
| B | 5712 | 16 | 0.280112% |
| C | 5712 | 27 | 0.472689% |
| D | 5712 | 91 | 1.593137% |
Noise dominated data is calculated using 1-second bins in cleaned event files. If a bin has >2000 counts, and if more than 50% of those come from <1% of pixels, then it is considered to be noise-dominated and hence unusable.
| Quadrant | # 1 sec bins | Bins with >0 counts | Bins with >2000 counts | High rate bins dominated by noise | Noise dominated (total time) | Noise dominated (detector-on time) | Marked lightcurve |
|---|---|---|---|---|---|---|---|
| A | 7385 | 5713 | 6 | 6 | 0.08% | 0.11% | 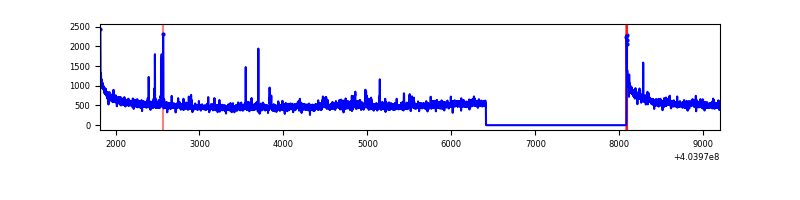 |
| B | 7384 | 5711 | 5 | 5 | 0.07% | 0.09% | 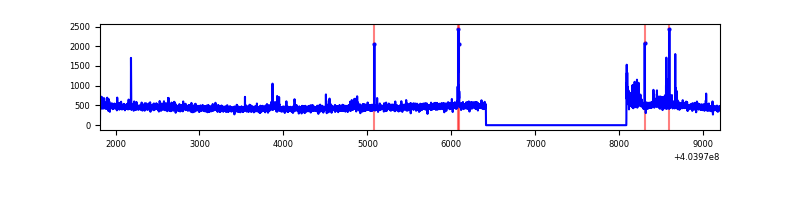 |
| C | 7384 | 5712 | 23 | 23 | 0.31% | 0.40% | 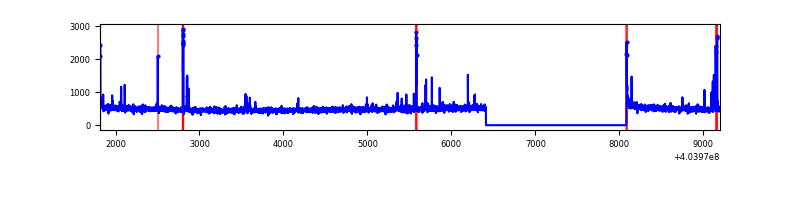 |
| D | 7384 | 5712 | 79 | 79 | 1.07% | 1.38% | 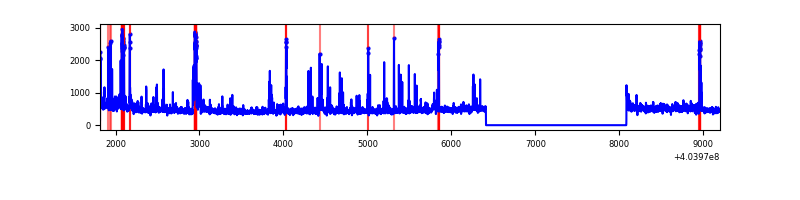 |
Top three noisy pixels from each quadrant. If the there are fewer than three noisy pixels in the level2.evt file, extra rows are filled as -1
| Pixel properties | Quadrant properties | ||||||
|---|---|---|---|---|---|---|---|
| Quadrant | DetID | PixID | Counts | Sigma | Mean | Median | Sigma |
| A | 10 | 83 | 400045 | 3032.95 | 644 | 629 | 131.7 |
| A | 12 | 189 | 101866 | 768.74 | 644 | 629 | 131.7 |
| A | 9 | 143 | 23123 | 170.8 | 644 | 629 | 131.7 |
| B | 0 | 229 | 48383 | 387.23 | 643 | 626 | 123.3 |
| B | 0 | 230 | 24543 | 193.93 | 643 | 626 | 123.3 |
| B | 5 | 172 | 21638 | 170.37 | 643 | 626 | 123.3 |
| C | 15 | 214 | 237928 | 1603.09 | 632 | 636 | 148.0 |
| C | 14 | 254 | 55324 | 369.46 | 632 | 636 | 148.0 |
| C | 2 | 16 | 44286 | 294.89 | 632 | 636 | 148.0 |
| D | 7 | 55 | 160078 | 1046.69 | 630 | 612 | 152.4 |
| D | 12 | 227 | 60964 | 396.13 | 630 | 612 | 152.4 |
| D | 13 | 138 | 57199 | 371.42 | 630 | 612 | 152.4 |
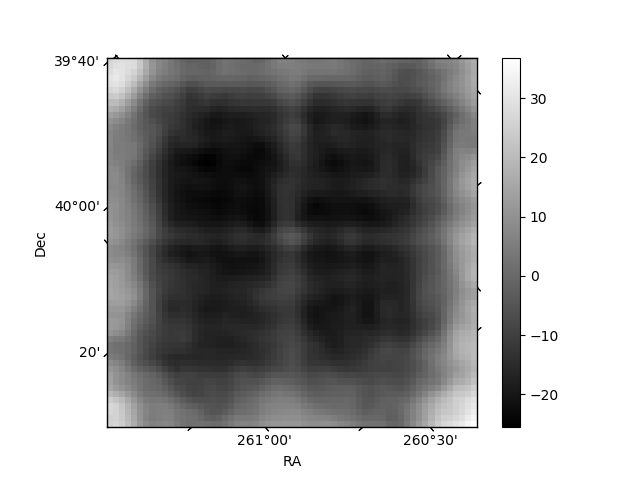
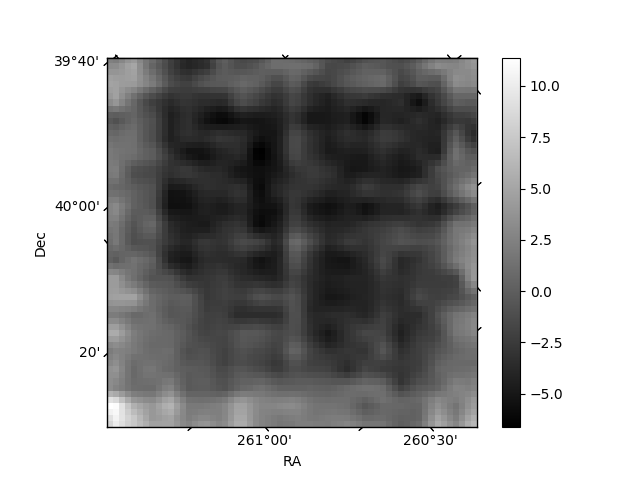
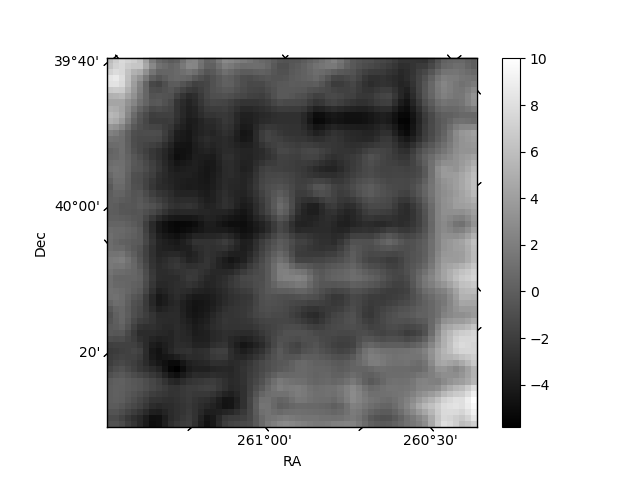
Histogram calculated using DETX and DETY for each event in the final _common_clean file
| Quadrant A | 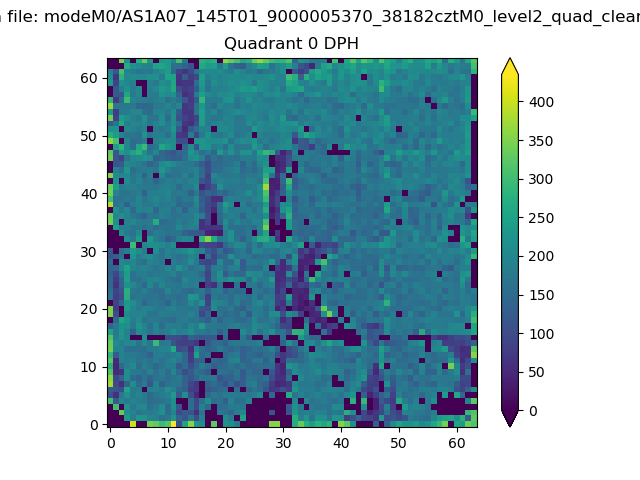 |
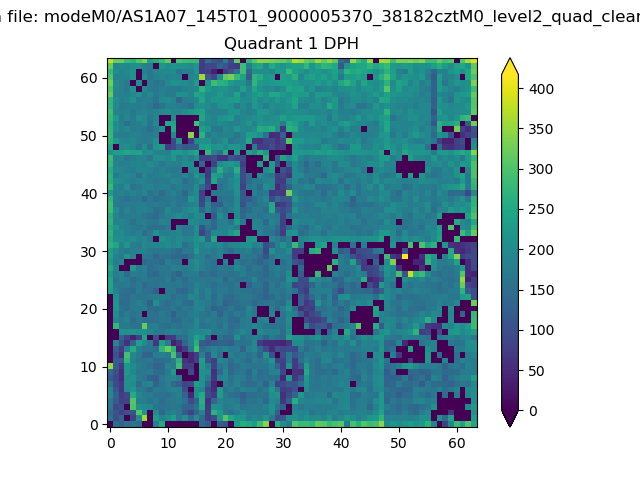 |
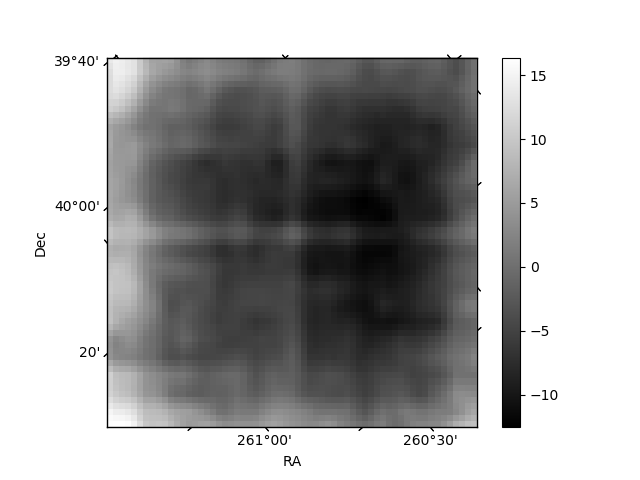
Quadrant B |
|---|---|---|---|
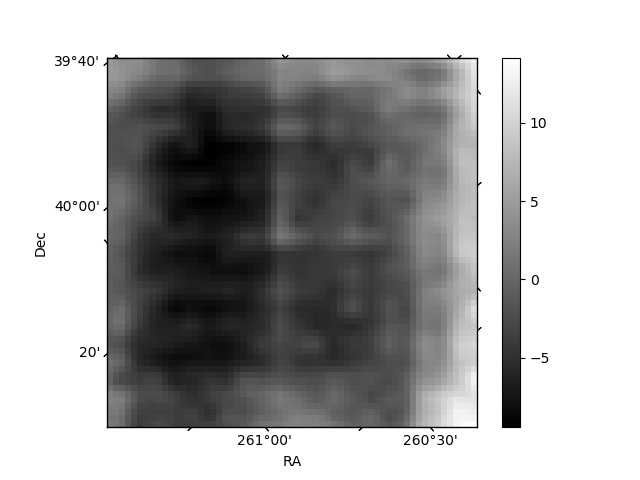
| Quadrant D | 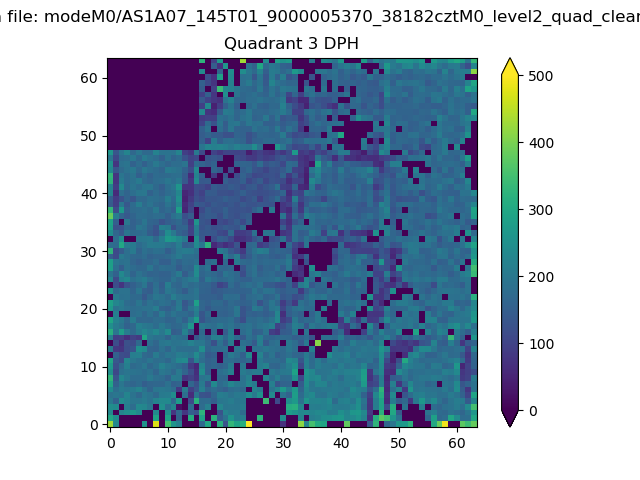 |
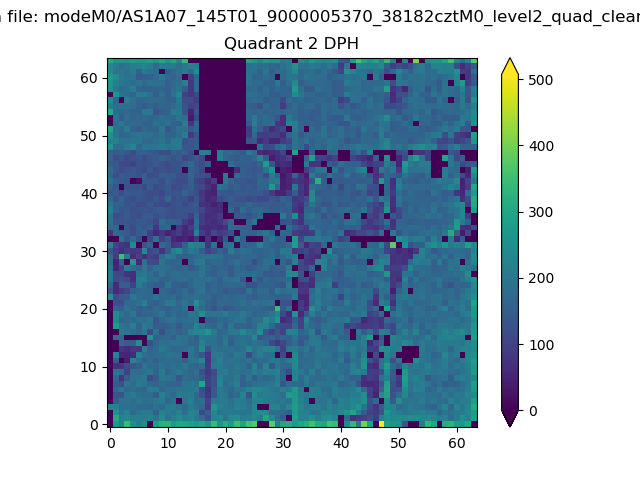 |
Quadrant C |
| Plot type | Count rate plots | Images |
|---|---|---|
| Comparison with Poisson distribution Blue bars denote a histogram of data divided into 1 sec bins. Red curve is a Poisson curve with rate = median count rate of data. |
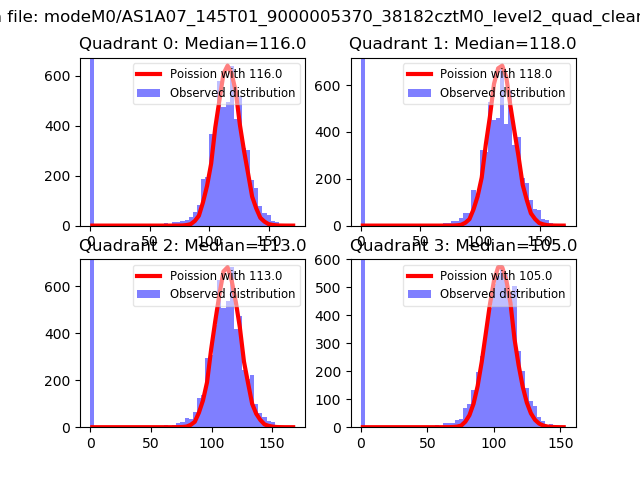 |
 |
| Quadrant-wise count rates Data is divided into 100 sec bins |
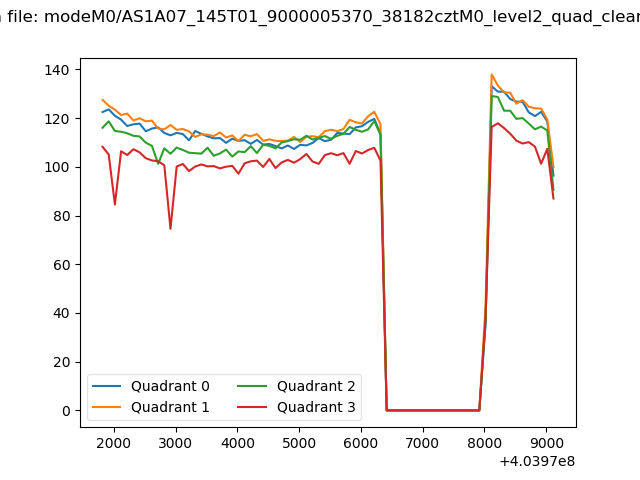 |
|
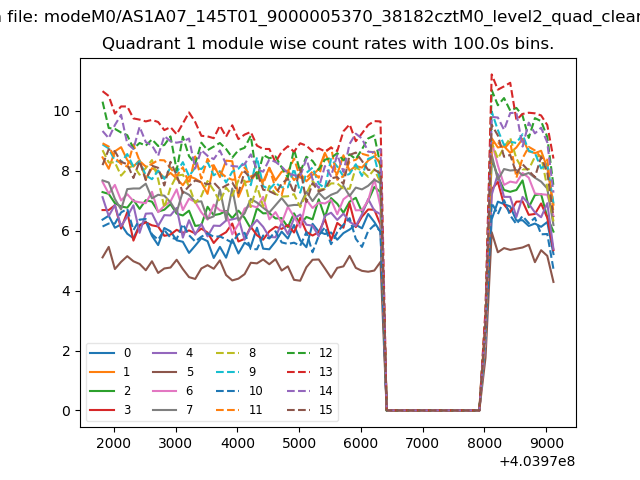
| Module-wise count rates for Quadrant A Data is divided into 100 sec bins |
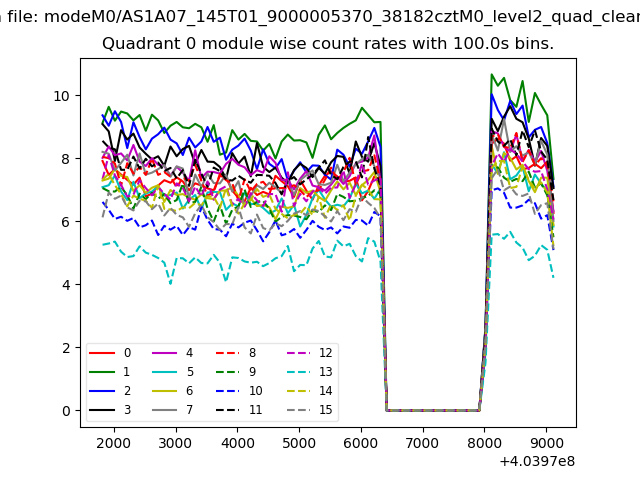 |
 |
| Module-wise count rates for Quadrant B Data is divided into 100 sec bins |
 |
 |
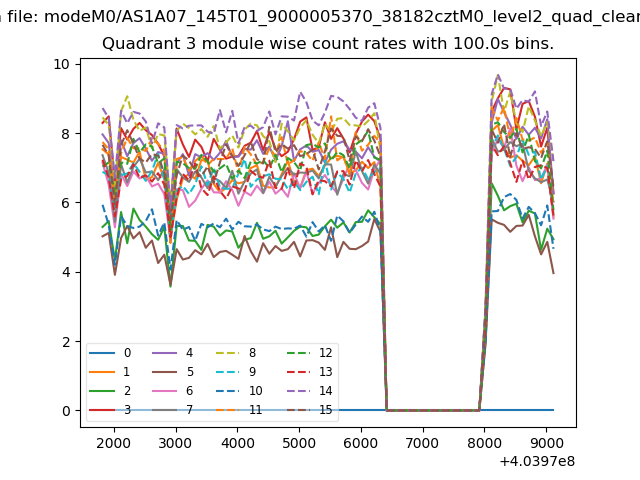
| Module-wise count rates for Quadrant C Data is divided into 100 sec bins |
 |
 |
| Module-wise count rates for Quadrant D Data is divided into 100 sec bins |
 |
 |
| Parameter | Plot |
|---|---|
| CZT HV Monitor | 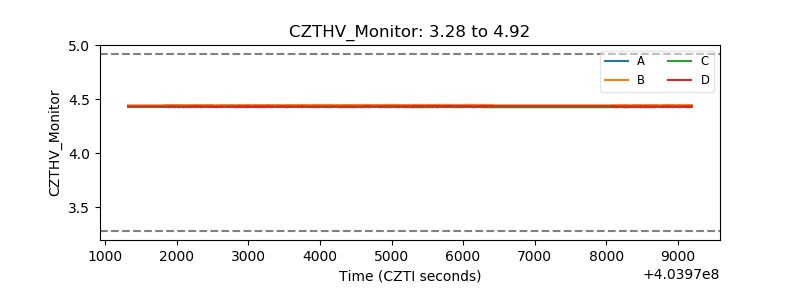 |
| D_VDD | 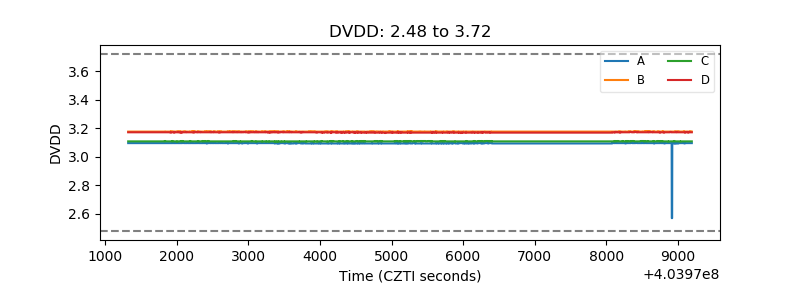 |
| Temperature 1 | 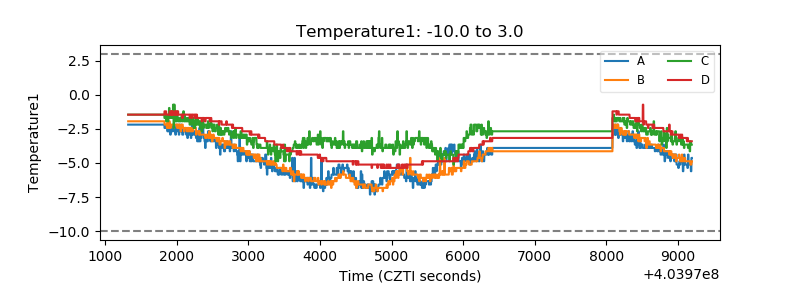 |
| Veto HV Monitor | 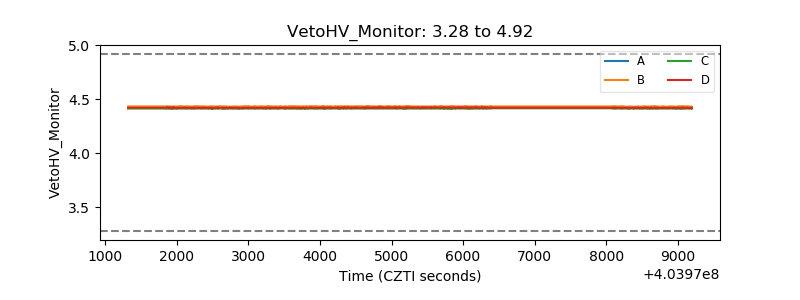 |
| Veto LLD | 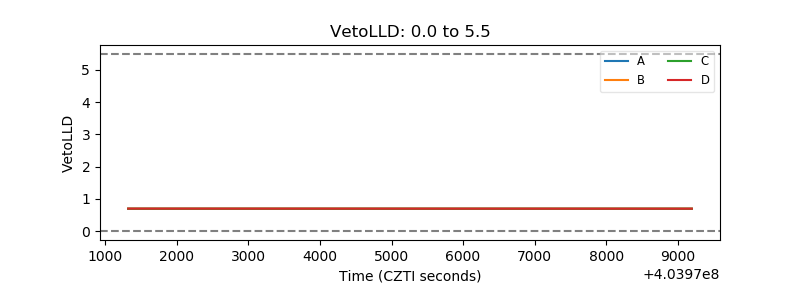 |
| Alpha Counter | 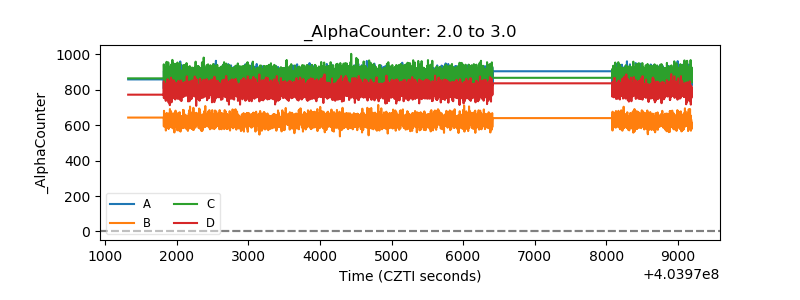 |
| _CPM_Rate | 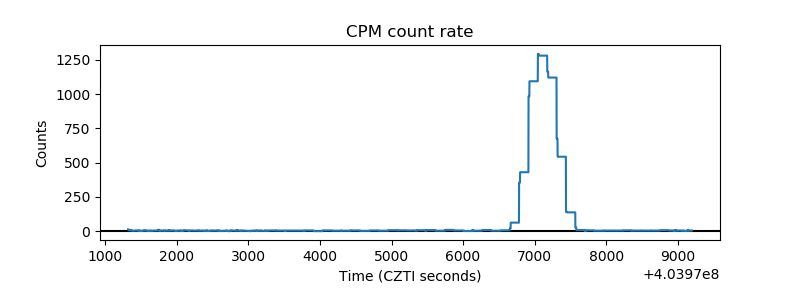 |
| CZT Counter | 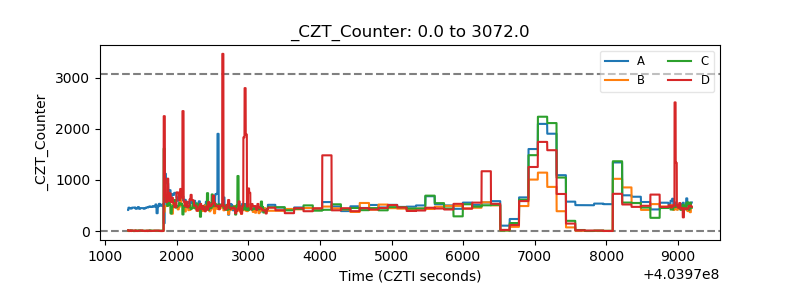 |
| +2.5 Volts monitor |  |
| +5 Volts monitor |  |
| _ROLL_ROT | 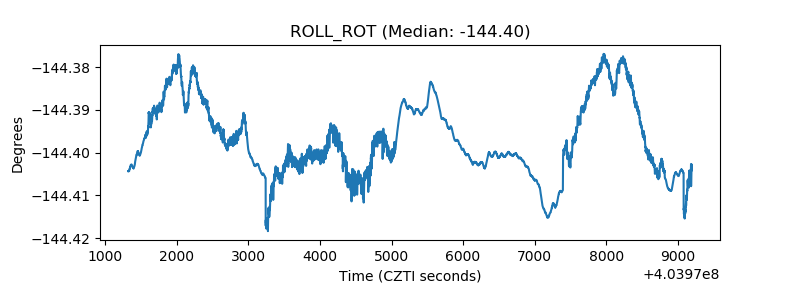 |
| _Roll_DEC | 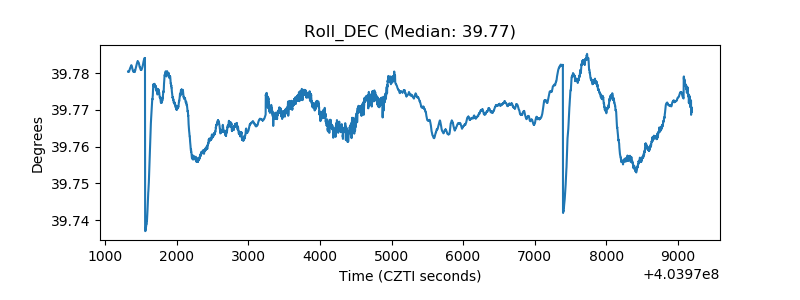 |
| _Roll_RA | 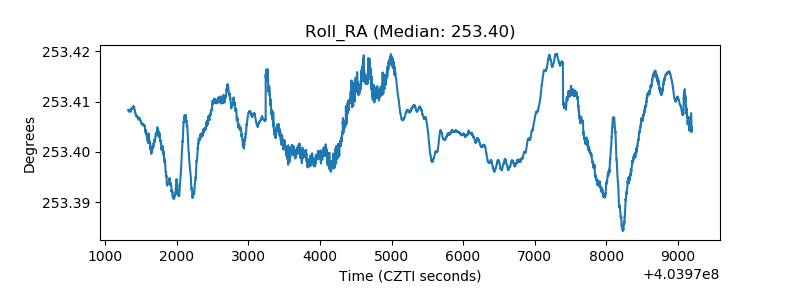 |
| Veto Counter | 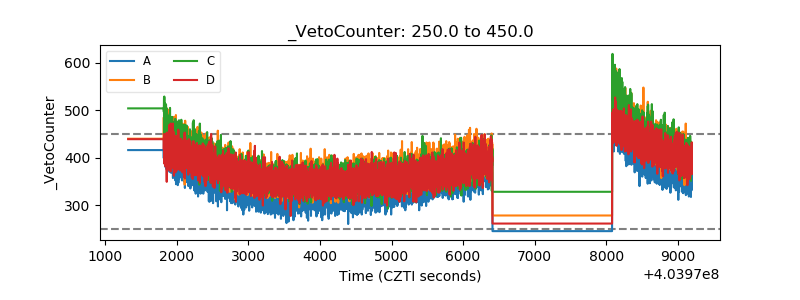 |