| Param | Original file | Final file |
|---|---|---|
| Filename | modeM0/AS1A07_145T01_9000005370_38184cztM0_level2.fits | modeM0/AS1A07_145T01_9000005370_38184cztM0_level2_quad_clean.evt |
| Size (bytes) | 313,032,960 | 94,512,960 |
| Size | 298.5 MB | 90.1 MB |
| Events in quadrant A | 2,937,634 | 636,367 |
| Events in quadrant B | 2,606,166 | 653,408 |
| Events in quadrant C | 2,865,546 | 622,155 |
| Events in quadrant D | 2,763,731 | 577,752 |
| Mode M9 | |||
|---|---|---|---|
| Quadrant | BADHDUFLAG | Total packets | Discarded packets |
| A | 0 | 23 | 0 |
| B | 0 | 23 | 0 |
| C | 0 | 23 | 0 |
| D | 0 | 24 | 0 |
| Mode SS | |||
|---|---|---|---|
| Quadrant | BADHDUFLAG | Total packets | Discarded packets |
| A | 0 | 108 | 0 |
| B | 0 | 108 | 0 |
| C | 0 | 108 | 0 |
| D | 0 | 108 | 0 |
| Mode M0 | |||
|---|---|---|---|
| Quadrant | BADHDUFLAG | Total packets | Discarded packets |
| A | 0 | 12004 | 3 |
| B | 0 | 11138 | 2 |
| C | 0 | 11705 | 2 |
| D | 0 | 11628 | 2 |
| Quadrant | Total seconds | Saturated seconds | Saturation percentage |
|---|---|---|---|
| A | 5318 | 26 | 0.488906% |
| B | 5318 | 19 | 0.357277% |
| C | 5318 | 43 | 0.808575% |
| D | 5318 | 36 | 0.676946% |
Noise dominated data is calculated using 1-second bins in cleaned event files. If a bin has >2000 counts, and if more than 50% of those come from <1% of pixels, then it is considered to be noise-dominated and hence unusable.
| Quadrant | # 1 sec bins | Bins with >0 counts | Bins with >2000 counts | High rate bins dominated by noise | Noise dominated (total time) | Noise dominated (detector-on time) | Marked lightcurve |
|---|---|---|---|---|---|---|---|
| A | 7110 | 5319 | 19 | 19 | 0.27% | 0.36% | 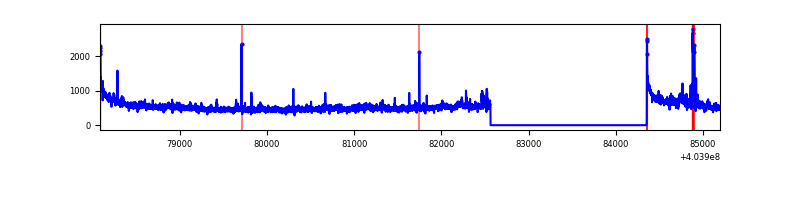 |
| B | 7109 | 5318 | 10 | 10 | 0.14% | 0.19% | 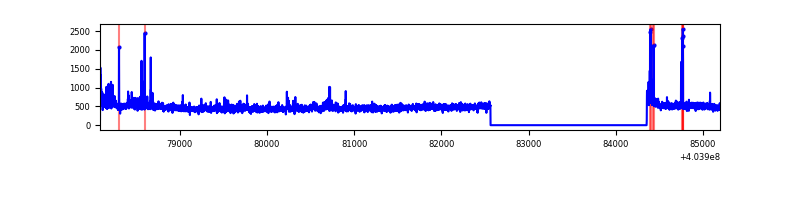 |
| C | 7110 | 5319 | 42 | 42 | 0.59% | 0.79% | 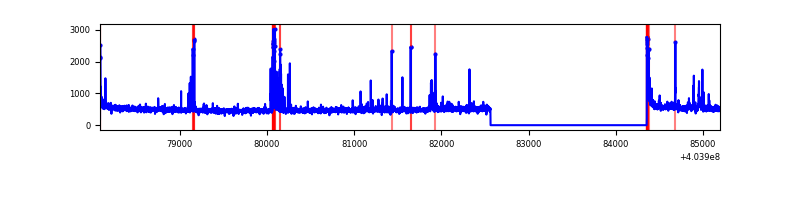 |
| D | 7110 | 5319 | 42 | 42 | 0.59% | 0.79% | 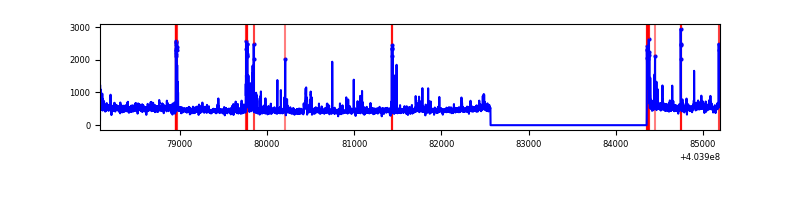 |
Top three noisy pixels from each quadrant. If the there are fewer than three noisy pixels in the level2.evt file, extra rows are filled as -1
| Pixel properties | Quadrant properties | ||||||
|---|---|---|---|---|---|---|---|
| Quadrant | DetID | PixID | Counts | Sigma | Mean | Median | Sigma |
| A | 10 | 83 | 381890 | 3079.81 | 610 | 598 | 123.8 |
| A | 12 | 189 | 147607 | 1187.44 | 610 | 598 | 123.8 |
| A | 9 | 143 | 40608 | 323.17 | 610 | 598 | 123.8 |
| B | 0 | 229 | 52134 | 436.86 | 612 | 596 | 118.0 |
| B | 0 | 230 | 33559 | 279.41 | 612 | 596 | 118.0 |
| B | 0 | 199 | 32379 | 269.41 | 612 | 596 | 118.0 |
| C | 15 | 214 | 222801 | 1584.87 | 602 | 607 | 140.2 |
| C | 2 | 16 | 167323 | 1189.16 | 602 | 607 | 140.2 |
| C | 0 | 10 | 59105 | 417.26 | 602 | 607 | 140.2 |
| D | 12 | 233 | 74871 | 510.73 | 602 | 587 | 145.4 |
| D | 13 | 171 | 70957 | 483.82 | 602 | 587 | 145.4 |
| D | 2 | 249 | 50780 | 345.1 | 602 | 587 | 145.4 |
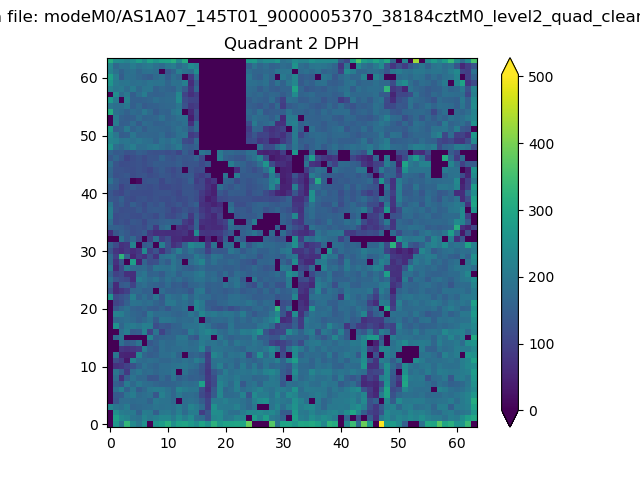
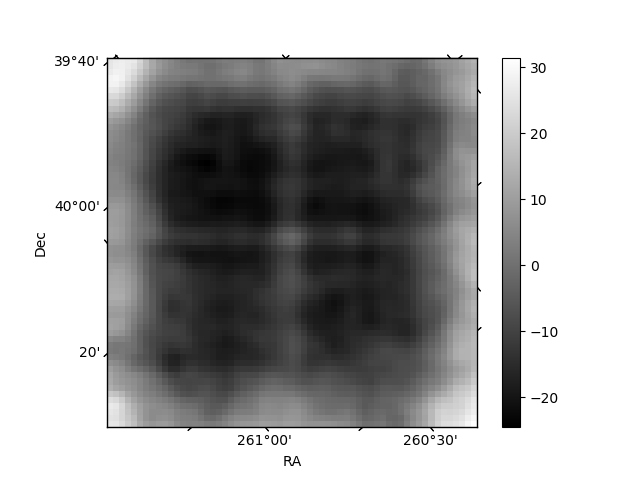
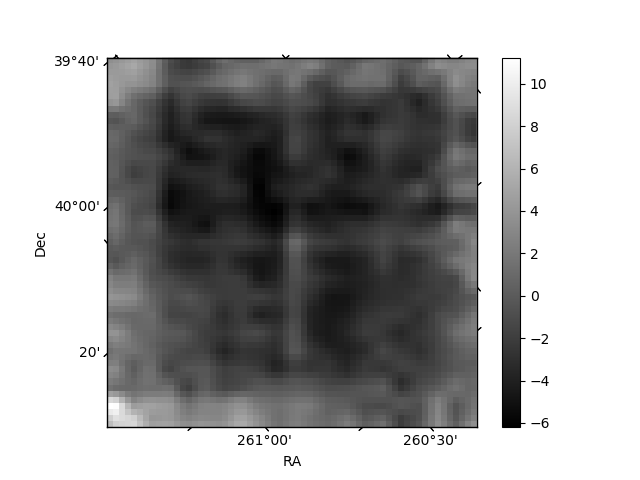
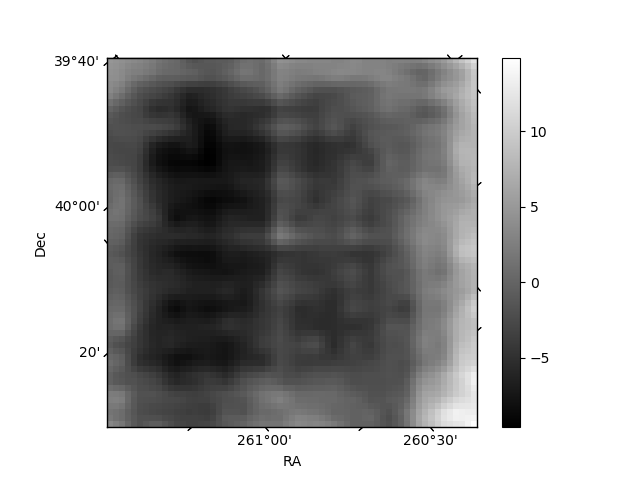
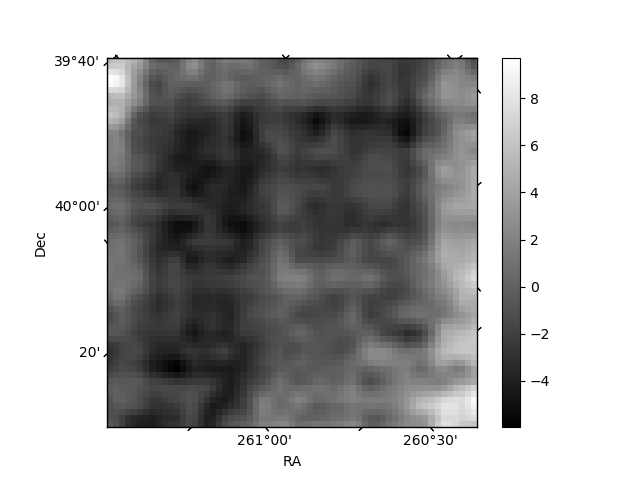
Histogram calculated using DETX and DETY for each event in the final _common_clean file
| Quadrant A | 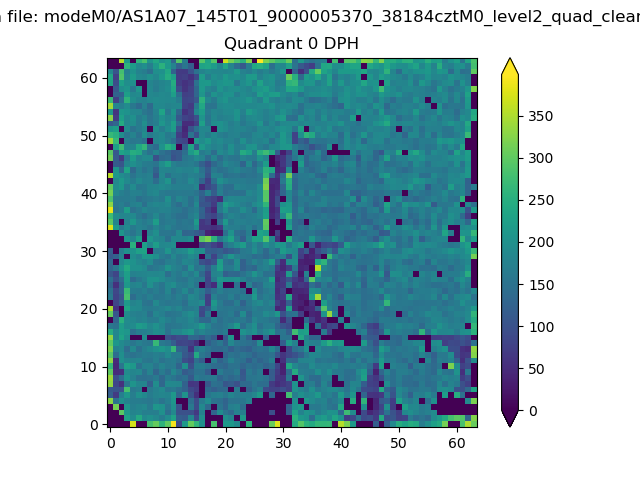 |
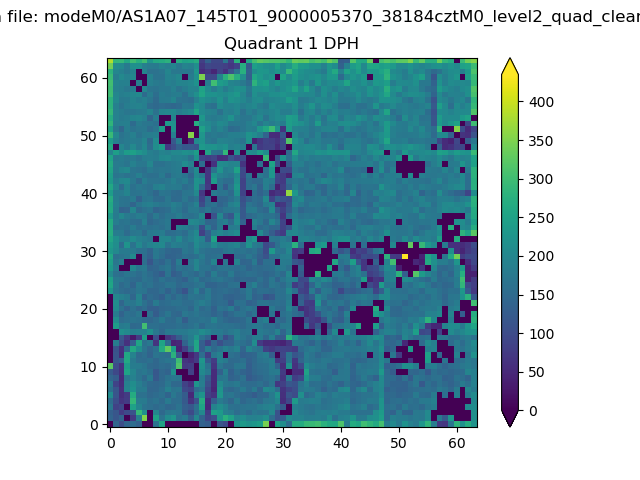 |
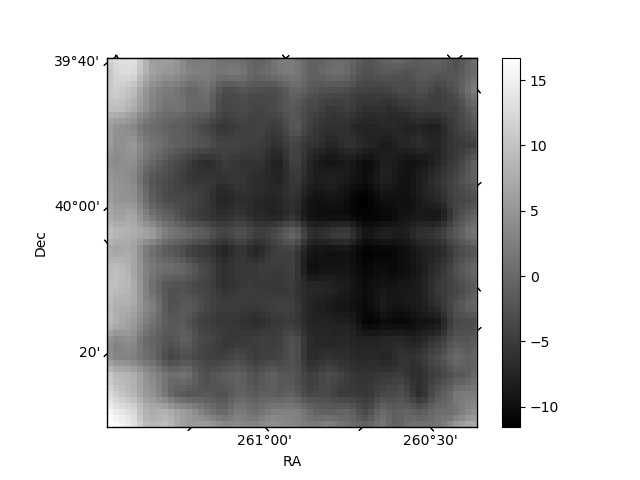
Quadrant B |
|---|---|---|---|
| Quadrant D | 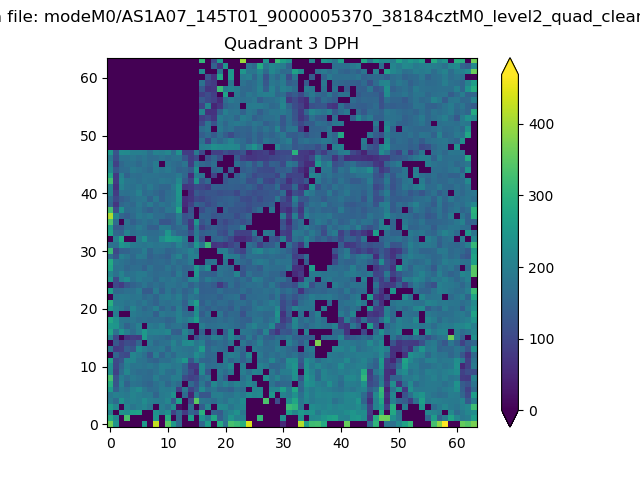 |
 |
Quadrant C |
| Plot type | Count rate plots | Images |
|---|---|---|
| Comparison with Poisson distribution Blue bars denote a histogram of data divided into 1 sec bins. Red curve is a Poisson curve with rate = median count rate of data. |
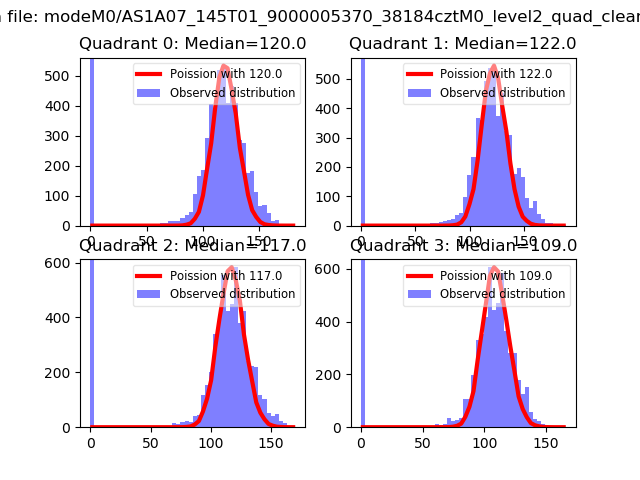 |
 |
| Quadrant-wise count rates Data is divided into 100 sec bins |
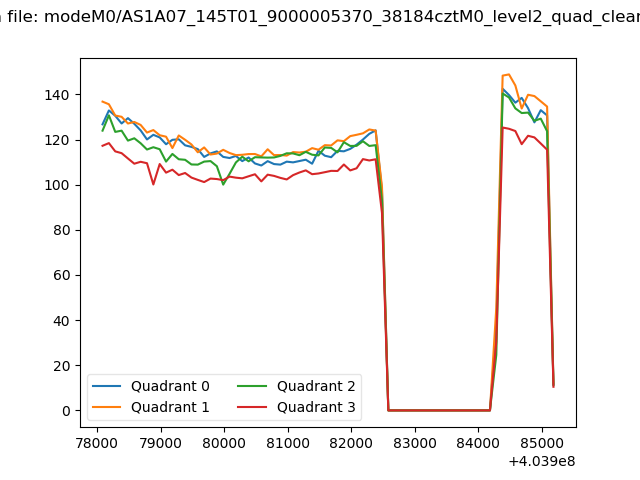 |
|
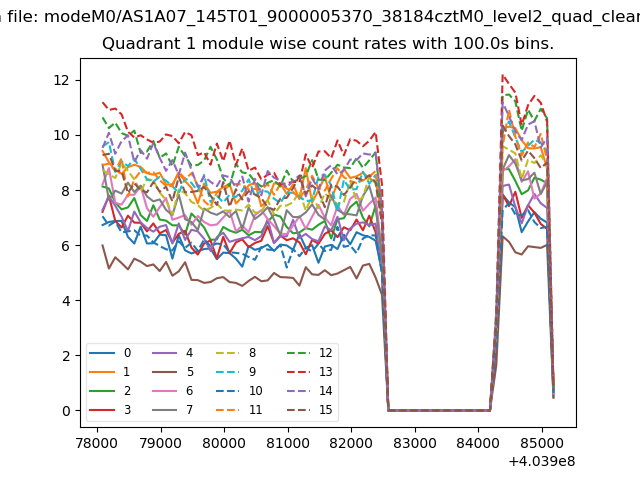
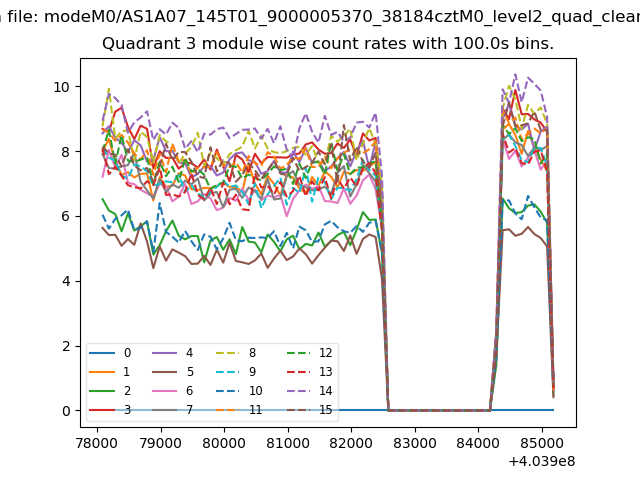
| Module-wise count rates for Quadrant A Data is divided into 100 sec bins |
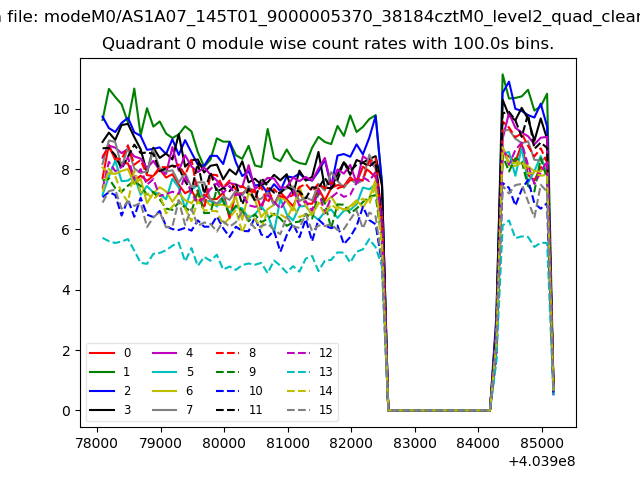 |
 |
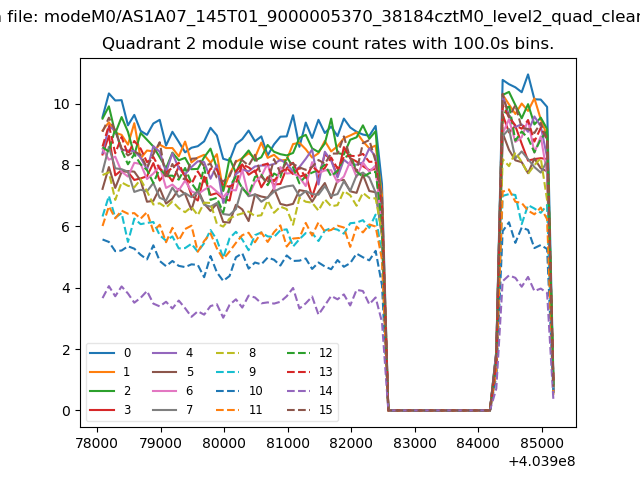
| Module-wise count rates for Quadrant B Data is divided into 100 sec bins |
 |
 |
| Module-wise count rates for Quadrant C Data is divided into 100 sec bins |
 |
 |
| Module-wise count rates for Quadrant D Data is divided into 100 sec bins |
 |
 |
| Parameter | Plot |
|---|---|
| CZT HV Monitor | 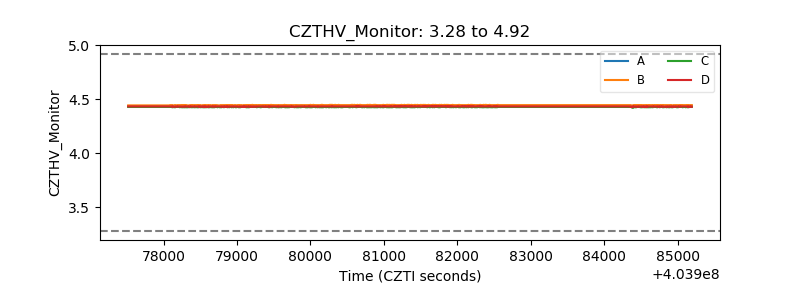 |
| D_VDD | 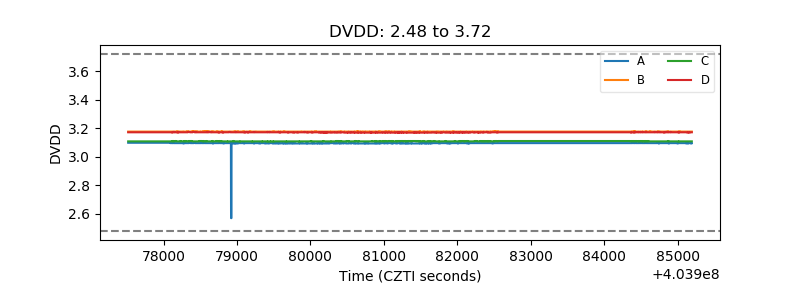 |
| Temperature 1 | 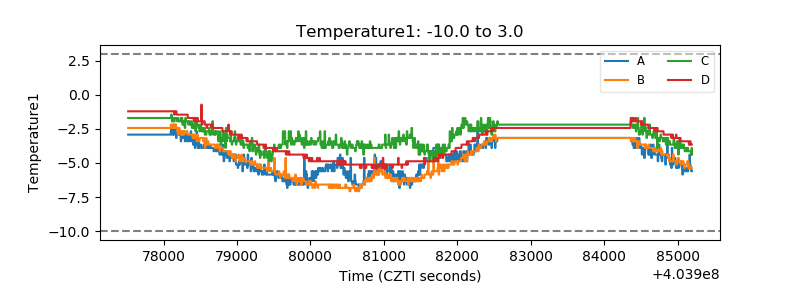 |
| Veto HV Monitor | 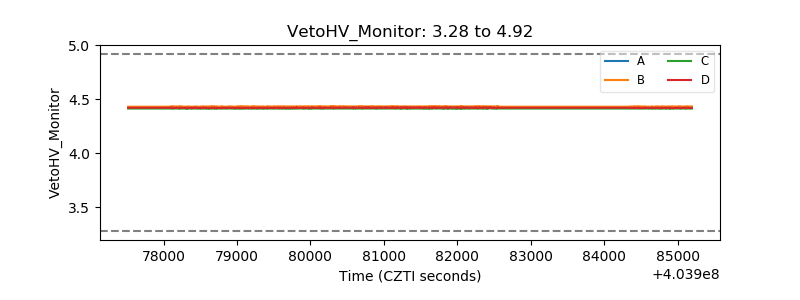 |
| Veto LLD | 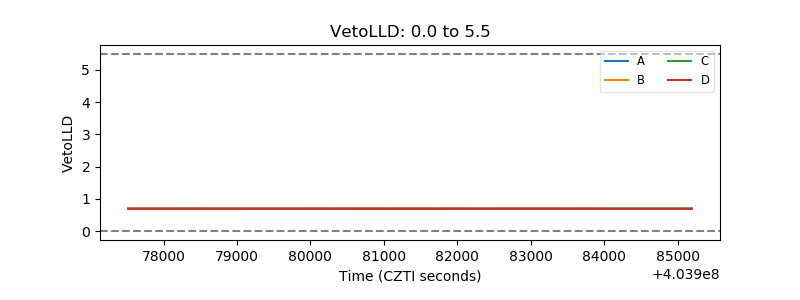 |
| Alpha Counter | 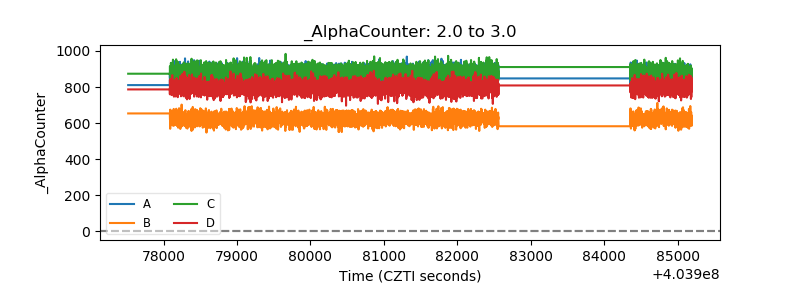 |
| _CPM_Rate | 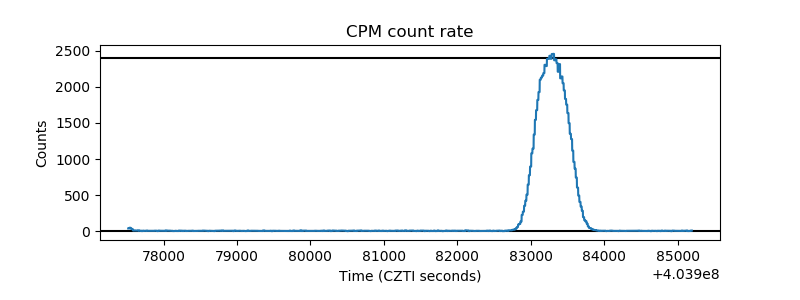 |
| CZT Counter | 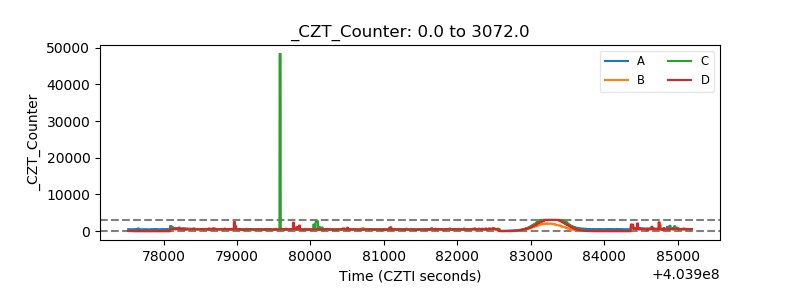 |
| +2.5 Volts monitor | 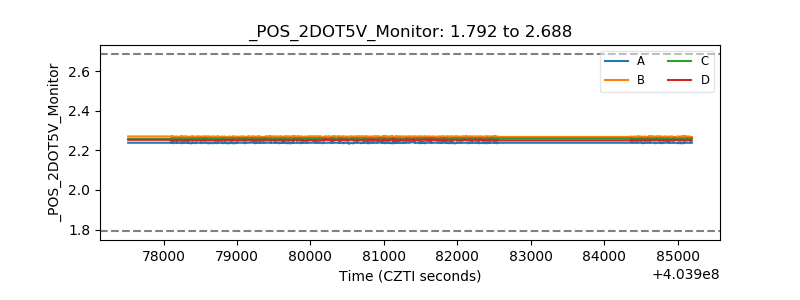 |
| +5 Volts monitor | 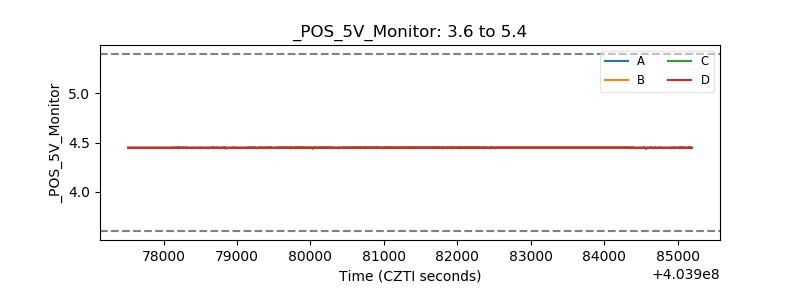 |
| _ROLL_ROT | 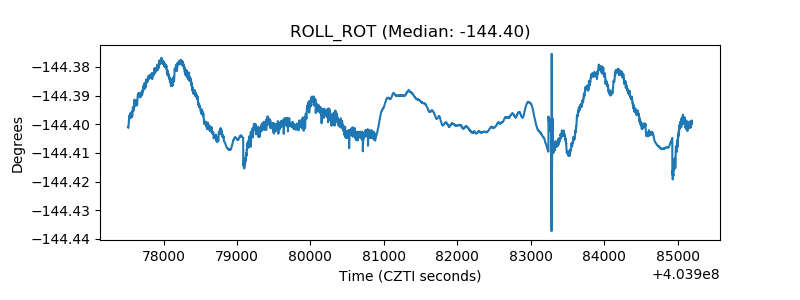 |
| _Roll_DEC | 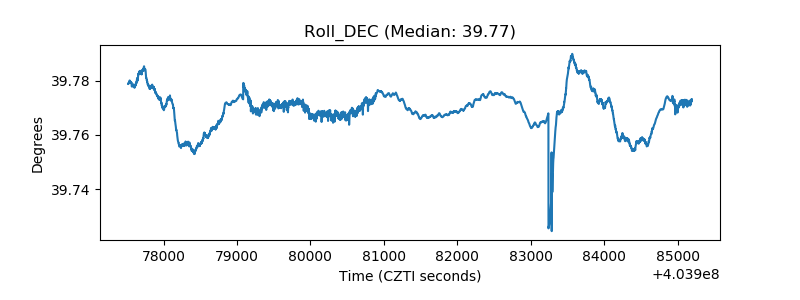 |
| _Roll_RA | 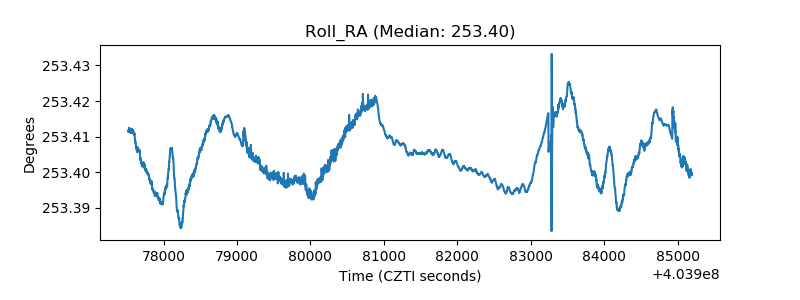 |
| Veto Counter | 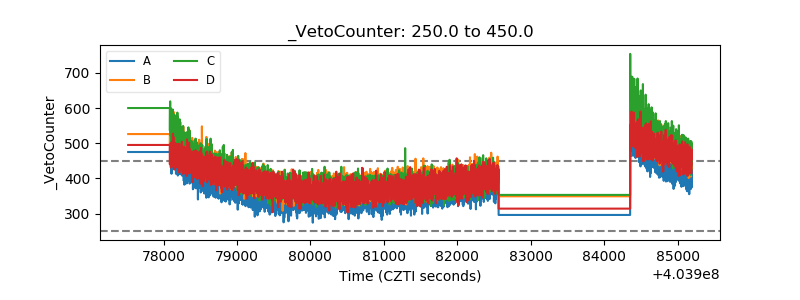 |