| Param | Original file | Final file |
|---|---|---|
| Filename | modeM0/AS1A07_145T01_9000005370_38185cztM0_level2.fits | modeM0/AS1A07_145T01_9000005370_38185cztM0_level2_quad_clean.evt |
| Size (bytes) | 324,106,560 | 95,685,120 |
| Size | 309.1 MB | 91.3 MB |
| Events in quadrant A | 3,003,623 | 647,156 |
| Events in quadrant B | 2,571,014 | 671,729 |
| Events in quadrant C | 3,026,163 | 632,388 |
| Events in quadrant D | 2,993,127 | 583,746 |
| Mode M9 | |||
|---|---|---|---|
| Quadrant | BADHDUFLAG | Total packets | Discarded packets |
| A | 0 | 26 | 0 |
| B | 0 | 26 | 0 |
| C | 0 | 26 | 0 |
| D | 0 | 27 | 0 |
| Mode SS | |||
|---|---|---|---|
| Quadrant | BADHDUFLAG | Total packets | Discarded packets |
| A | 0 | 104 | 0 |
| B | 0 | 104 | 0 |
| C | 0 | 104 | 0 |
| D | 0 | 104 | 0 |
| Mode M0 | |||
|---|---|---|---|
| Quadrant | BADHDUFLAG | Total packets | Discarded packets |
| A | 0 | 12206 | 3 |
| B | 0 | 10868 | 2 |
| C | 0 | 12027 | 2 |
| D | 0 | 12165 | 2 |
| Quadrant | Total seconds | Saturated seconds | Saturation percentage |
|---|---|---|---|
| A | 5180 | 26 | 0.501931% |
| B | 5180 | 29 | 0.559846% |
| C | 5180 | 121 | 2.335907% |
| D | 5180 | 105 | 2.027027% |
Noise dominated data is calculated using 1-second bins in cleaned event files. If a bin has >2000 counts, and if more than 50% of those come from <1% of pixels, then it is considered to be noise-dominated and hence unusable.
| Quadrant | # 1 sec bins | Bins with >0 counts | Bins with >2000 counts | High rate bins dominated by noise | Noise dominated (total time) | Noise dominated (detector-on time) | Marked lightcurve |
|---|---|---|---|---|---|---|---|
| A | 7122 | 5181 | 19 | 19 | 0.27% | 0.37% | 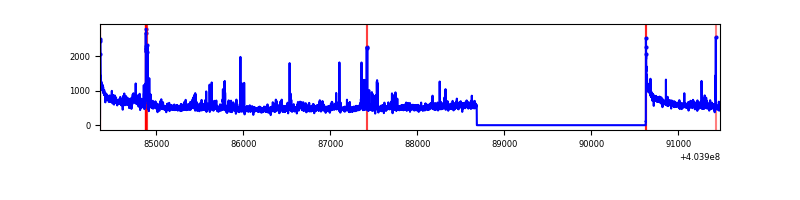 |
| B | 7122 | 5181 | 18 | 18 | 0.25% | 0.35% | 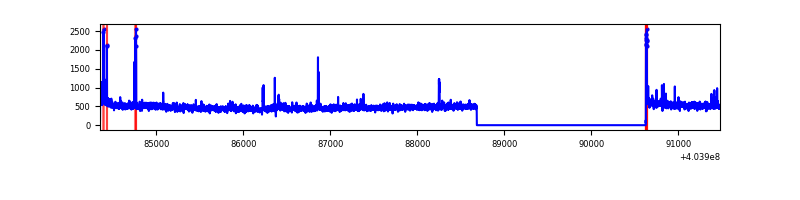 |
| C | 7122 | 5181 | 118 | 118 | 1.66% | 2.28% | 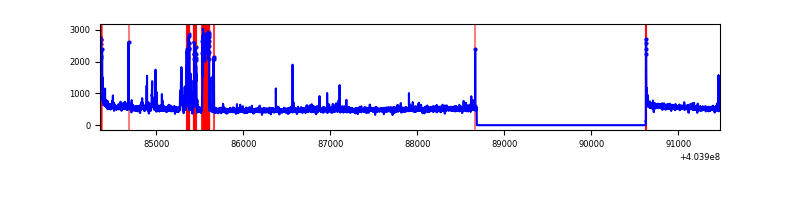 |
| D | 7122 | 5181 | 101 | 101 | 1.42% | 1.95% | 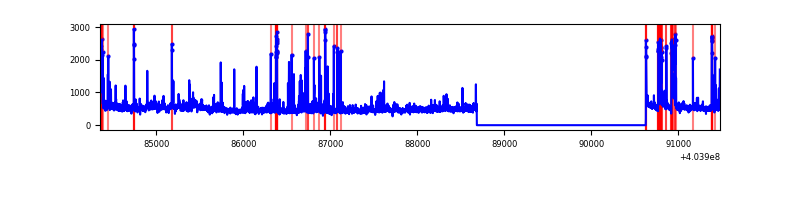 |
Top three noisy pixels from each quadrant. If the there are fewer than three noisy pixels in the level2.evt file, extra rows are filled as -1
| Pixel properties | Quadrant properties | ||||||
|---|---|---|---|---|---|---|---|
| Quadrant | DetID | PixID | Counts | Sigma | Mean | Median | Sigma |
| A | 10 | 83 | 365148 | 2972.68 | 609 | 597 | 122.6 |
| A | 12 | 189 | 184023 | 1495.72 | 609 | 597 | 122.6 |
| A | 9 | 143 | 88922 | 720.23 | 609 | 597 | 122.6 |
| B | 4 | 171 | 52544 | 444.62 | 616 | 600 | 116.8 |
| B | 0 | 229 | 28870 | 241.98 | 616 | 600 | 116.8 |
| B | 0 | 230 | 21156 | 175.95 | 616 | 600 | 116.8 |
| C | 14 | 254 | 353744 | 2508.52 | 602 | 607 | 140.8 |
| C | 15 | 214 | 216264 | 1531.93 | 602 | 607 | 140.8 |
| C | 0 | 10 | 59350 | 417.28 | 602 | 607 | 140.8 |
| D | 13 | 138 | 151736 | 1041.74 | 598 | 581 | 145.1 |
| D | 13 | 249 | 130686 | 896.67 | 598 | 581 | 145.1 |
| D | 2 | 249 | 63516 | 433.74 | 598 | 581 | 145.1 |
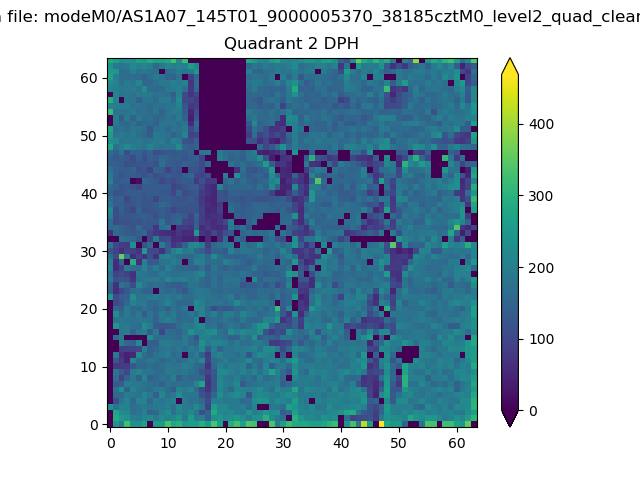
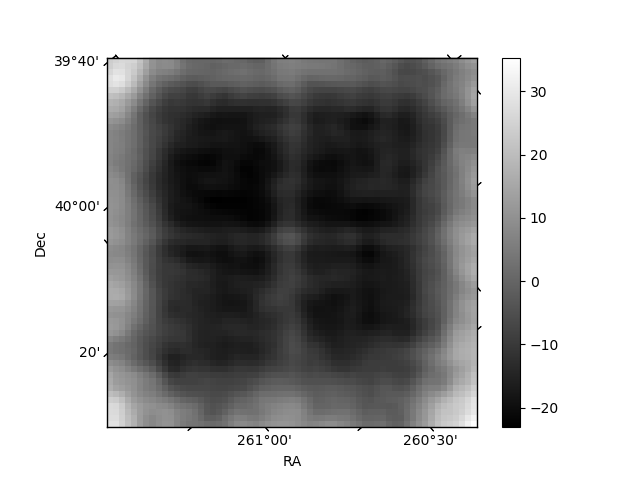
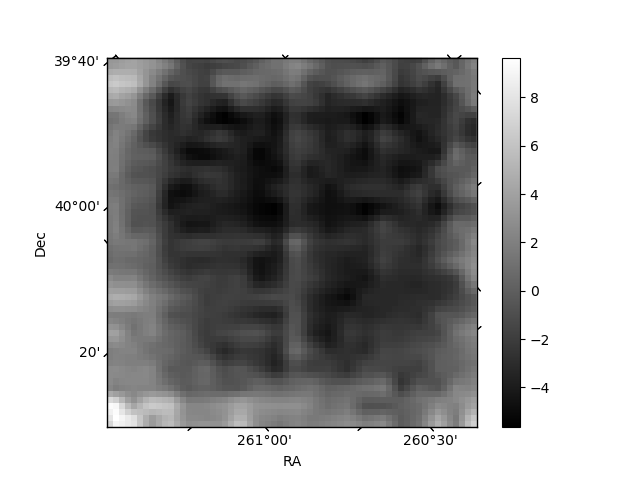
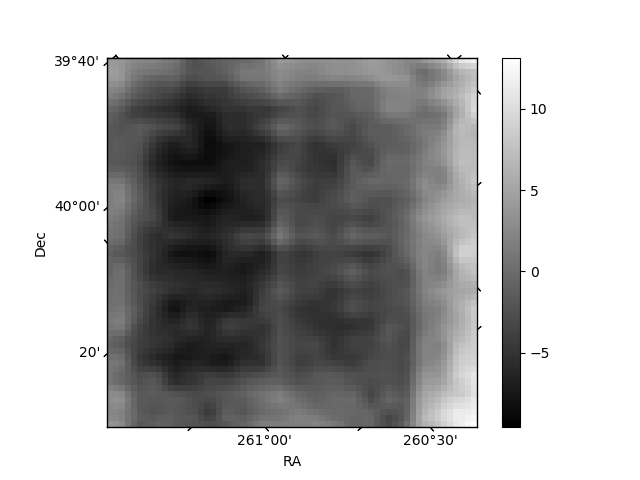
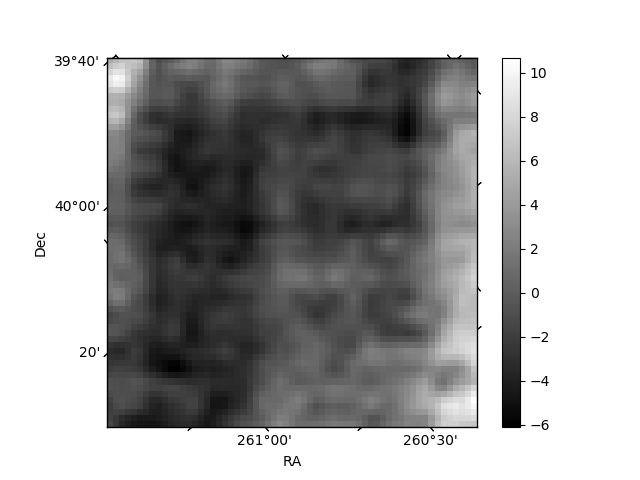
Histogram calculated using DETX and DETY for each event in the final _common_clean file
| Quadrant A | 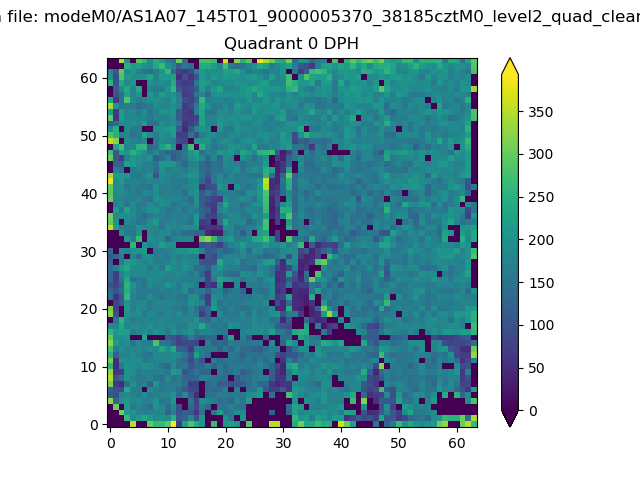 |
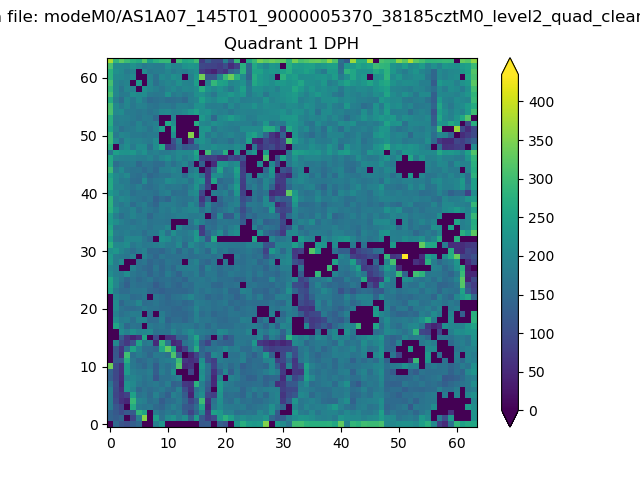 |
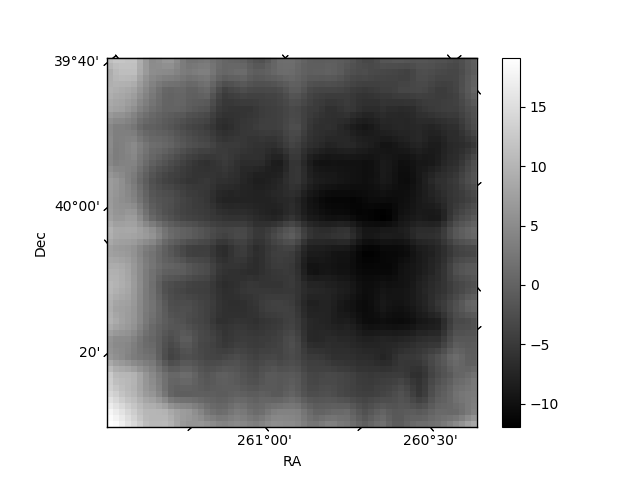
Quadrant B |
|---|---|---|---|
| Quadrant D | 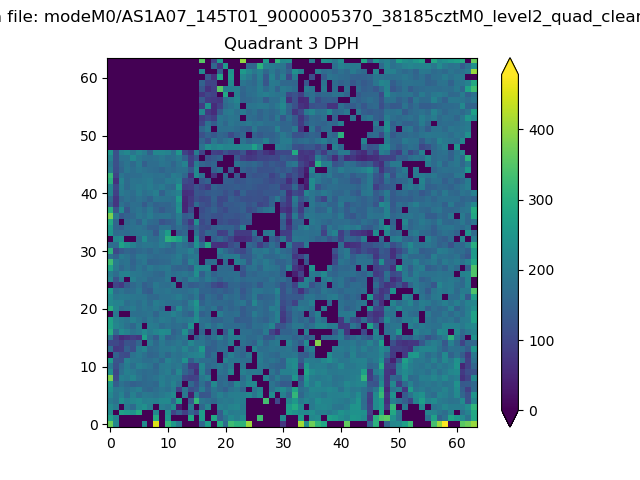 |
 |
Quadrant C |
| Plot type | Count rate plots | Images |
|---|---|---|
| Comparison with Poisson distribution Blue bars denote a histogram of data divided into 1 sec bins. Red curve is a Poisson curve with rate = median count rate of data. |
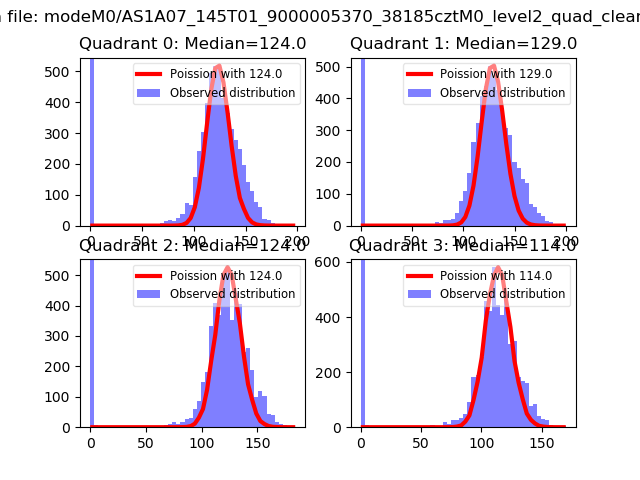 |
 |
| Quadrant-wise count rates Data is divided into 100 sec bins |
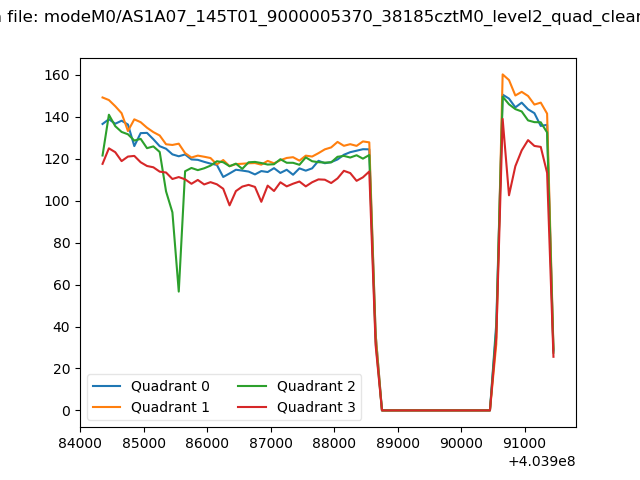 |
|
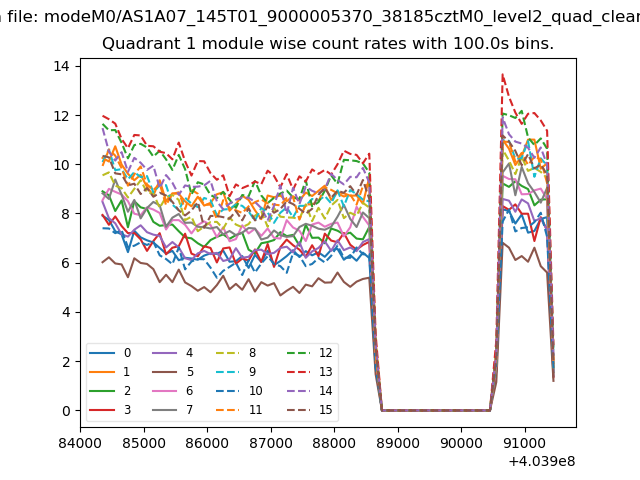
| Module-wise count rates for Quadrant A Data is divided into 100 sec bins |
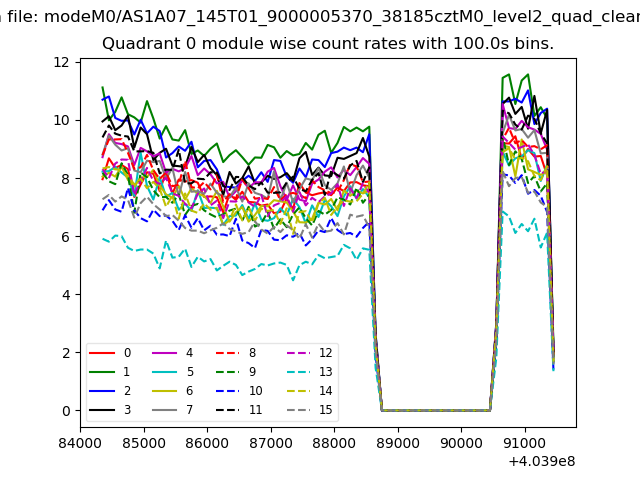 |
 |
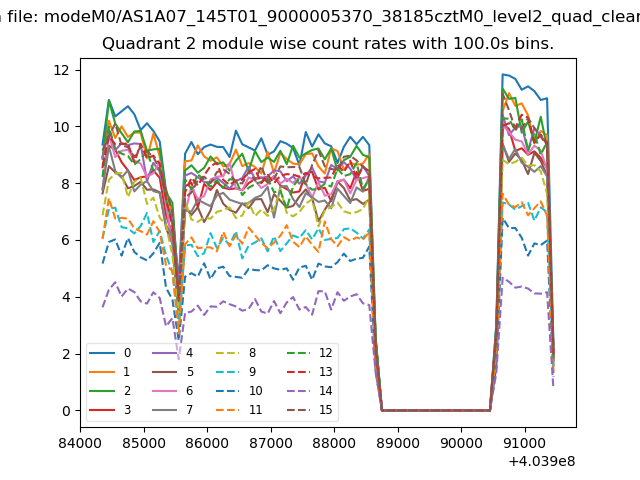
| Module-wise count rates for Quadrant B Data is divided into 100 sec bins |
 |
 |
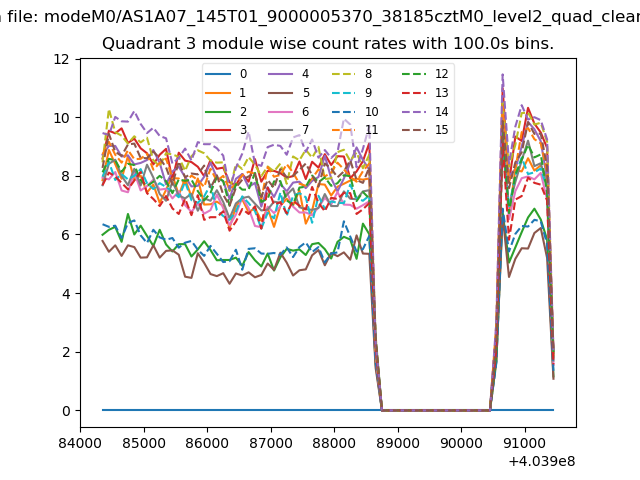
| Module-wise count rates for Quadrant C Data is divided into 100 sec bins |
 |
 |
| Module-wise count rates for Quadrant D Data is divided into 100 sec bins |
 |
 |
| Parameter | Plot |
|---|---|
| CZT HV Monitor | 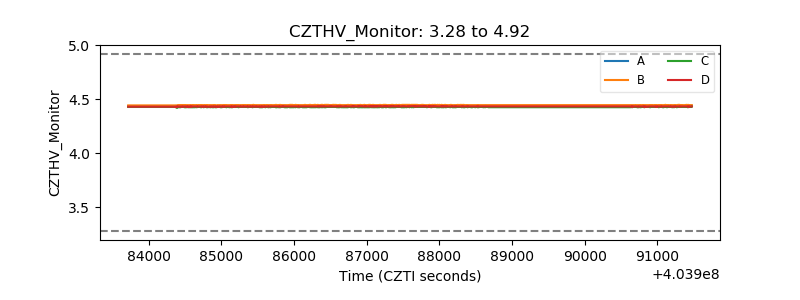 |
| D_VDD | 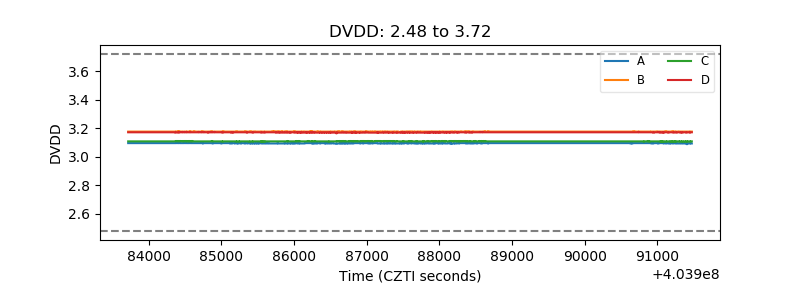 |
| Temperature 1 | 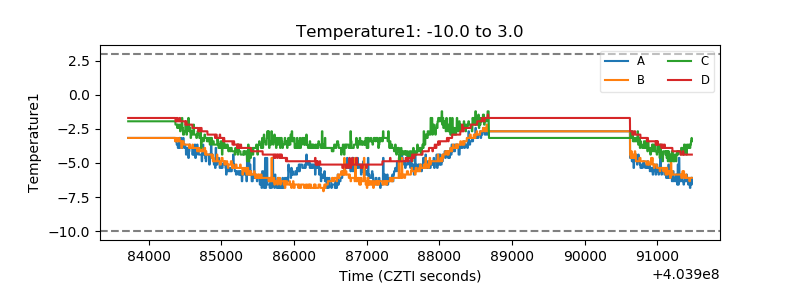 |
| Veto HV Monitor |  |
| Veto LLD | 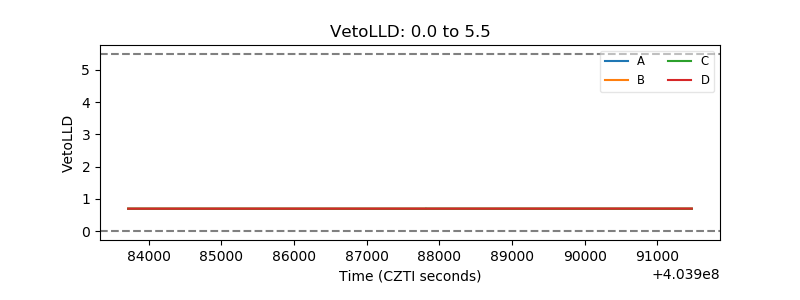 |
| Alpha Counter | 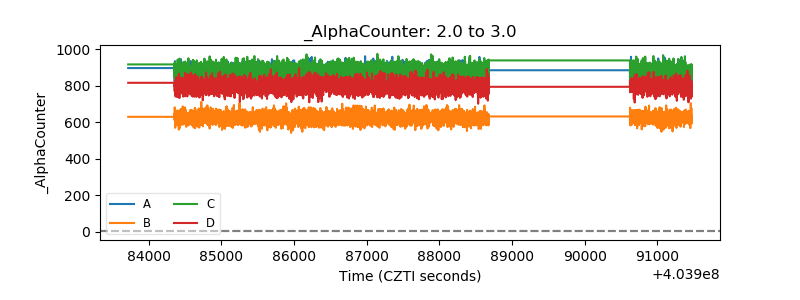 |
| _CPM_Rate | 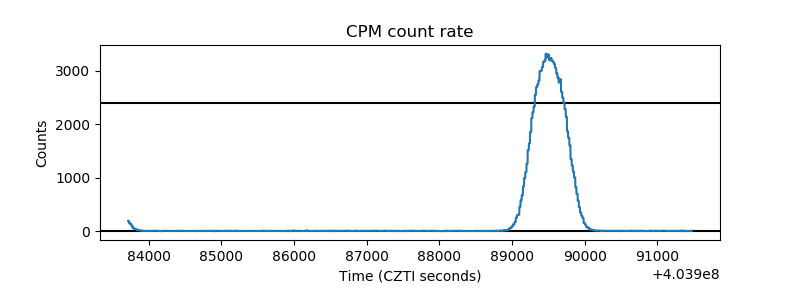 |
| CZT Counter | 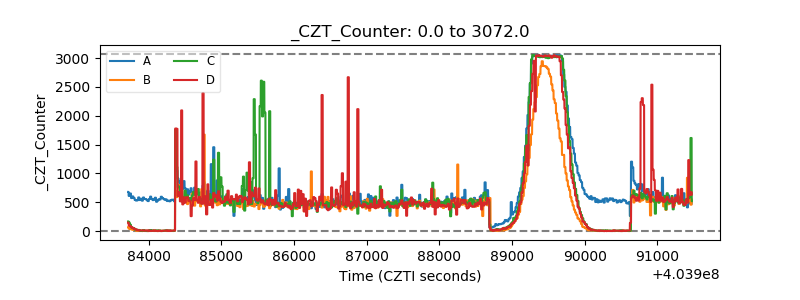 |
| +2.5 Volts monitor | 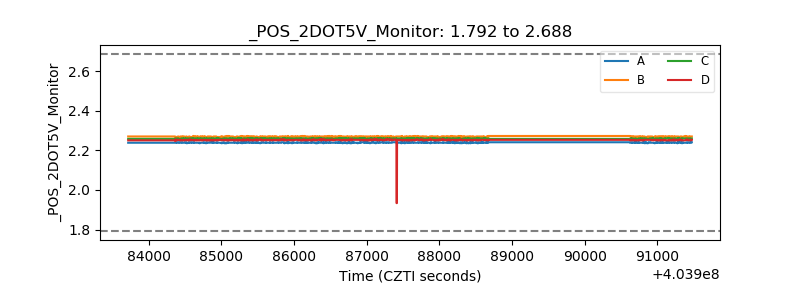 |
| +5 Volts monitor | 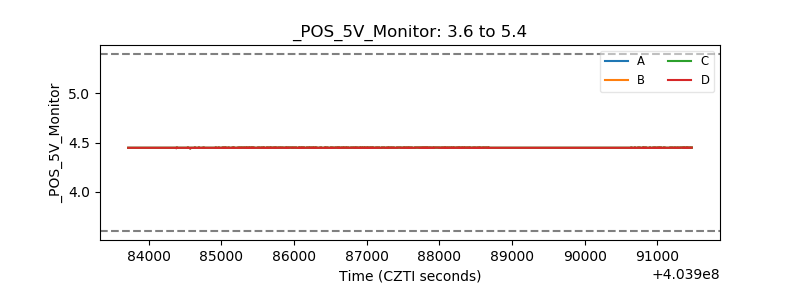 |
| _ROLL_ROT | 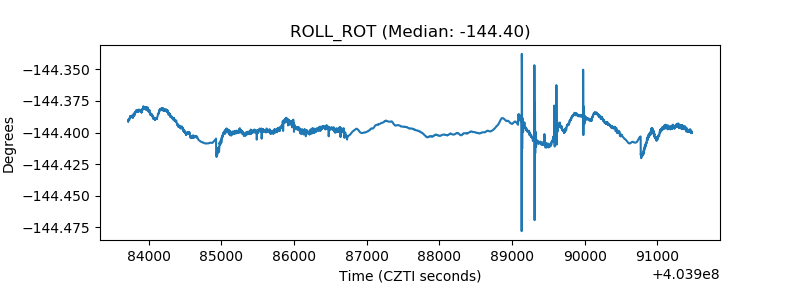 |
| _Roll_DEC | 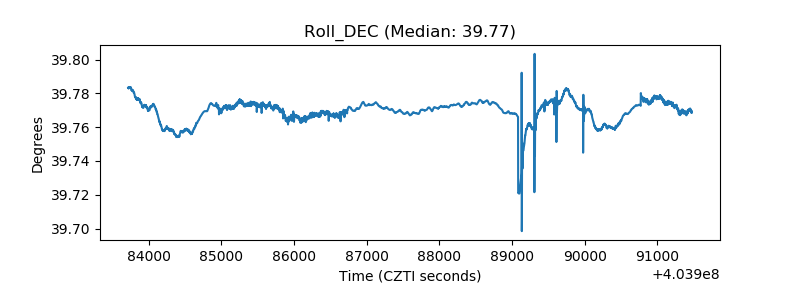 |
| _Roll_RA | 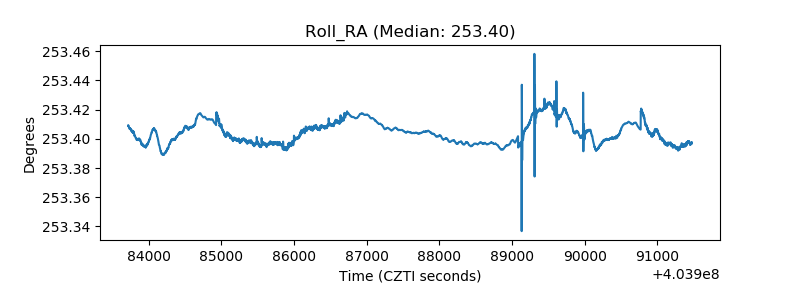 |
| Veto Counter | 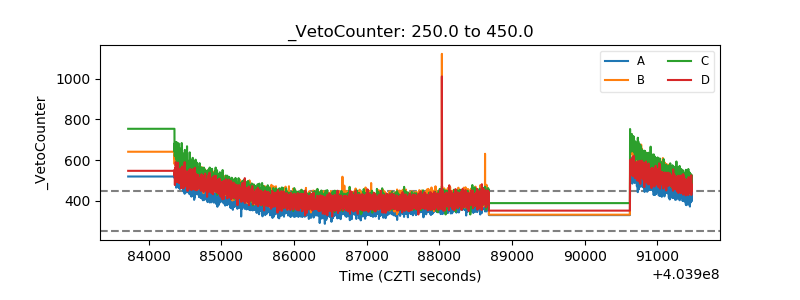 |