| Param | Original file | Final file |
|---|---|---|
| Filename | modeM0/AS1A07_145T01_9000005370_38186cztM0_level2.fits | modeM0/AS1A07_145T01_9000005370_38186cztM0_level2_quad_clean.evt |
| Size (bytes) | 334,405,440 | 100,488,960 |
| Size | 318.9 MB | 95.8 MB |
| Events in quadrant A | 2,961,520 | 682,106 |
| Events in quadrant B | 2,901,759 | 701,132 |
| Events in quadrant C | 2,920,553 | 678,942 |
| Events in quadrant D | 3,186,241 | 613,890 |
| Mode M9 | |||
|---|---|---|---|
| Quadrant | BADHDUFLAG | Total packets | Discarded packets |
| A | 0 | 27 | 0 |
| B | 0 | 27 | 0 |
| C | 0 | 27 | 0 |
| D | 0 | 28 | 0 |
| Mode SS | |||
|---|---|---|---|
| Quadrant | BADHDUFLAG | Total packets | Discarded packets |
| A | 0 | 106 | 0 |
| B | 0 | 106 | 0 |
| C | 0 | 106 | 0 |
| D | 0 | 106 | 0 |
| Mode M0 | |||
|---|---|---|---|
| Quadrant | BADHDUFLAG | Total packets | Discarded packets |
| A | 0 | 11964 | 3 |
| B | 0 | 11781 | 2 |
| C | 0 | 11640 | 2 |
| D | 0 | 12868 | 2 |
| Quadrant | Total seconds | Saturated seconds | Saturation percentage |
|---|---|---|---|
| A | 5246 | 8 | 0.152497% |
| B | 5246 | 112 | 2.134960% |
| C | 5246 | 36 | 0.686237% |
| D | 5246 | 108 | 2.058711% |
Noise dominated data is calculated using 1-second bins in cleaned event files. If a bin has >2000 counts, and if more than 50% of those come from <1% of pixels, then it is considered to be noise-dominated and hence unusable.
| Quadrant | # 1 sec bins | Bins with >0 counts | Bins with >2000 counts | High rate bins dominated by noise | Noise dominated (total time) | Noise dominated (detector-on time) | Marked lightcurve |
|---|---|---|---|---|---|---|---|
| A | 7279 | 5247 | 6 | 6 | 0.08% | 0.11% | 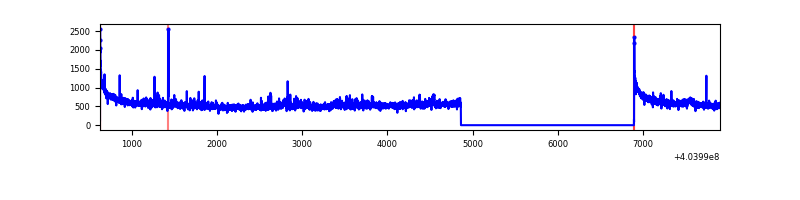 |
| B | 7279 | 5247 | 93 | 93 | 1.28% | 1.77% | 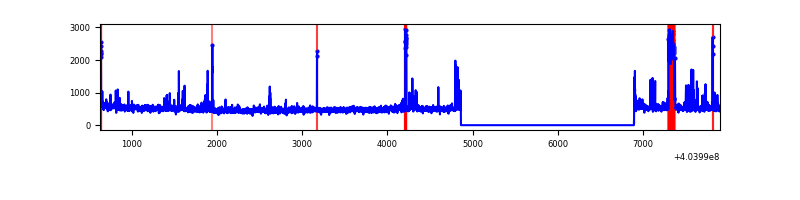 |
| C | 7279 | 5247 | 34 | 34 | 0.47% | 0.65% | 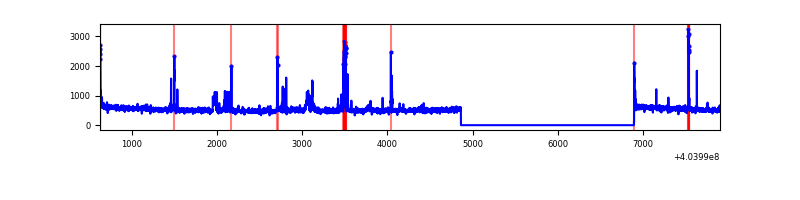 |
| D | 7279 | 5247 | 103 | 103 | 1.42% | 1.96% | 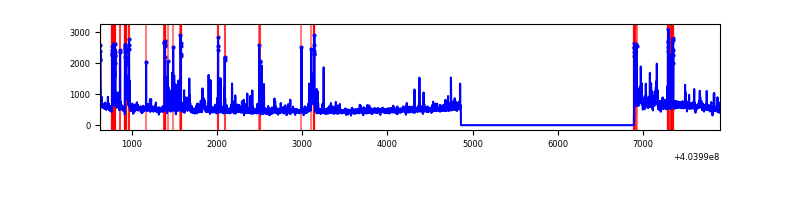 |
Top three noisy pixels from each quadrant. If the there are fewer than three noisy pixels in the level2.evt file, extra rows are filled as -1
| Pixel properties | Quadrant properties | ||||||
|---|---|---|---|---|---|---|---|
| Quadrant | DetID | PixID | Counts | Sigma | Mean | Median | Sigma |
| A | 10 | 83 | 360090 | 2825.7 | 633 | 623 | 127.2 |
| A | 12 | 189 | 128074 | 1001.87 | 633 | 623 | 127.2 |
| A | 9 | 143 | 18000 | 136.6 | 633 | 623 | 127.2 |
| B | 4 | 141 | 160792 | 1339.75 | 633 | 617 | 119.6 |
| B | 4 | 171 | 97713 | 812.14 | 633 | 617 | 119.6 |
| B | 5 | 172 | 87004 | 722.57 | 633 | 617 | 119.6 |
| C | 15 | 214 | 219606 | 1509.29 | 627 | 632 | 145.1 |
| C | 14 | 254 | 218030 | 1498.42 | 627 | 632 | 145.1 |
| C | 0 | 10 | 25127 | 168.83 | 627 | 632 | 145.1 |
| D | 13 | 138 | 154464 | 1035.48 | 619 | 603 | 148.6 |
| D | 12 | 235 | 107382 | 718.62 | 619 | 603 | 148.6 |
| D | 2 | 16 | 90020 | 601.77 | 619 | 603 | 148.6 |
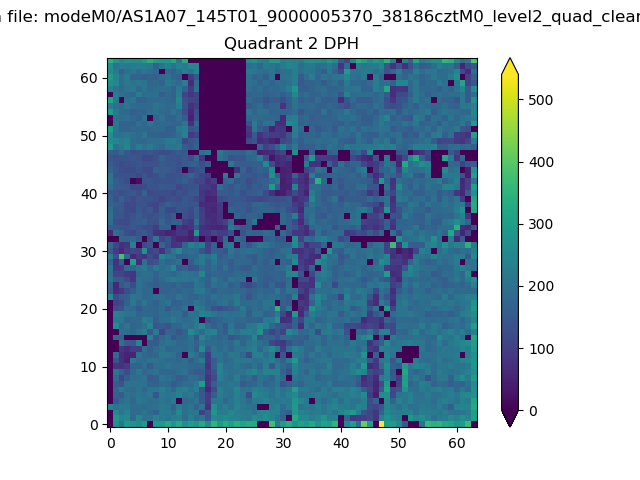
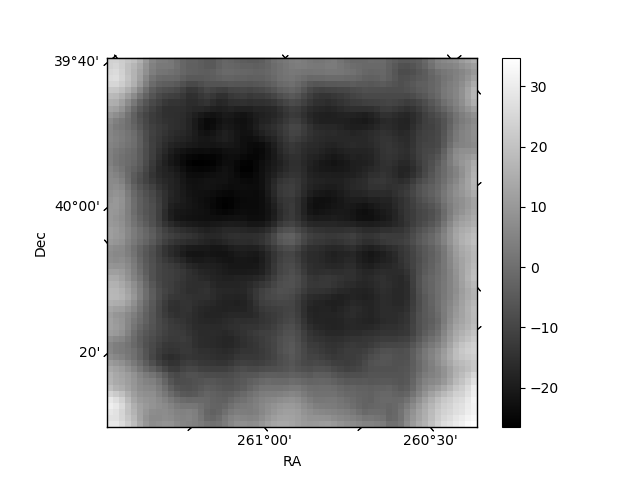
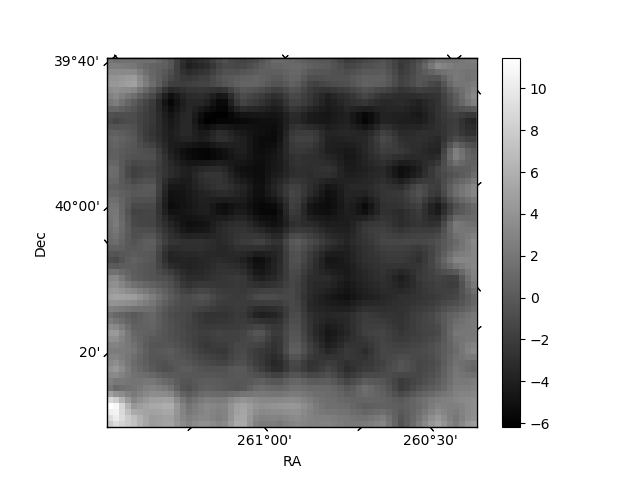
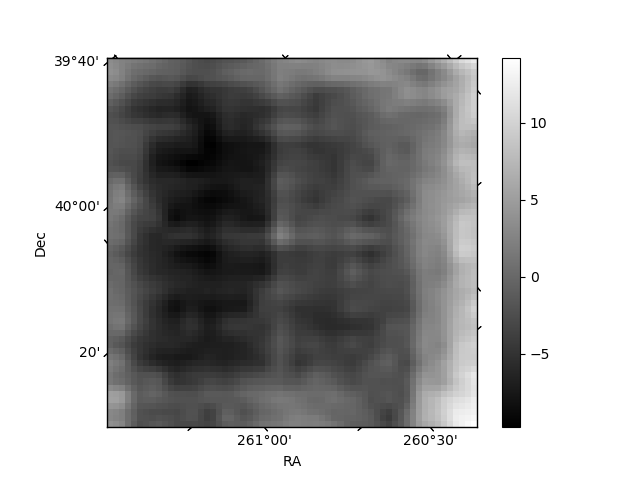
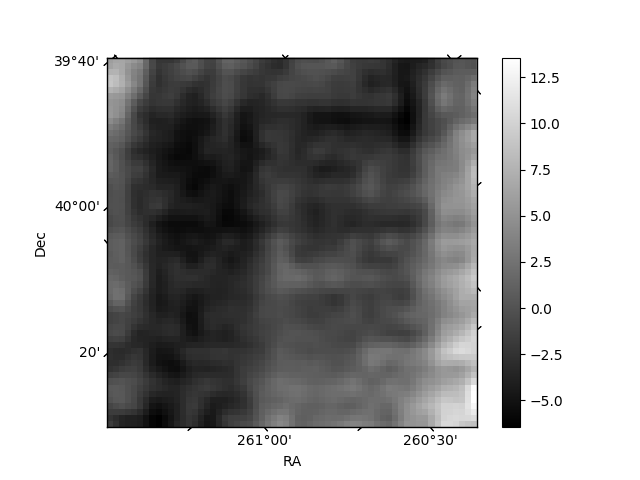
Histogram calculated using DETX and DETY for each event in the final _common_clean file
| Quadrant A | 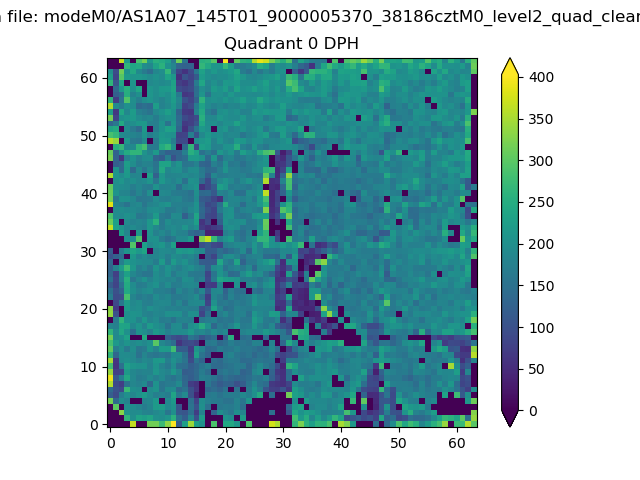 |
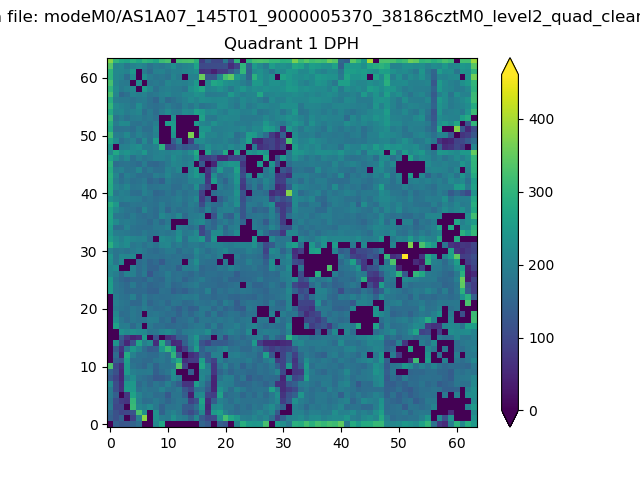 |
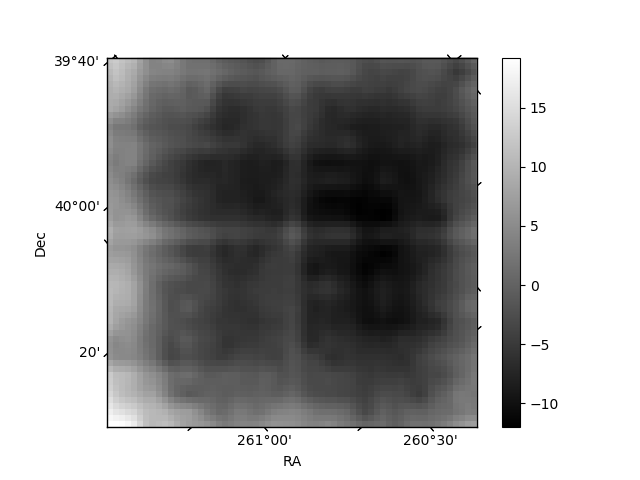
Quadrant B |
|---|---|---|---|
| Quadrant D | 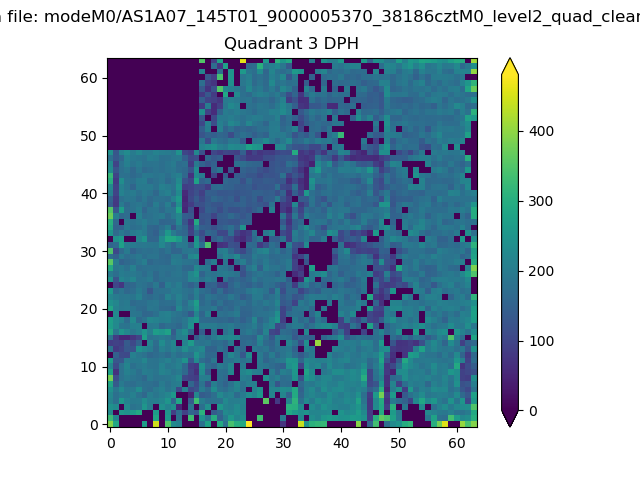 |
 |
Quadrant C |
| Plot type | Count rate plots | Images |
|---|---|---|
| Comparison with Poisson distribution Blue bars denote a histogram of data divided into 1 sec bins. Red curve is a Poisson curve with rate = median count rate of data. |
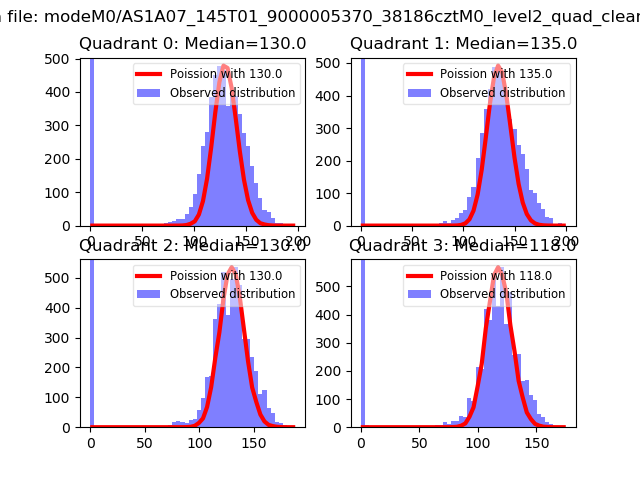 |
 |
| Quadrant-wise count rates Data is divided into 100 sec bins |
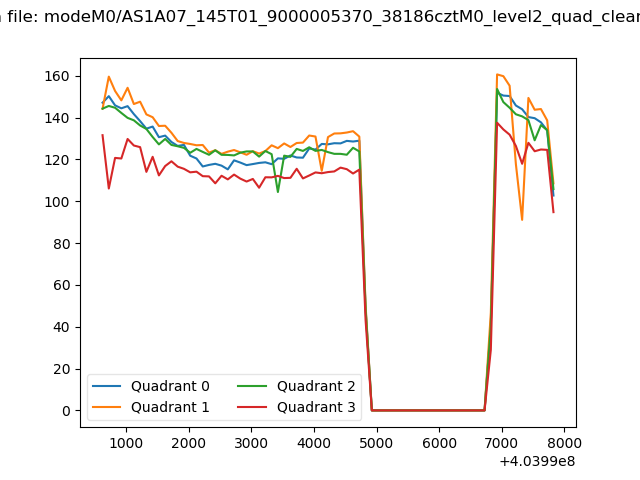 |
|
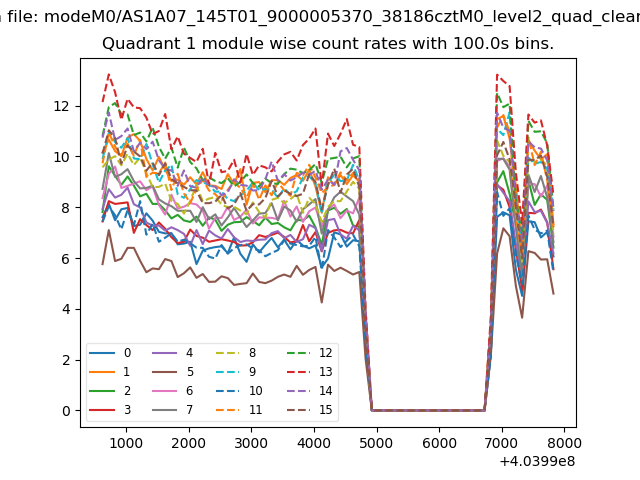
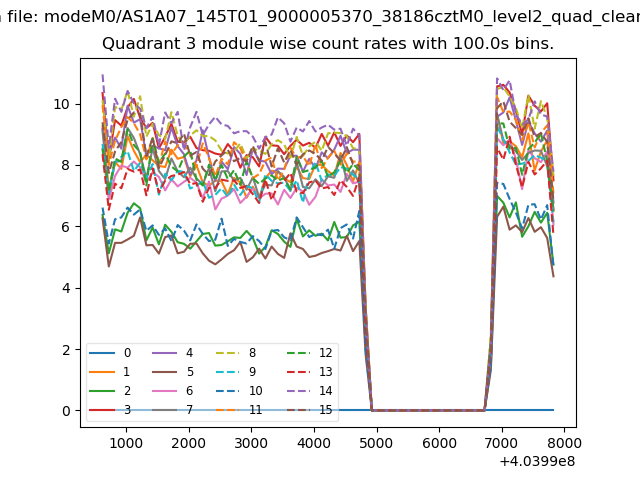
| Module-wise count rates for Quadrant A Data is divided into 100 sec bins |
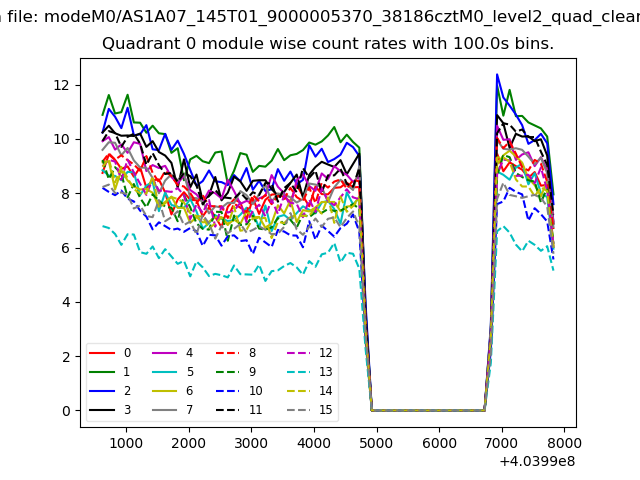 |
 |
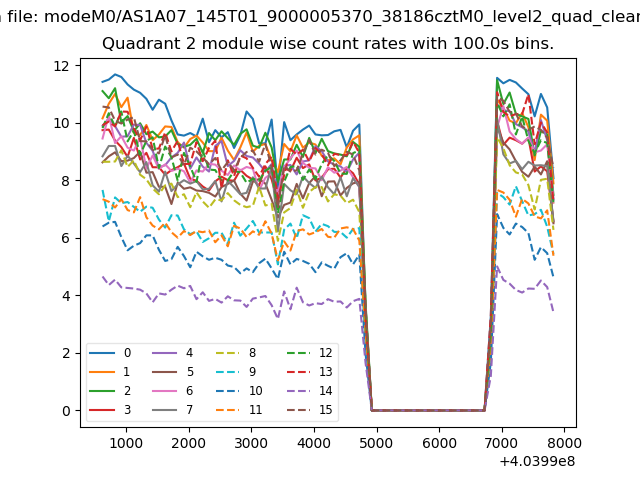
| Module-wise count rates for Quadrant B Data is divided into 100 sec bins |
 |
 |
| Module-wise count rates for Quadrant C Data is divided into 100 sec bins |
 |
 |
| Module-wise count rates for Quadrant D Data is divided into 100 sec bins |
 |
 |
| Parameter | Plot |
|---|---|
| CZT HV Monitor | 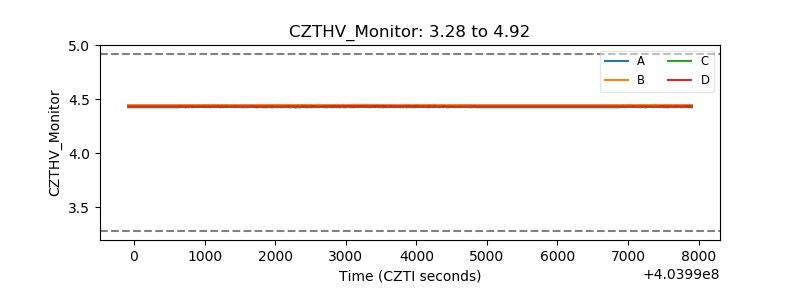 |
| D_VDD | 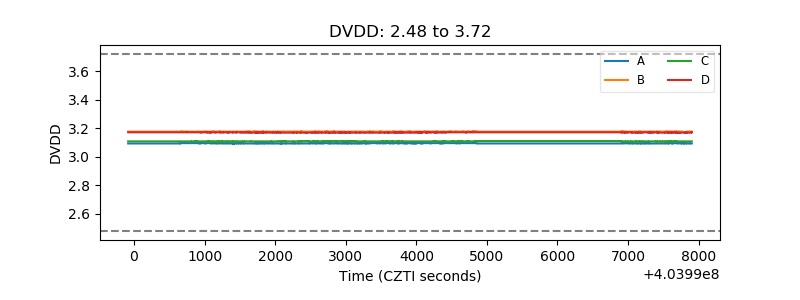 |
| Temperature 1 | 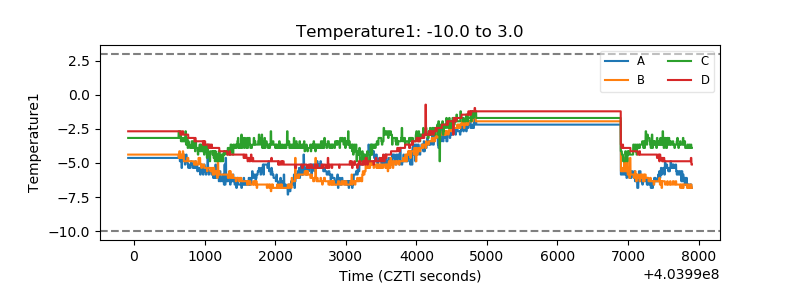 |
| Veto HV Monitor | 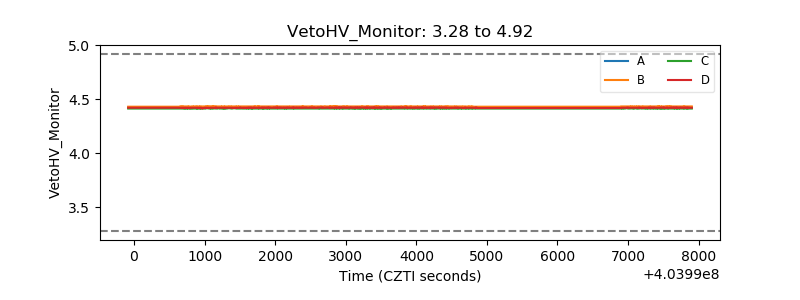 |
| Veto LLD | 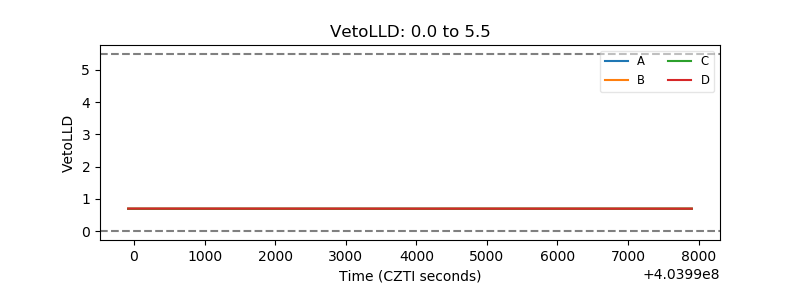 |
| Alpha Counter | 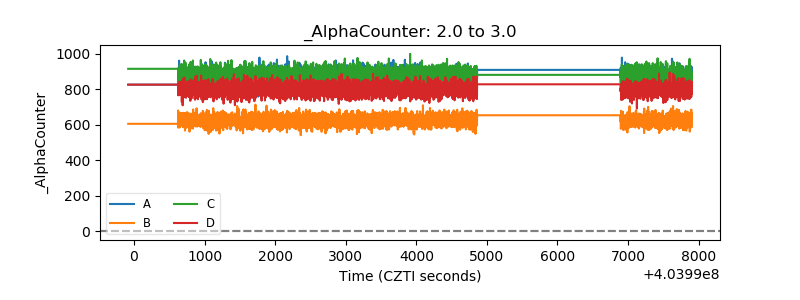 |
| _CPM_Rate | 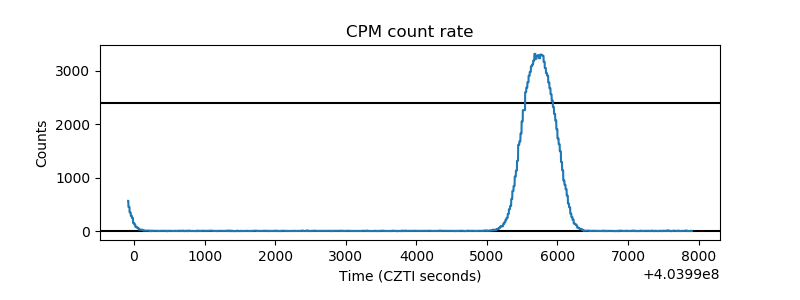 |
| CZT Counter | 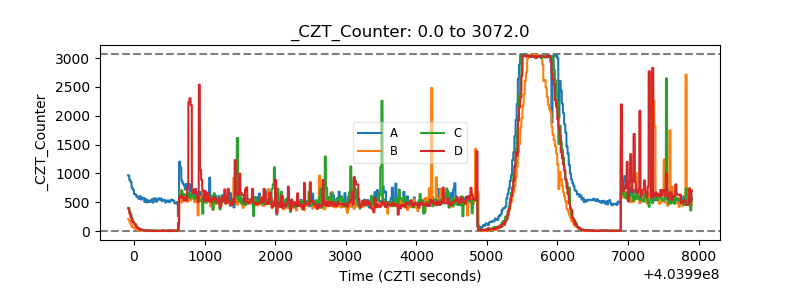 |
| +2.5 Volts monitor | 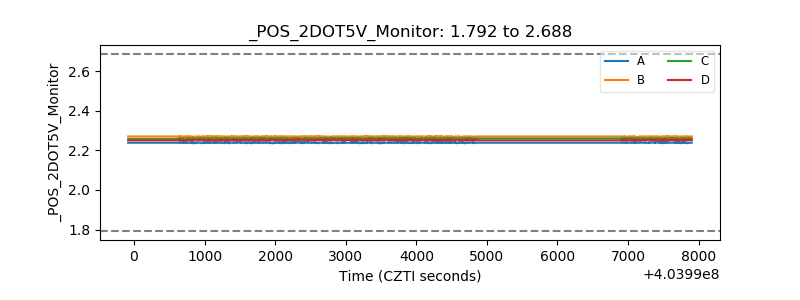 |
| +5 Volts monitor | 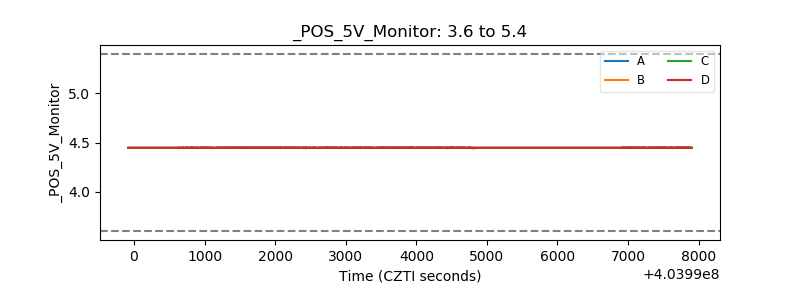 |
| _ROLL_ROT | 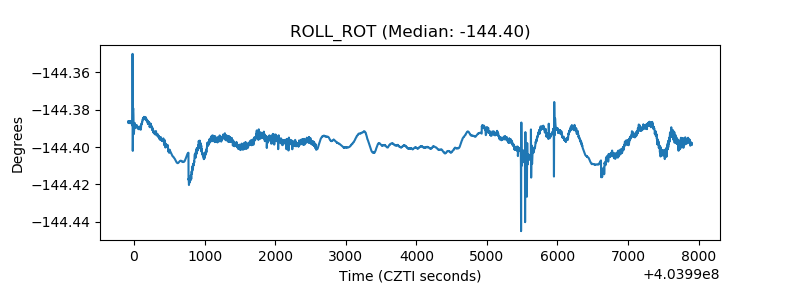 |
| _Roll_DEC | 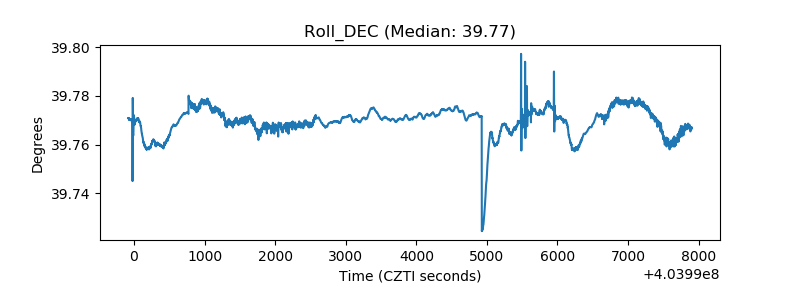 |
| _Roll_RA | 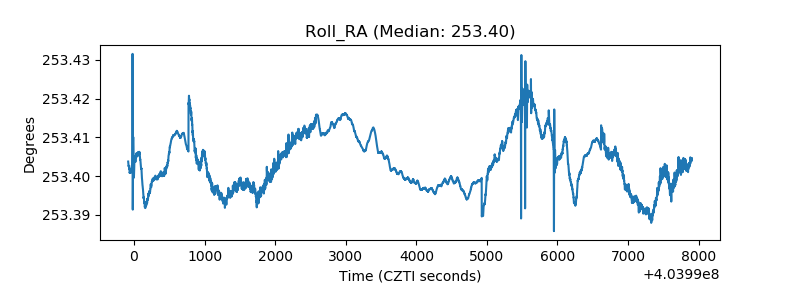 |
| Veto Counter | 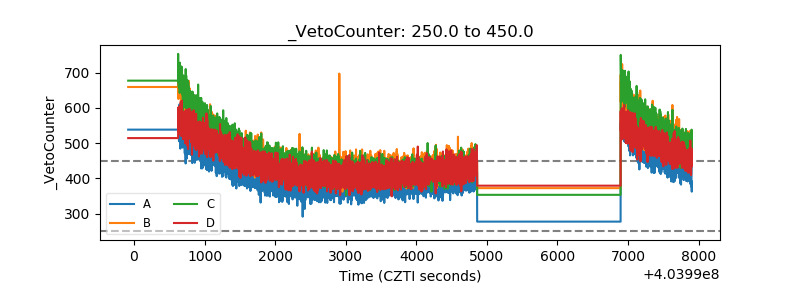 |