| Param | Original file | Final file |
|---|---|---|
| Filename | modeM0/AS1A07_145T01_9000005370_38187cztM0_level2.fits | modeM0/AS1A07_145T01_9000005370_38187cztM0_level2_quad_clean.evt |
| Size (bytes) | 339,431,040 | 97,992,000 |
| Size | 323.7 MB | 93.5 MB |
| Events in quadrant A | 2,867,546 | 671,558 |
| Events in quadrant B | 3,009,073 | 681,925 |
| Events in quadrant C | 2,711,514 | 669,022 |
| Events in quadrant D | 3,575,603 | 584,409 |
| Mode M9 | |||
|---|---|---|---|
| Quadrant | BADHDUFLAG | Total packets | Discarded packets |
| A | 0 | 28 | 0 |
| B | 0 | 28 | 0 |
| C | 0 | 28 | 0 |
| D | 0 | 29 | 0 |
| Mode SS | |||
|---|---|---|---|
| Quadrant | BADHDUFLAG | Total packets | Discarded packets |
| A | 0 | 106 | 0 |
| B | 0 | 106 | 0 |
| C | 0 | 106 | 0 |
| D | 0 | 106 | 0 |
| Mode M0 | |||
|---|---|---|---|
| Quadrant | BADHDUFLAG | Total packets | Discarded packets |
| A | 0 | 11565 | 3 |
| B | 0 | 12045 | 2 |
| C | 0 | 10894 | 2 |
| D | 0 | 14050 | 2 |
| Quadrant | Total seconds | Saturated seconds | Saturation percentage |
|---|---|---|---|
| A | 5145 | 14 | 0.272109% |
| B | 5145 | 176 | 3.420797% |
| C | 5145 | 14 | 0.272109% |
| D | 5145 | 264 | 5.131195% |
Noise dominated data is calculated using 1-second bins in cleaned event files. If a bin has >2000 counts, and if more than 50% of those come from <1% of pixels, then it is considered to be noise-dominated and hence unusable.
| Quadrant | # 1 sec bins | Bins with >0 counts | Bins with >2000 counts | High rate bins dominated by noise | Noise dominated (total time) | Noise dominated (detector-on time) | Marked lightcurve |
|---|---|---|---|---|---|---|---|
| A | 7268 | 5146 | 6 | 6 | 0.08% | 0.12% | 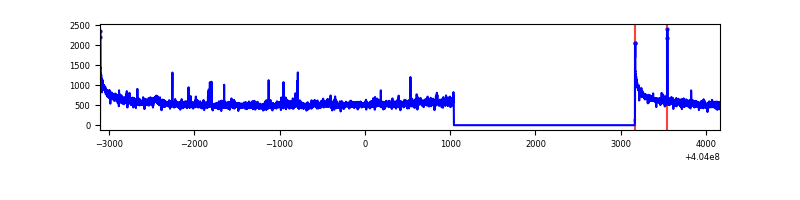 |
| B | 7268 | 5146 | 134 | 134 | 1.84% | 2.60% | 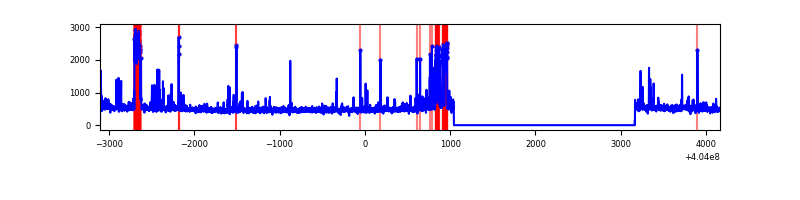 |
| C | 7268 | 5146 | 12 | 12 | 0.17% | 0.23% | 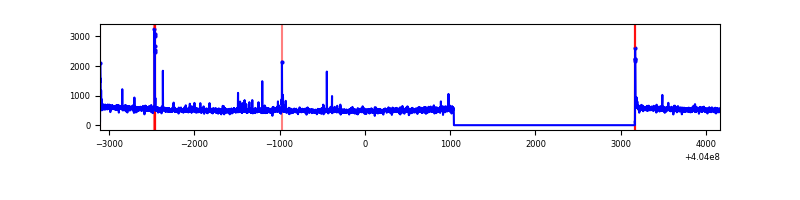 |
| D | 7268 | 5146 | 261 | 261 | 3.59% | 5.07% | 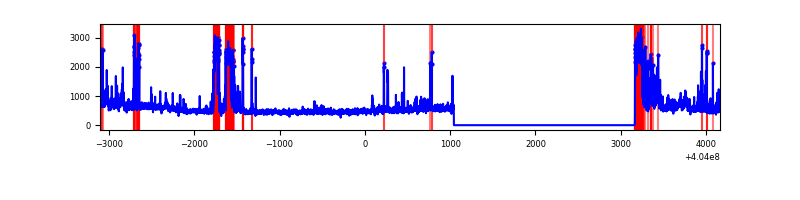 |
Top three noisy pixels from each quadrant. If the there are fewer than three noisy pixels in the level2.evt file, extra rows are filled as -1
| Pixel properties | Quadrant properties | ||||||
|---|---|---|---|---|---|---|---|
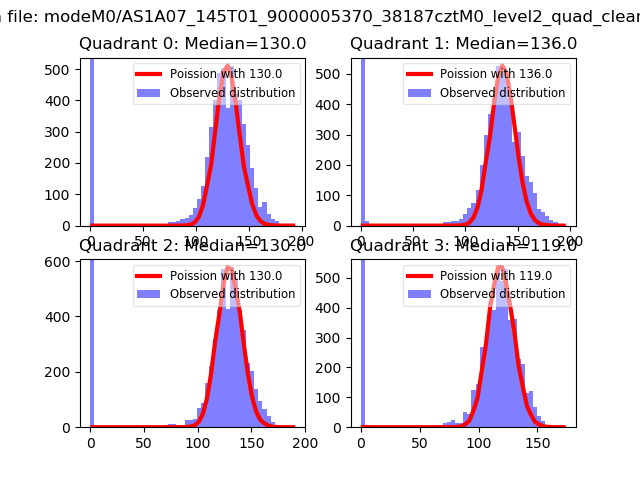
| Quadrant | DetID | PixID | Counts | Sigma | Mean | Median | Sigma |
| A | 10 | 83 | 356498 | 2846.07 | 624 | 612 | 125.0 |
| A | 12 | 189 | 66843 | 529.66 | 624 | 612 | 125.0 |
| A | 9 | 143 | 20498 | 159.03 | 624 | 612 | 125.0 |
| B | 4 | 171 | 293038 | 2484.24 | 620 | 605 | 117.7 |
| B | 4 | 141 | 162523 | 1375.51 | 620 | 605 | 117.7 |
| B | 5 | 172 | 53010 | 445.18 | 620 | 605 | 117.7 |
| C | 15 | 214 | 214612 | 1503.07 | 616 | 622 | 142.4 |
| C | 14 | 254 | 50086 | 347.43 | 616 | 622 | 142.4 |
| C | 0 | 10 | 22771 | 155.57 | 616 | 622 | 142.4 |
| D | 7 | 38 | 373583 | 2607.91 | 592 | 578 | 143.0 |
| D | 12 | 227 | 304654 | 2125.98 | 592 | 578 | 143.0 |
| D | 2 | 16 | 206845 | 1442.14 | 592 | 578 | 143.0 |
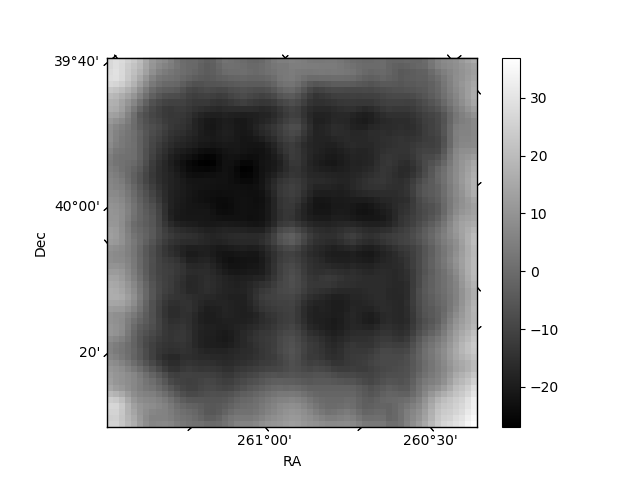
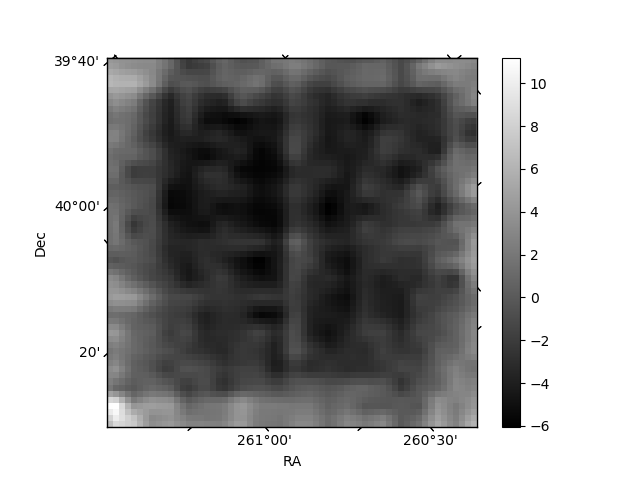
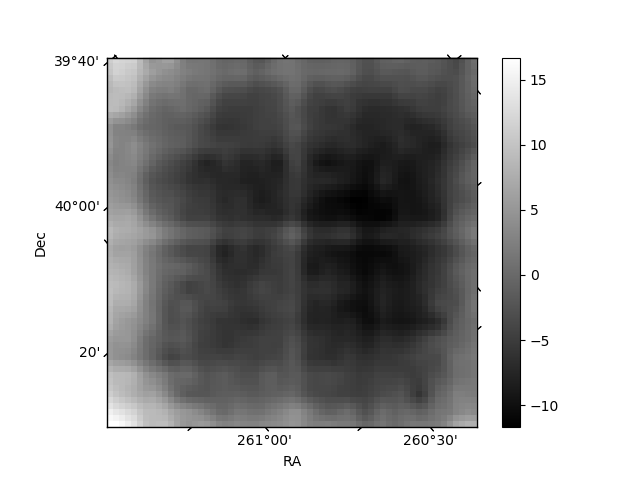
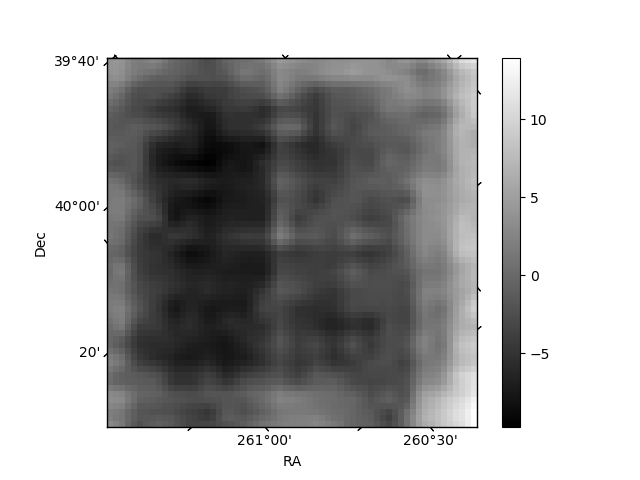
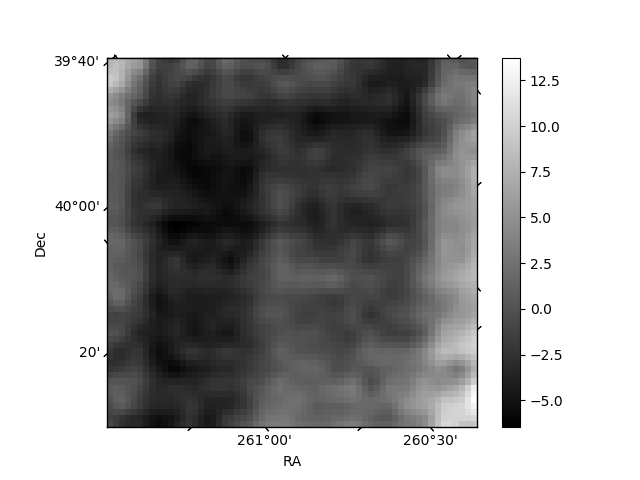
Histogram calculated using DETX and DETY for each event in the final _common_clean file
| Quadrant A | 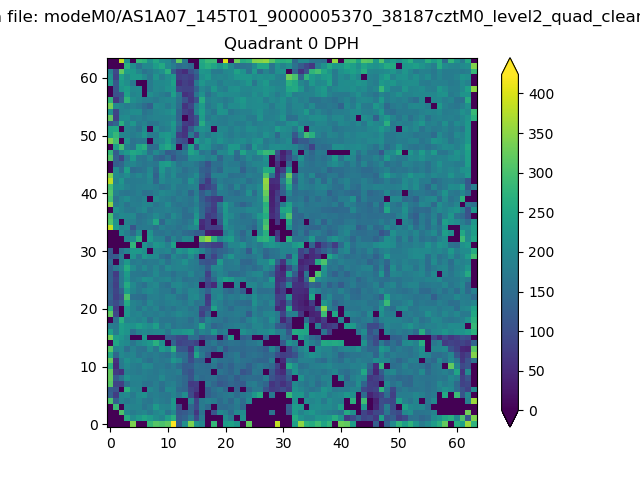 |
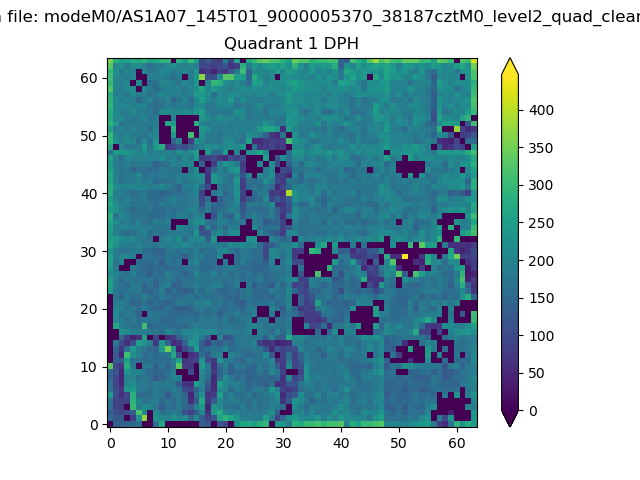 |
Quadrant B |
|---|---|---|---|
| Quadrant D | 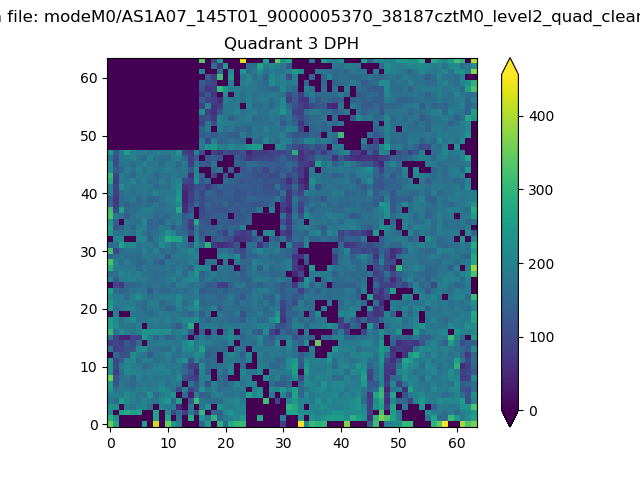 |
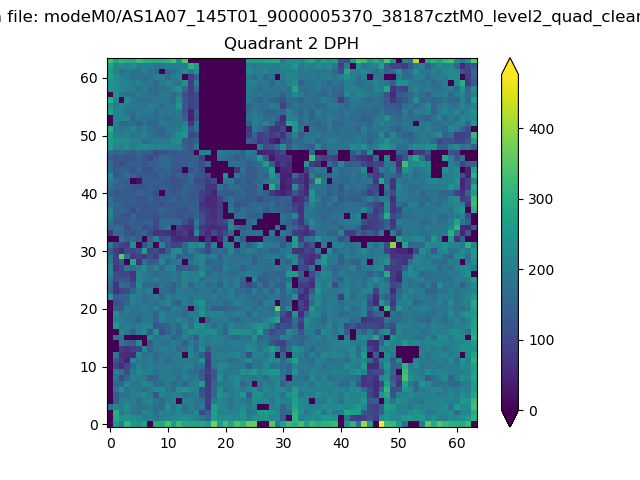 |
Quadrant C |
| Plot type | Count rate plots | Images |
|---|---|---|
| Comparison with Poisson distribution Blue bars denote a histogram of data divided into 1 sec bins. Red curve is a Poisson curve with rate = median count rate of data. |
 |
 |
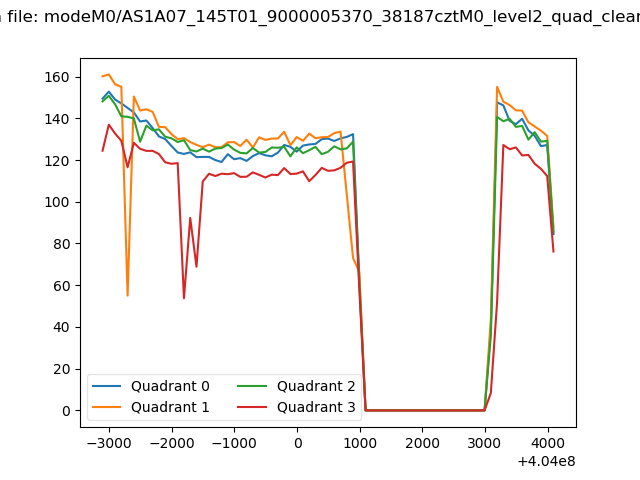
| Quadrant-wise count rates Data is divided into 100 sec bins |
 |
|
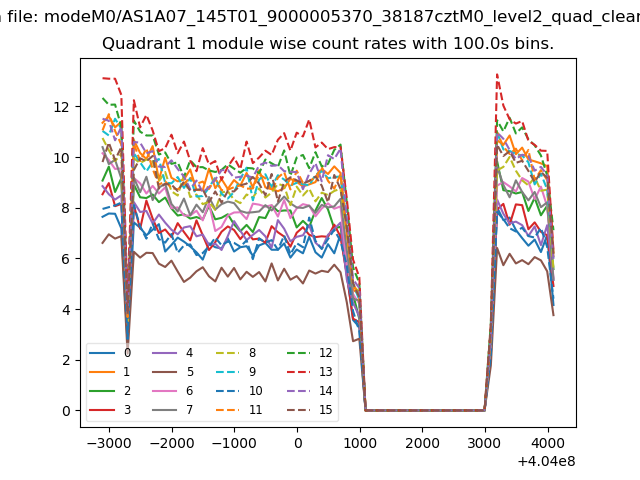
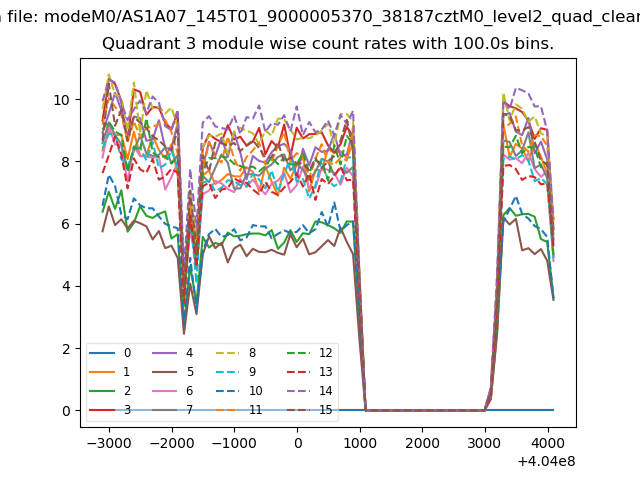
| Module-wise count rates for Quadrant A Data is divided into 100 sec bins |
 |
 |
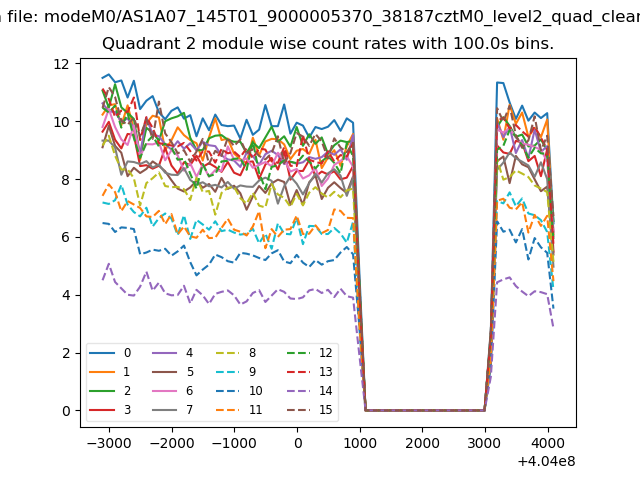
| Module-wise count rates for Quadrant B Data is divided into 100 sec bins |
 |
 |
| Module-wise count rates for Quadrant C Data is divided into 100 sec bins |
 |
 |
| Module-wise count rates for Quadrant D Data is divided into 100 sec bins |
 |
 |
| Parameter | Plot |
|---|---|
| CZT HV Monitor | 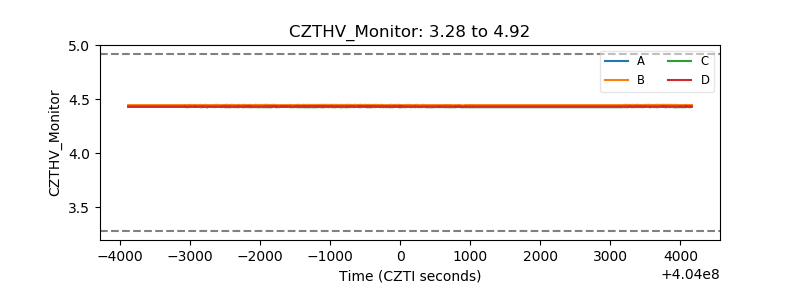 |
| D_VDD | 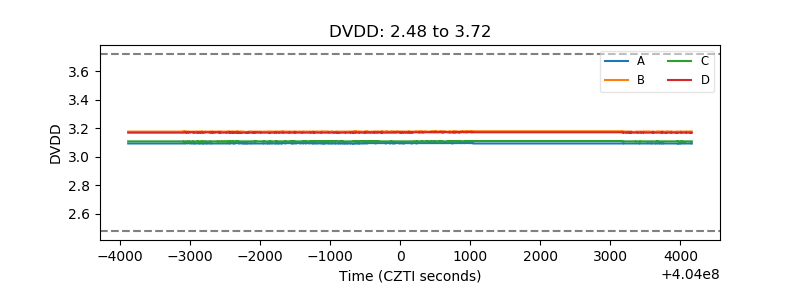 |
| Temperature 1 | 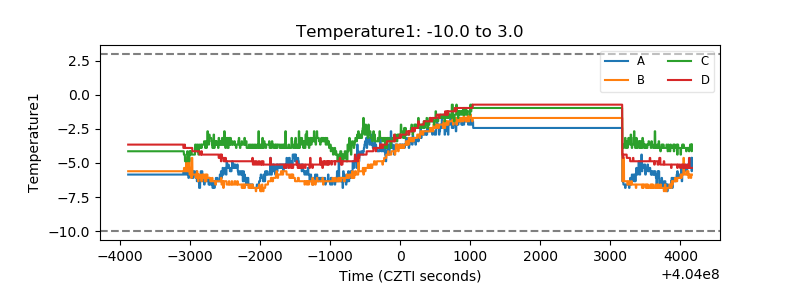 |
| Veto HV Monitor | 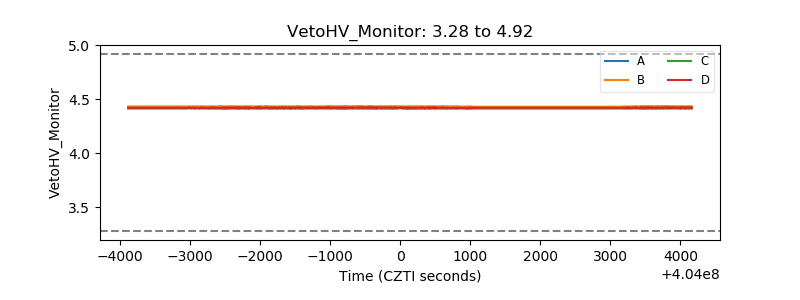 |
| Veto LLD | 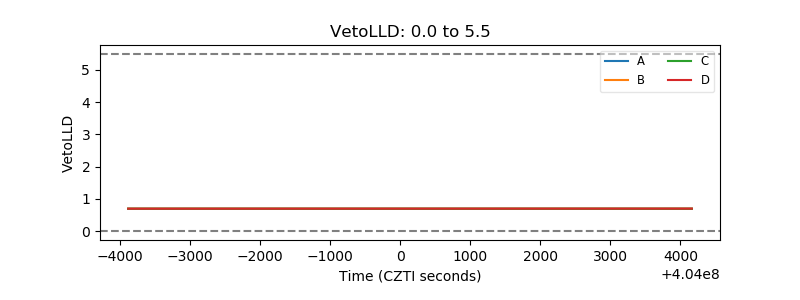 |
| Alpha Counter | 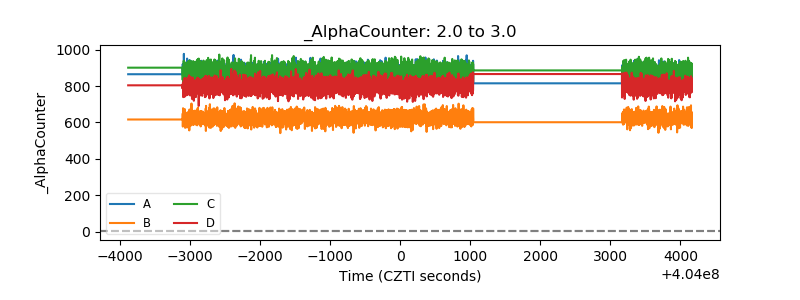 |
| _CPM_Rate | 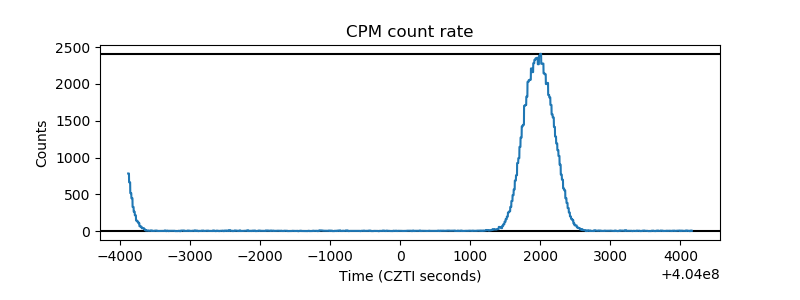 |
| CZT Counter | 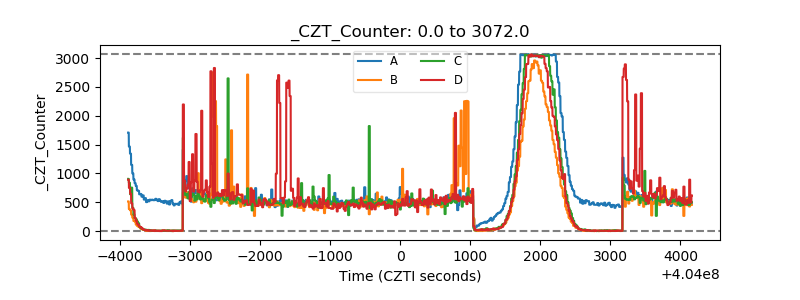 |
| +2.5 Volts monitor | 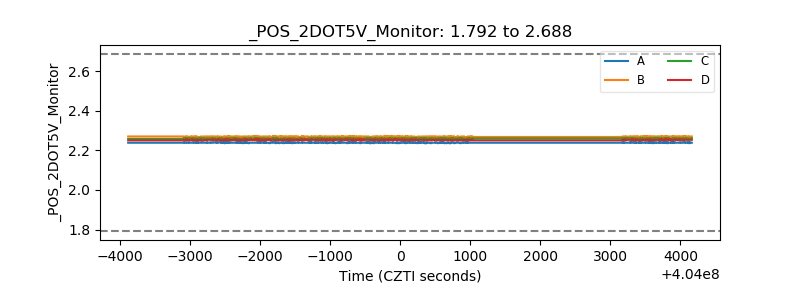 |
| +5 Volts monitor |  |
| _ROLL_ROT | 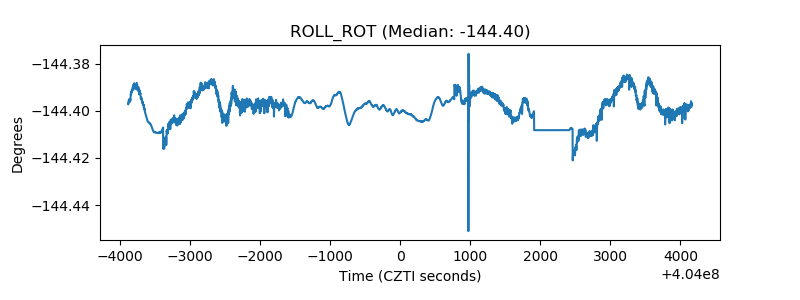 |
| _Roll_DEC | 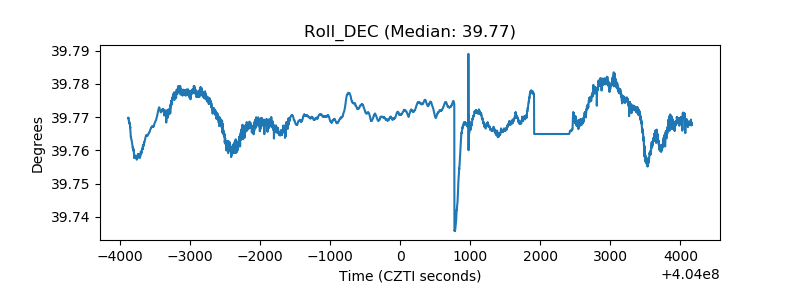 |
| _Roll_RA | 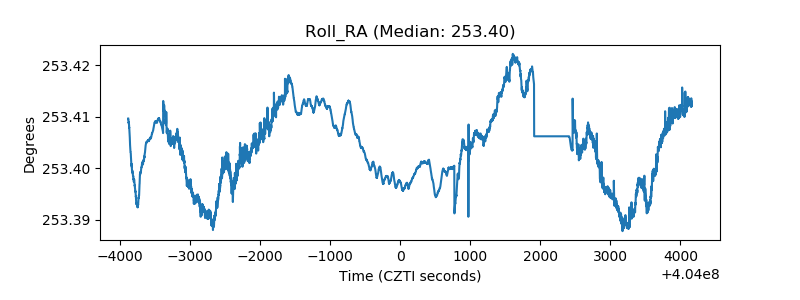 |
| Veto Counter | 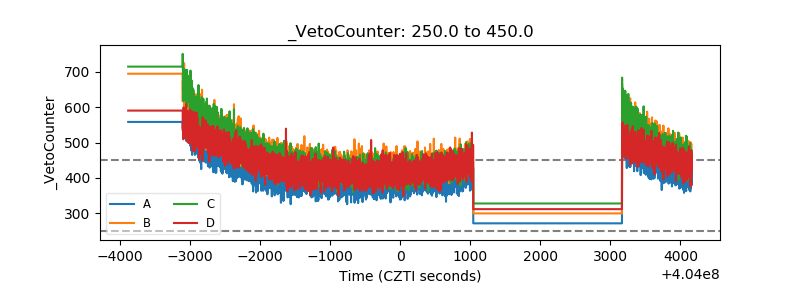 |