| Param | Original file | Final file |
|---|---|---|
| Filename | modeM0/AS1A07_145T01_9000005370_38188cztM0_level2.fits | modeM0/AS1A07_145T01_9000005370_38188cztM0_level2_quad_clean.evt |
| Size (bytes) | 346,092,480 | 93,905,280 |
| Size | 330.1 MB | 89.6 MB |
| Events in quadrant A | 2,905,197 | 639,030 |
| Events in quadrant B | 2,751,622 | 655,489 |
| Events in quadrant C | 2,558,276 | 633,722 |
| Events in quadrant D | 4,203,724 | 562,145 |
| Mode M9 | |||
|---|---|---|---|
| Quadrant | BADHDUFLAG | Total packets | Discarded packets |
| A | 0 | 29 | 0 |
| B | 0 | 29 | 0 |
| C | 0 | 29 | 0 |
| D | 0 | 30 | 0 |
| Mode SS | |||
|---|---|---|---|
| Quadrant | BADHDUFLAG | Total packets | Discarded packets |
| A | 0 | 102 | 0 |
| B | 0 | 102 | 0 |
| C | 0 | 102 | 0 |
| D | 0 | 102 | 0 |
| Mode M0 | |||
|---|---|---|---|
| Quadrant | BADHDUFLAG | Total packets | Discarded packets |
| A | 0 | 11660 | 3 |
| B | 0 | 11335 | 2 |
| C | 0 | 10440 | 2 |
| D | 0 | 15971 | 2 |
| Quadrant | Total seconds | Saturated seconds | Saturation percentage |
|---|---|---|---|
| A | 5043 | 18 | 0.356930% |
| B | 5043 | 84 | 1.665675% |
| C | 5043 | 11 | 0.218124% |
| D | 5043 | 189 | 3.747769% |
Noise dominated data is calculated using 1-second bins in cleaned event files. If a bin has >2000 counts, and if more than 50% of those come from <1% of pixels, then it is considered to be noise-dominated and hence unusable.
| Quadrant | # 1 sec bins | Bins with >0 counts | Bins with >2000 counts | High rate bins dominated by noise | Noise dominated (total time) | Noise dominated (detector-on time) | Marked lightcurve |
|---|---|---|---|---|---|---|---|
| A | 7165 | 5044 | 18 | 18 | 0.25% | 0.36% | 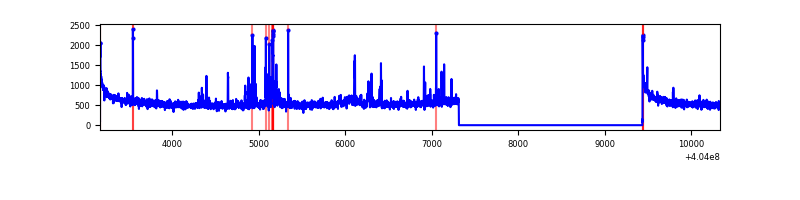 |
| B | 7165 | 5044 | 72 | 72 | 1.00% | 1.43% | 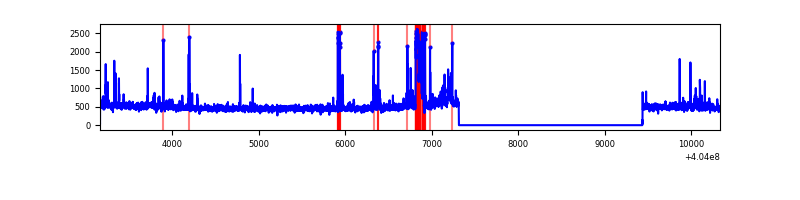 |
| C | 7165 | 5044 | 8 | 8 | 0.11% | 0.16% | 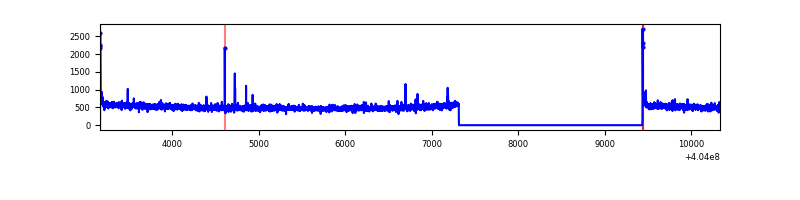 |
| D | 7165 | 5044 | 181 | 181 | 2.53% | 3.59% | 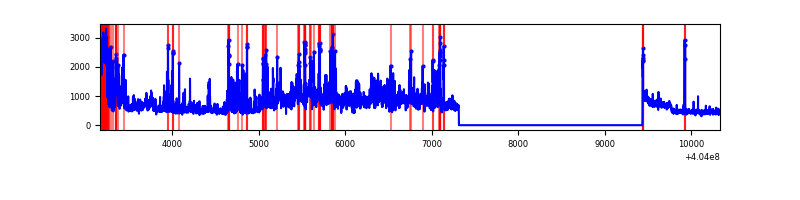 |
Top three noisy pixels from each quadrant. If the there are fewer than three noisy pixels in the level2.evt file, extra rows are filled as -1
| Pixel properties | Quadrant properties | ||||||
|---|---|---|---|---|---|---|---|
| Quadrant | DetID | PixID | Counts | Sigma | Mean | Median | Sigma |
| A | 10 | 83 | 352162 | 2926.31 | 601 | 591 | 120.1 |
| A | 9 | 143 | 178646 | 1482.05 | 601 | 591 | 120.1 |
| A | 12 | 189 | 44263 | 363.5 | 601 | 591 | 120.1 |
| B | 5 | 184 | 153361 | 1341.26 | 601 | 584 | 113.9 |
| B | 4 | 171 | 88678 | 773.4 | 601 | 584 | 113.9 |
| B | 5 | 172 | 59313 | 515.59 | 601 | 584 | 113.9 |
| C | 15 | 214 | 211903 | 1559.38 | 588 | 593 | 135.5 |
| C | 0 | 10 | 26823 | 193.57 | 588 | 593 | 135.5 |
| C | 14 | 254 | 19463 | 139.25 | 588 | 593 | 135.5 |
| D | 2 | 16 | 1012669 | 7284.68 | 572 | 557 | 138.9 |
| D | 13 | 138 | 312793 | 2247.32 | 572 | 557 | 138.9 |
| D | 12 | 227 | 253377 | 1819.67 | 572 | 557 | 138.9 |
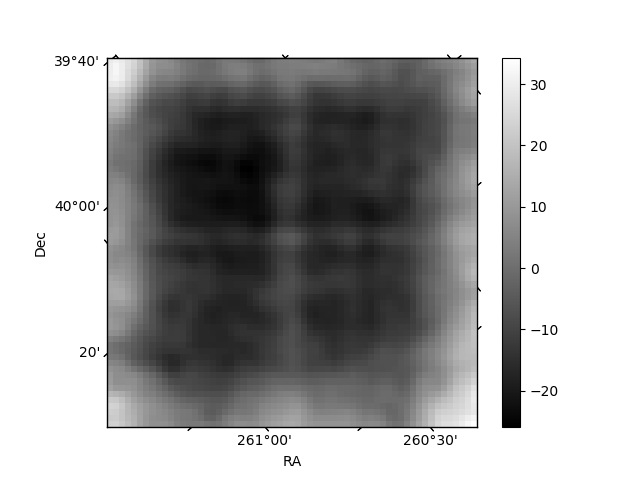
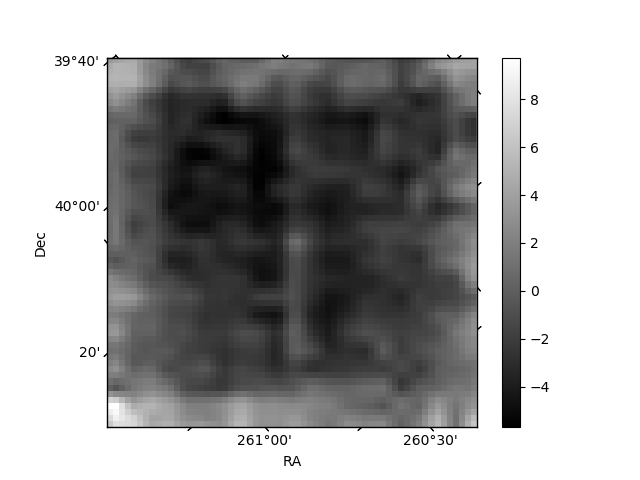
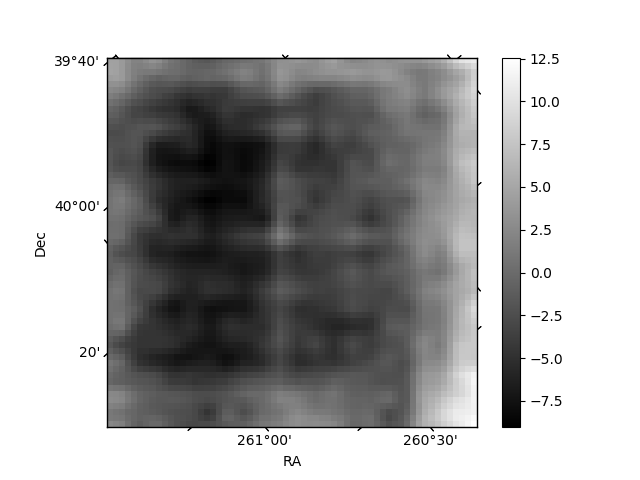
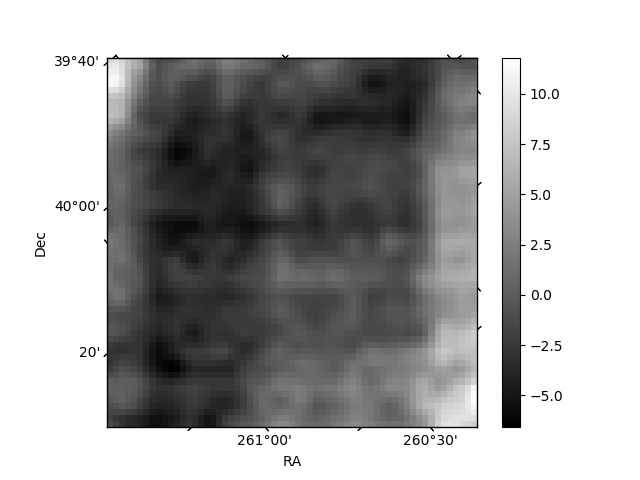
Histogram calculated using DETX and DETY for each event in the final _common_clean file
| Quadrant A | 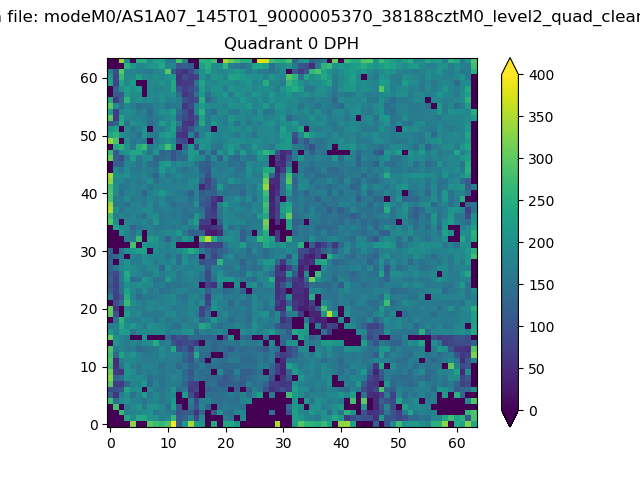 |
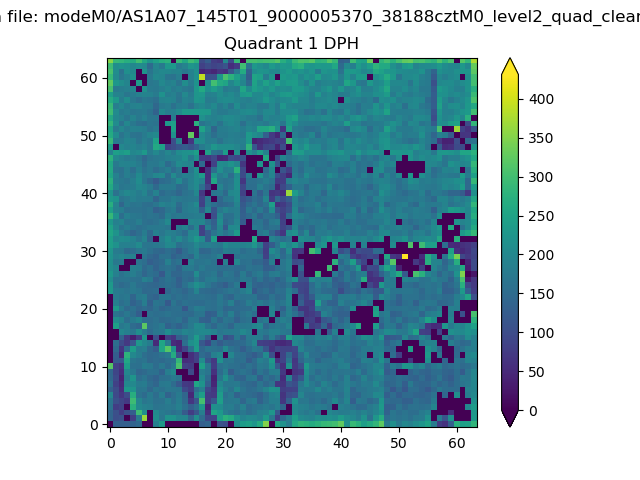 |
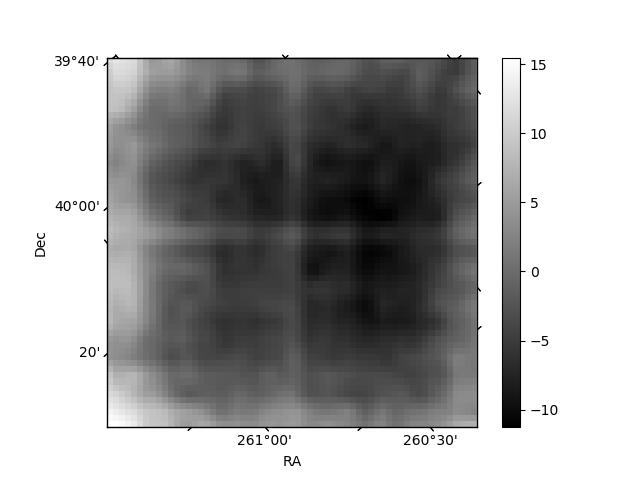
Quadrant B |
|---|---|---|---|
| Quadrant D | 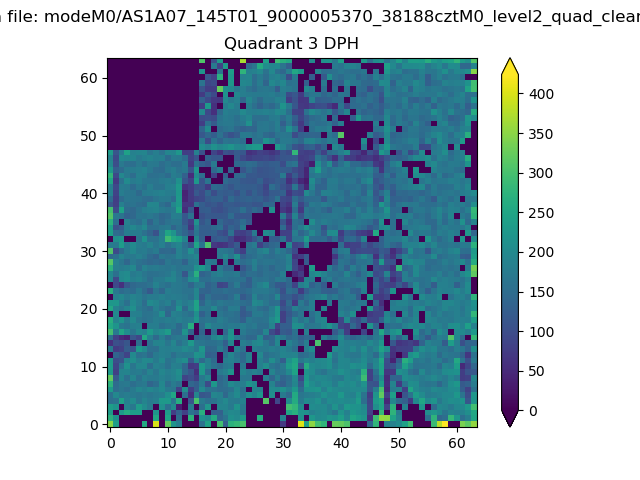 |
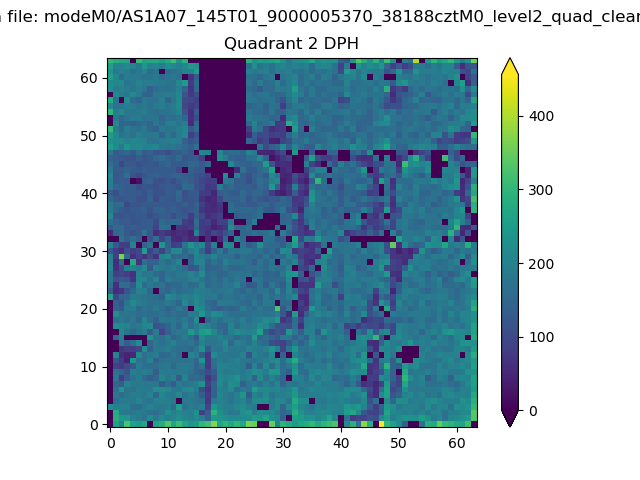 |
Quadrant C |
| Plot type | Count rate plots | Images |
|---|---|---|
| Comparison with Poisson distribution Blue bars denote a histogram of data divided into 1 sec bins. Red curve is a Poisson curve with rate = median count rate of data. |
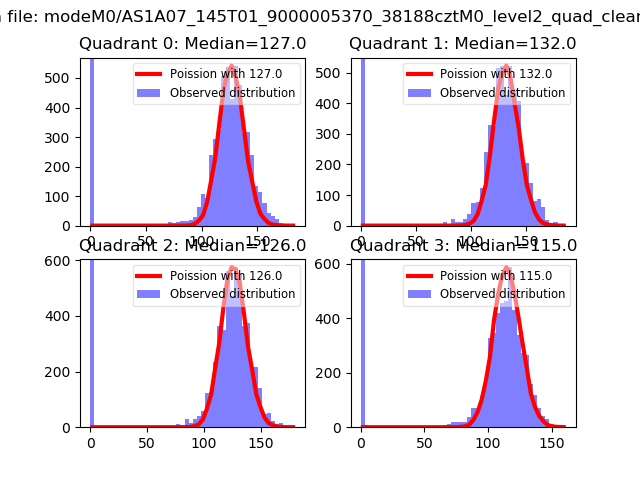 |
 |
| Quadrant-wise count rates Data is divided into 100 sec bins |
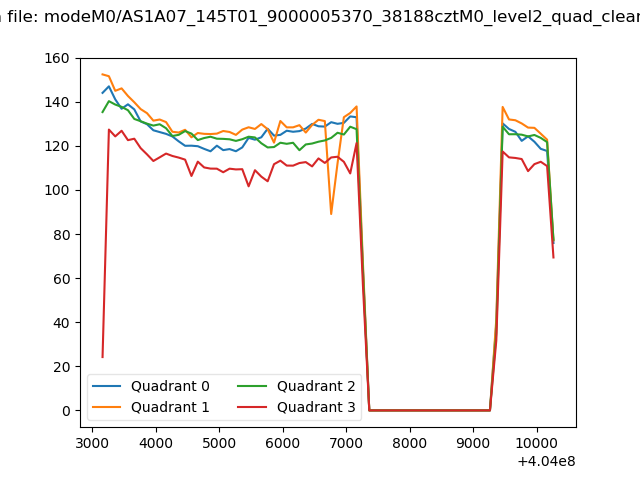 |
|
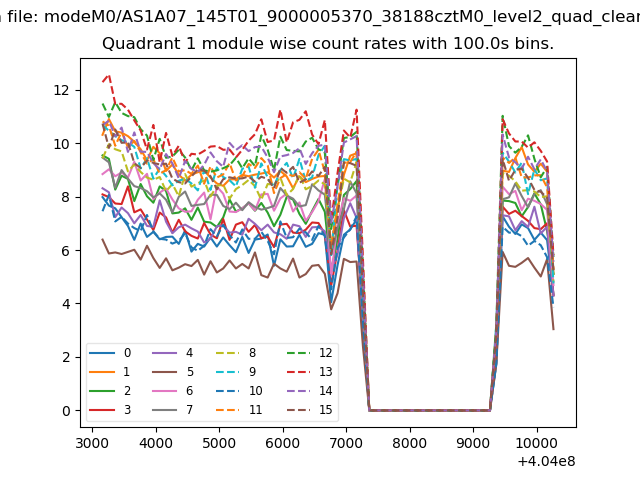
| Module-wise count rates for Quadrant A Data is divided into 100 sec bins |
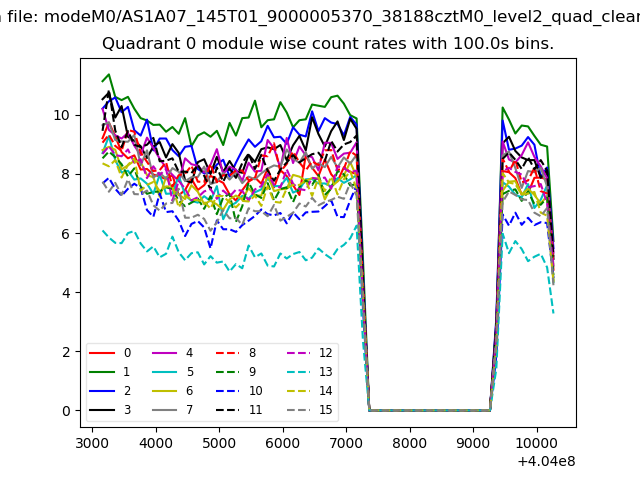 |
 |
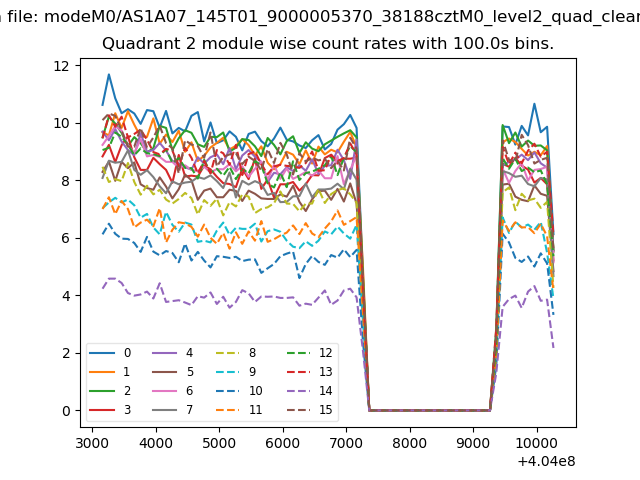
| Module-wise count rates for Quadrant B Data is divided into 100 sec bins |
 |
 |
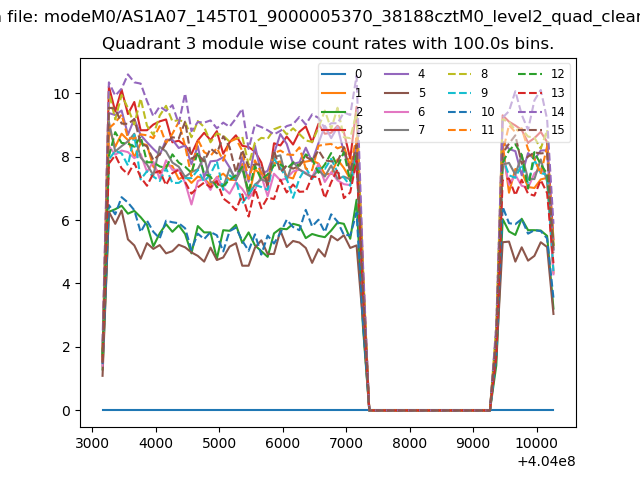
| Module-wise count rates for Quadrant C Data is divided into 100 sec bins |
 |
 |
| Module-wise count rates for Quadrant D Data is divided into 100 sec bins |
 |
 |
| Parameter | Plot |
|---|---|
| CZT HV Monitor | 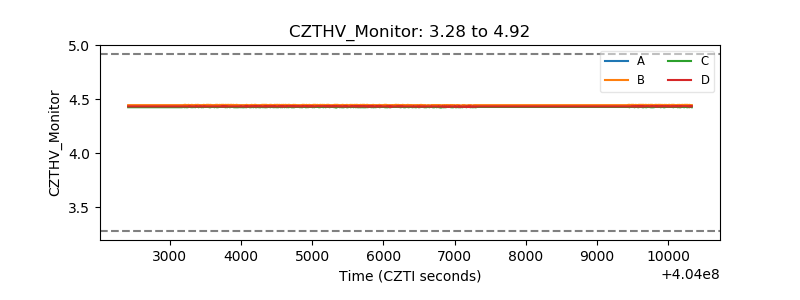 |
| D_VDD | 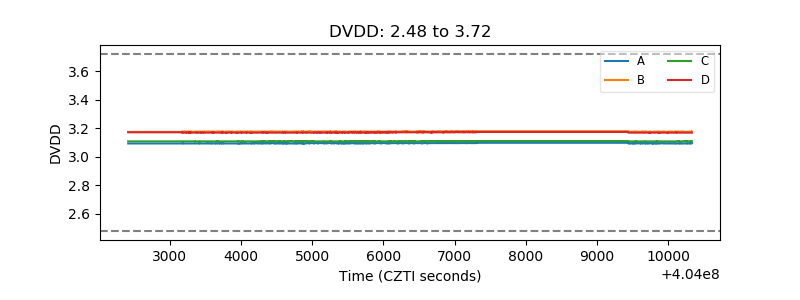 |
| Temperature 1 | 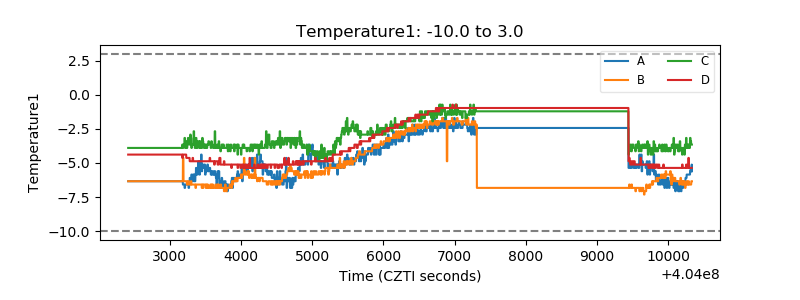 |
| Veto HV Monitor |  |
| Veto LLD | 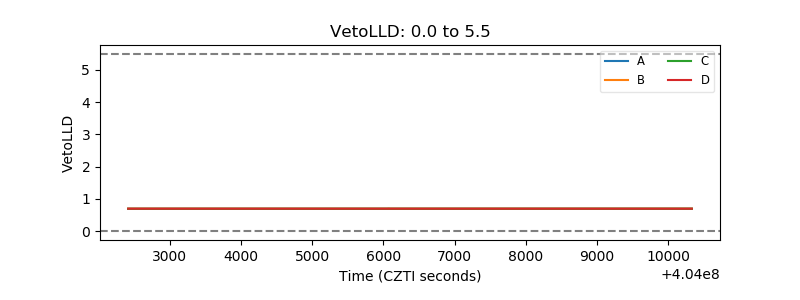 |
| Alpha Counter | 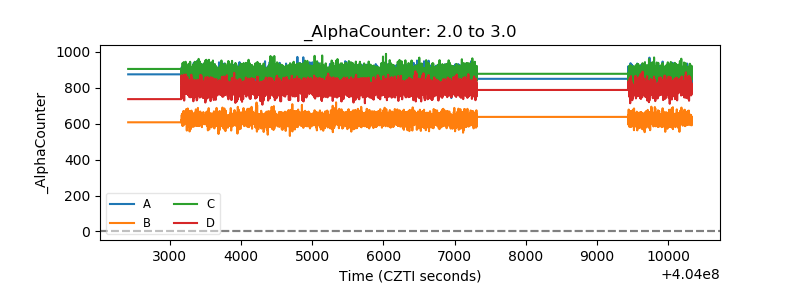 |
| _CPM_Rate | 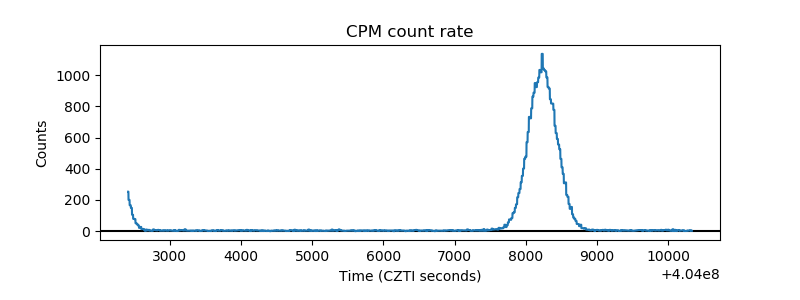 |
| CZT Counter | 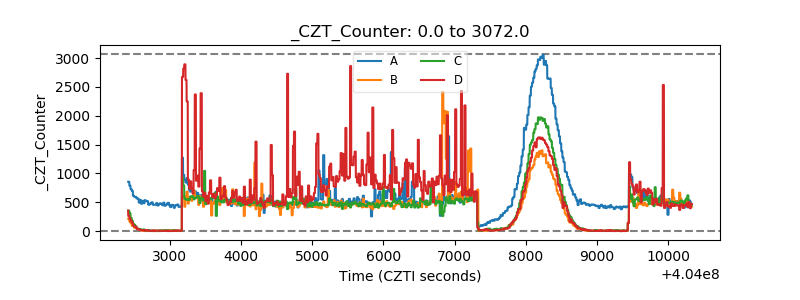 |
| +2.5 Volts monitor | 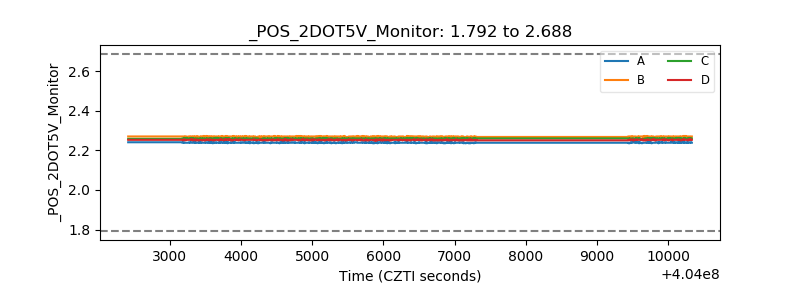 |
| +5 Volts monitor |  |
| _ROLL_ROT | 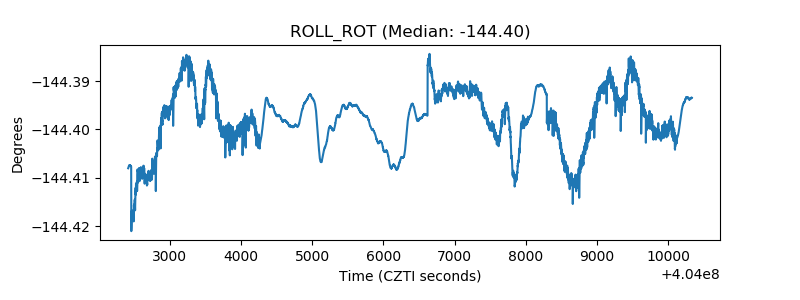 |
| _Roll_DEC | 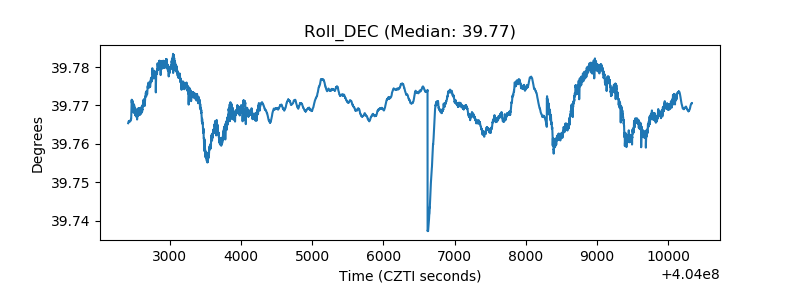 |
| _Roll_RA | 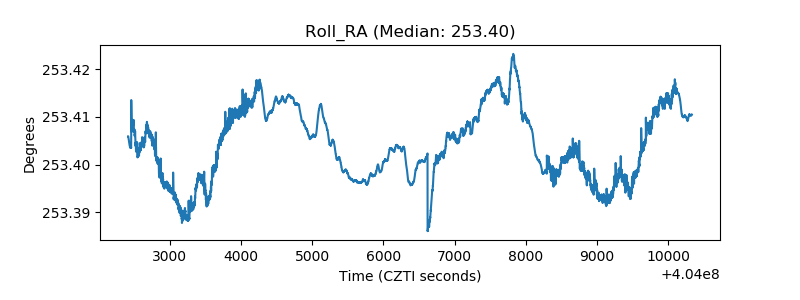 |
| Veto Counter | 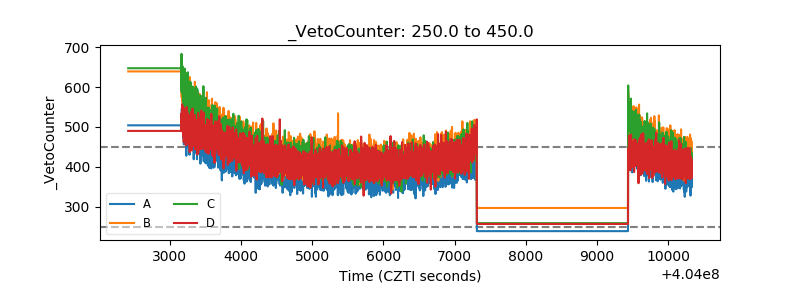 |