| Param | Original file | Final file |
|---|---|---|
| Filename | modeM0/AS1A07_145T01_9000005370_38189cztM0_level2.fits | modeM0/AS1A07_145T01_9000005370_38189cztM0_level2_quad_clean.evt |
| Size (bytes) | 299,341,440 | 92,108,160 |
| Size | 285.5 MB | 87.8 MB |
| Events in quadrant A | 2,828,017 | 617,698 |
| Events in quadrant B | 2,531,433 | 637,810 |
| Events in quadrant C | 2,545,534 | 611,383 |
| Events in quadrant D | 2,774,059 | 561,170 |
| Mode M9 | |||
|---|---|---|---|
| Quadrant | BADHDUFLAG | Total packets | Discarded packets |
| A | 0 | 28 | 0 |
| B | 0 | 28 | 0 |
| C | 0 | 28 | 0 |
| D | 0 | 29 | 0 |
| Mode SS | |||
|---|---|---|---|
| Quadrant | BADHDUFLAG | Total packets | Discarded packets |
| A | 0 | 106 | 0 |
| B | 0 | 106 | 0 |
| C | 0 | 106 | 0 |
| D | 0 | 106 | 0 |
| Mode M0 | |||
|---|---|---|---|
| Quadrant | BADHDUFLAG | Total packets | Discarded packets |
| A | 0 | 11517 | 3 |
| B | 0 | 10828 | 2 |
| C | 0 | 10614 | 2 |
| D | 0 | 11802 | 2 |
| Quadrant | Total seconds | Saturated seconds | Saturation percentage |
|---|---|---|---|
| A | 5151 | 16 | 0.310619% |
| B | 5151 | 32 | 0.621239% |
| C | 5151 | 12 | 0.232964% |
| D | 5151 | 16 | 0.310619% |
Noise dominated data is calculated using 1-second bins in cleaned event files. If a bin has >2000 counts, and if more than 50% of those come from <1% of pixels, then it is considered to be noise-dominated and hence unusable.
| Quadrant | # 1 sec bins | Bins with >0 counts | Bins with >2000 counts | High rate bins dominated by noise | Noise dominated (total time) | Noise dominated (detector-on time) | Marked lightcurve |
|---|---|---|---|---|---|---|---|
| A | 7184 | 5152 | 7 | 7 | 0.10% | 0.14% | 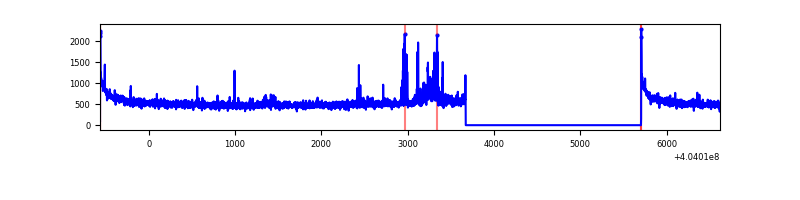 |
| B | 7184 | 5152 | 13 | 13 | 0.18% | 0.25% | 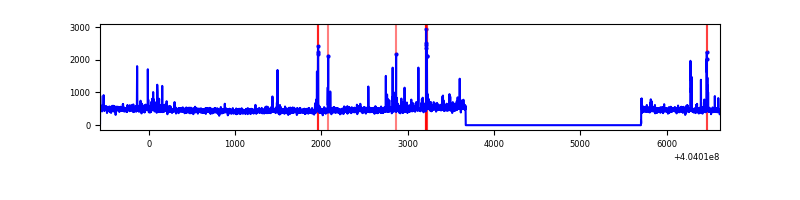 |
| C | 7184 | 5152 | 10 | 10 | 0.14% | 0.19% | 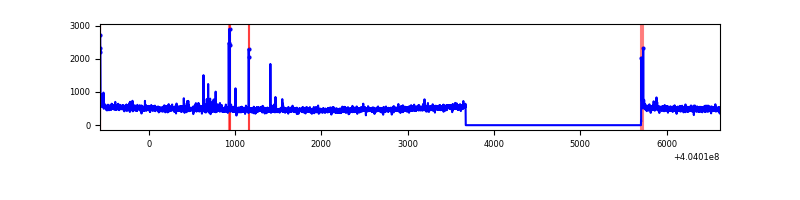 |
| D | 7184 | 5152 | 14 | 14 | 0.19% | 0.27% | 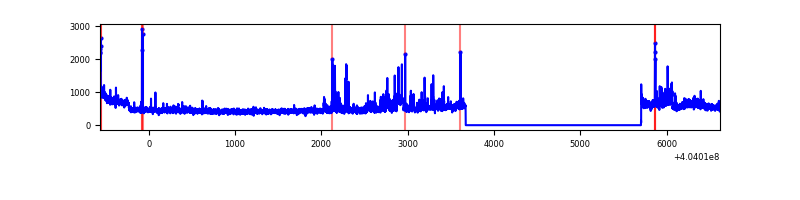 |
Top three noisy pixels from each quadrant. If the there are fewer than three noisy pixels in the level2.evt file, extra rows are filled as -1
| Pixel properties | Quadrant properties | ||||||
|---|---|---|---|---|---|---|---|
| Quadrant | DetID | PixID | Counts | Sigma | Mean | Median | Sigma |
| A | 10 | 83 | 355268 | 2941.78 | 593 | 582 | 120.6 |
| A | 9 | 143 | 117272 | 967.83 | 593 | 582 | 120.6 |
| A | 12 | 189 | 50419 | 413.35 | 593 | 582 | 120.6 |
| B | 4 | 171 | 92826 | 796.82 | 595 | 577 | 115.8 |
| B | 5 | 172 | 31708 | 268.9 | 595 | 577 | 115.8 |
| B | 12 | 18 | 24884 | 209.96 | 595 | 577 | 115.8 |
| C | 15 | 214 | 213423 | 1584.43 | 579 | 583 | 134.3 |
| C | 14 | 254 | 45452 | 334.01 | 579 | 583 | 134.3 |
| C | 0 | 10 | 26620 | 193.82 | 579 | 583 | 134.3 |
| D | 10 | 203 | 184683 | 1314.16 | 578 | 562 | 140.1 |
| D | 2 | 16 | 181885 | 1294.19 | 578 | 562 | 140.1 |
| D | 13 | 249 | 56106 | 396.44 | 578 | 562 | 140.1 |
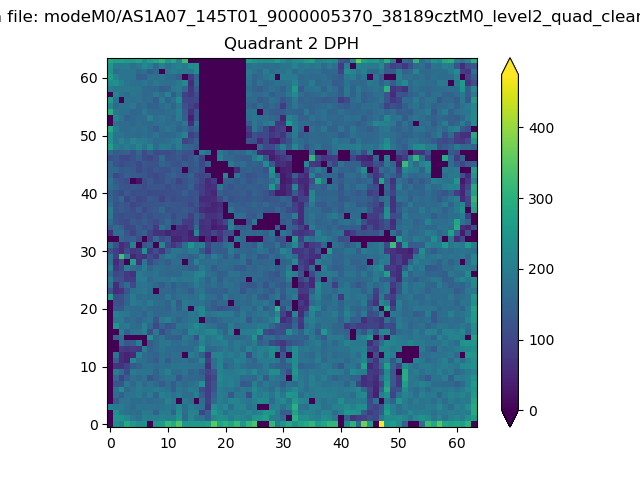
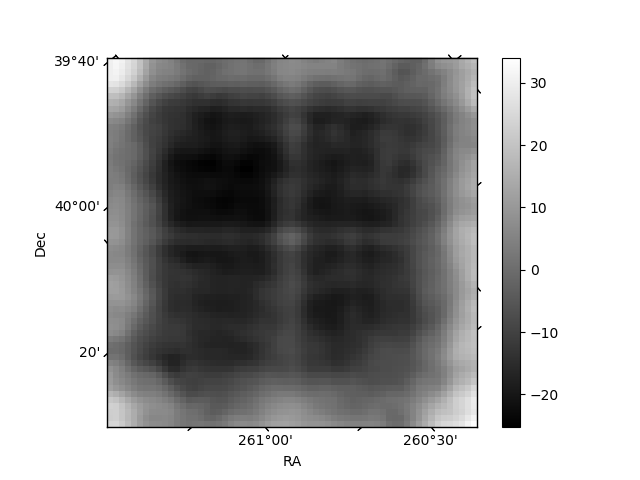
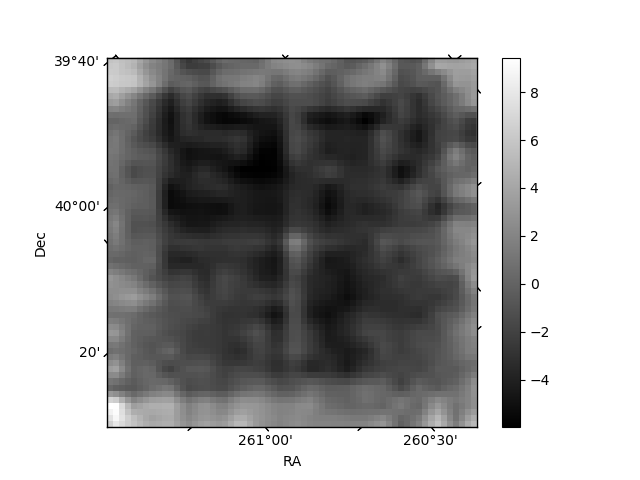
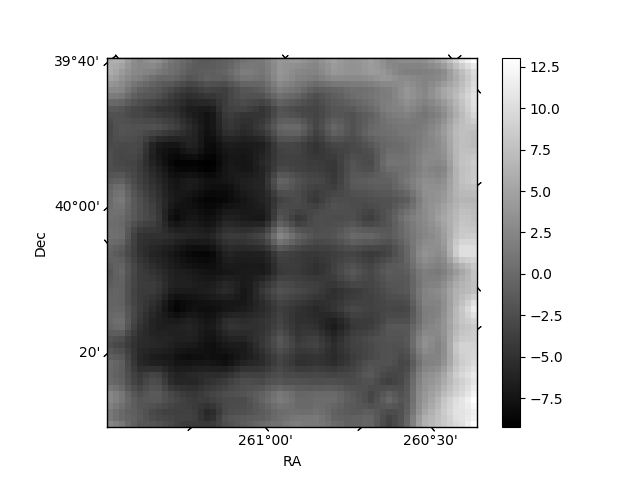
Histogram calculated using DETX and DETY for each event in the final _common_clean file
| Quadrant A | 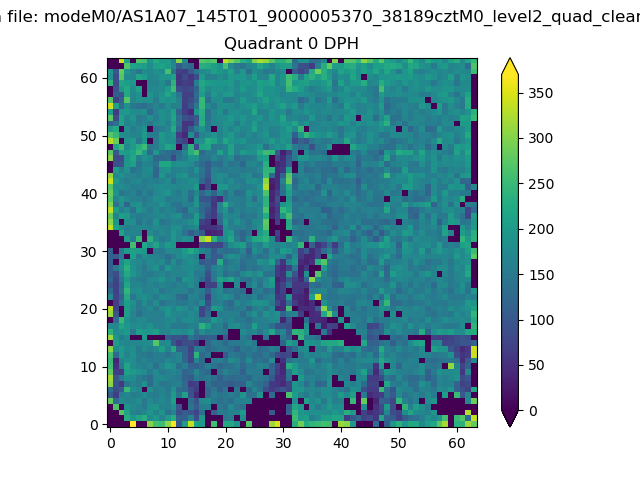 |
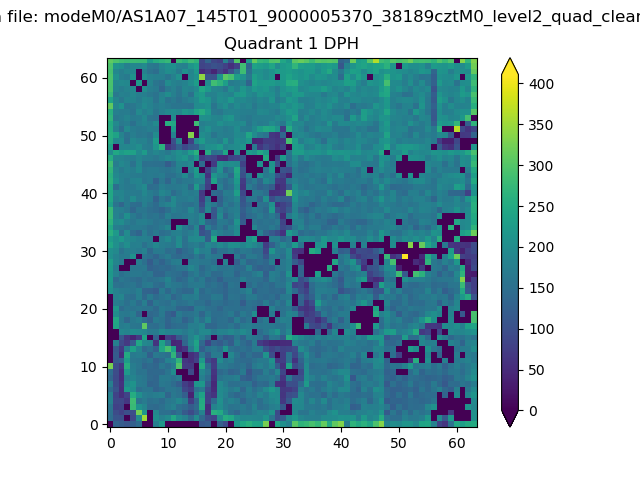 |
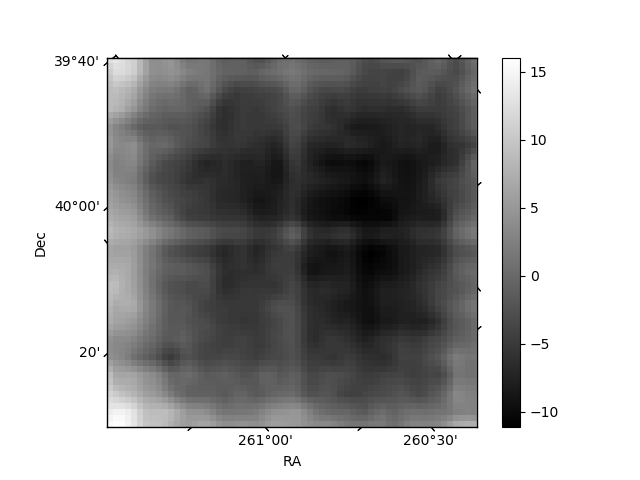
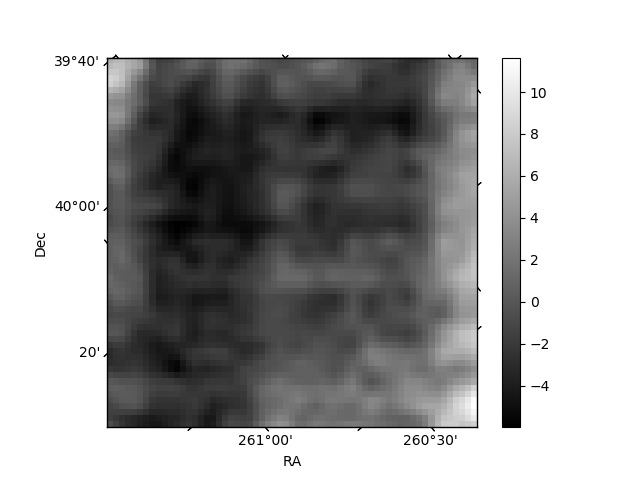
Quadrant B |
|---|---|---|---|
| Quadrant D | 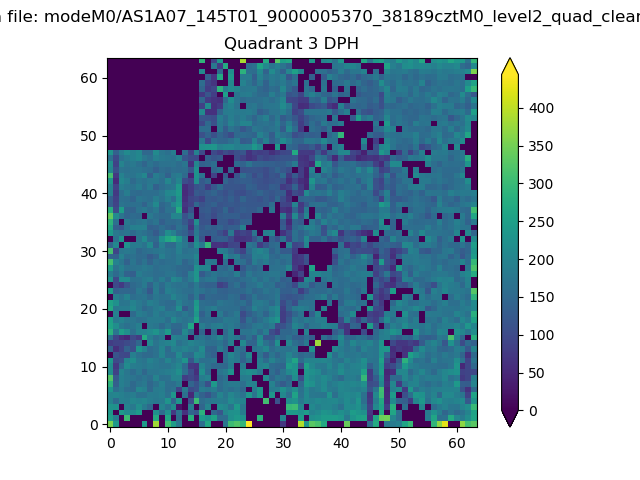 |
 |
Quadrant C |
| Plot type | Count rate plots | Images |
|---|---|---|
| Comparison with Poisson distribution Blue bars denote a histogram of data divided into 1 sec bins. Red curve is a Poisson curve with rate = median count rate of data. |
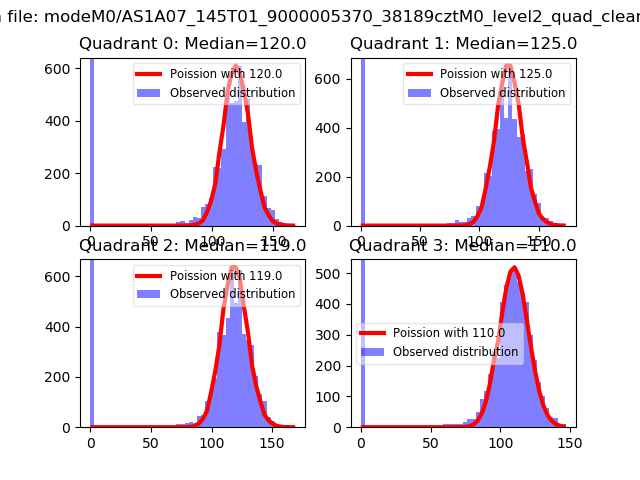 |
 |
| Quadrant-wise count rates Data is divided into 100 sec bins |
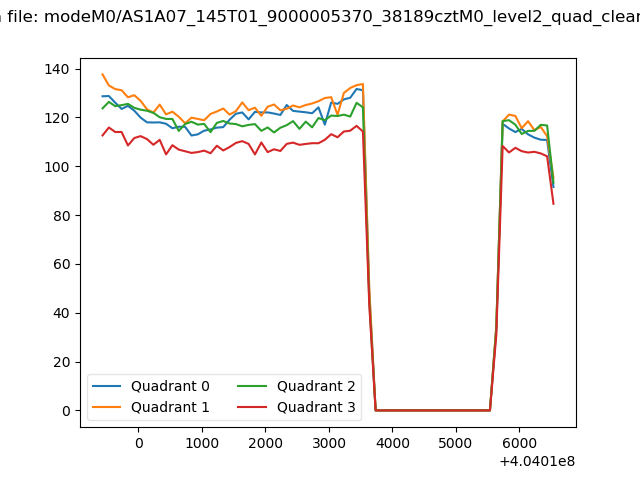 |
|
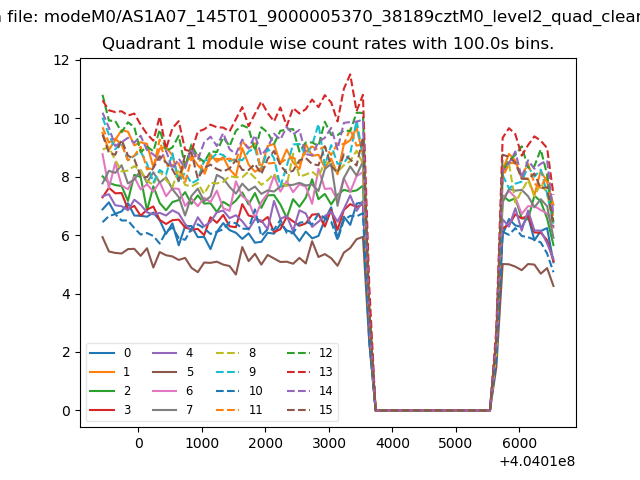
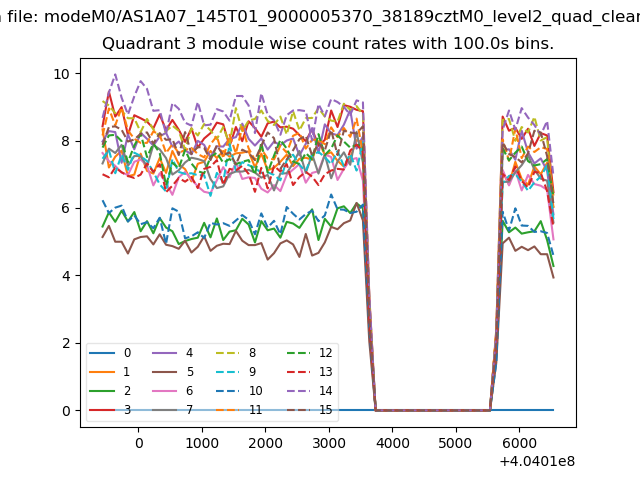
| Module-wise count rates for Quadrant A Data is divided into 100 sec bins |
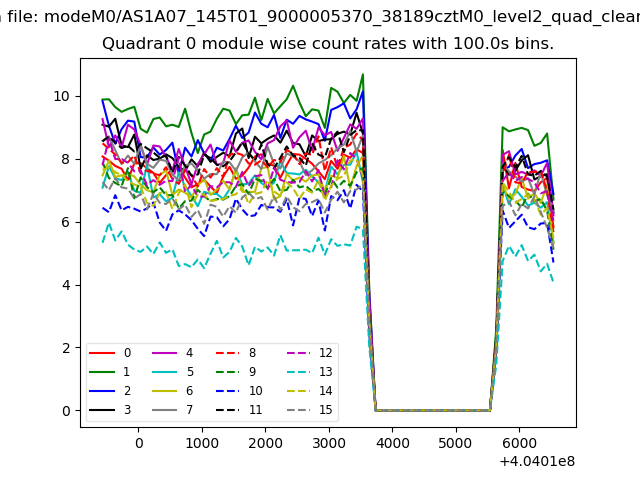 |
 |
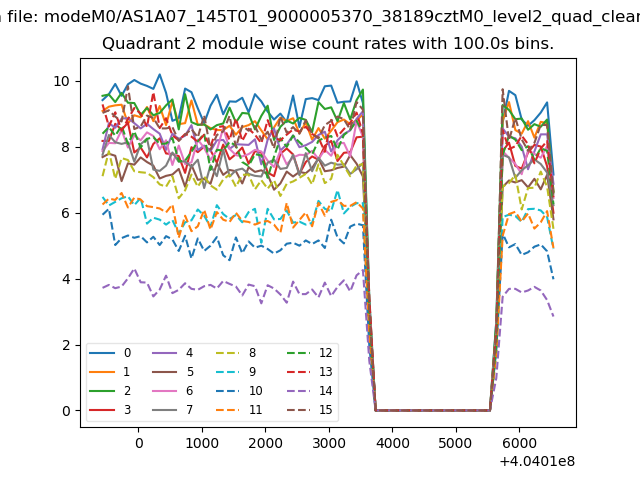
| Module-wise count rates for Quadrant B Data is divided into 100 sec bins |
 |
 |
| Module-wise count rates for Quadrant C Data is divided into 100 sec bins |
 |
 |
| Module-wise count rates for Quadrant D Data is divided into 100 sec bins |
 |
 |
| Parameter | Plot |
|---|---|
| CZT HV Monitor | 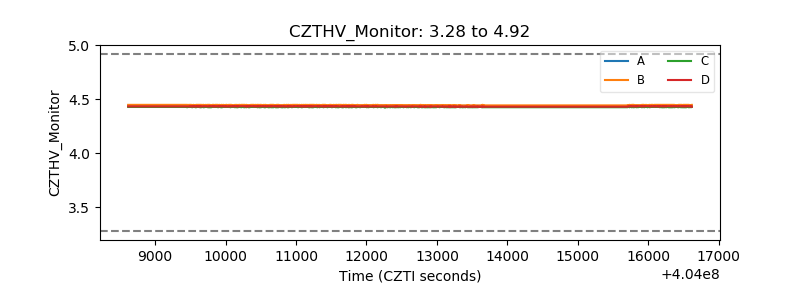 |
| D_VDD | 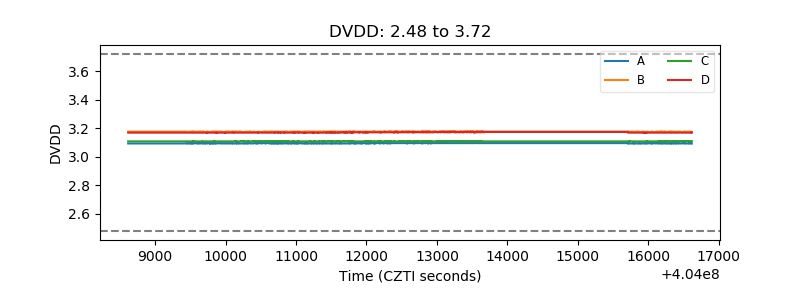 |
| Temperature 1 | 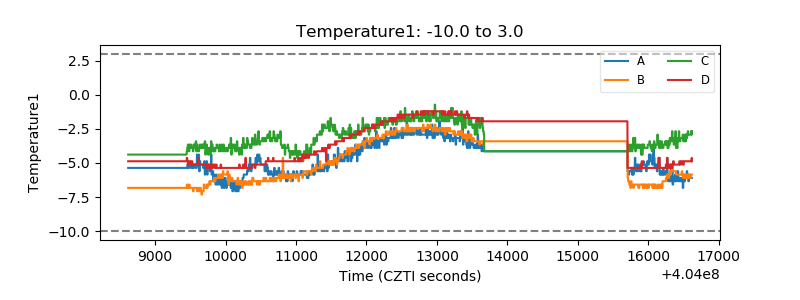 |
| Veto HV Monitor |  |
| Veto LLD | 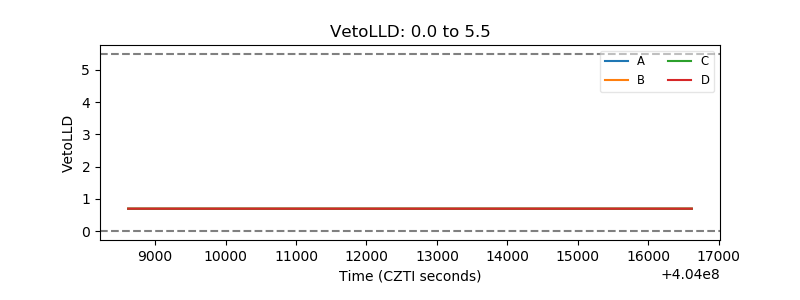 |
| Alpha Counter | 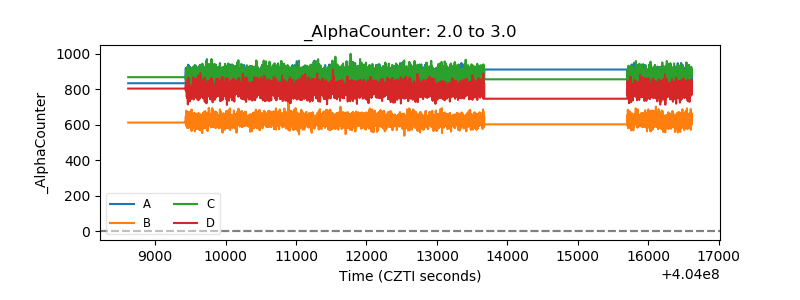 |
| _CPM_Rate | 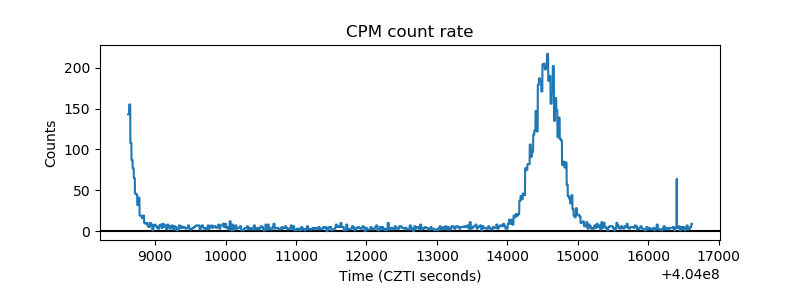 |
| CZT Counter | 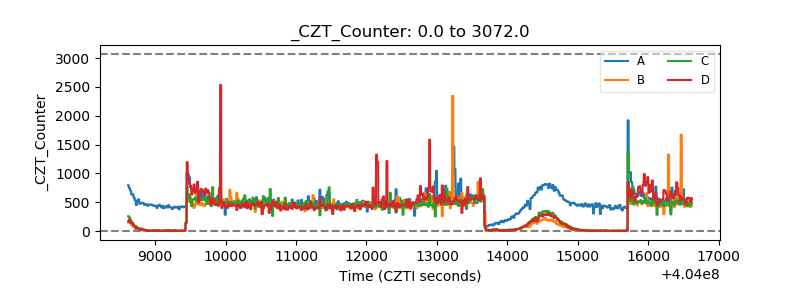 |
| +2.5 Volts monitor | 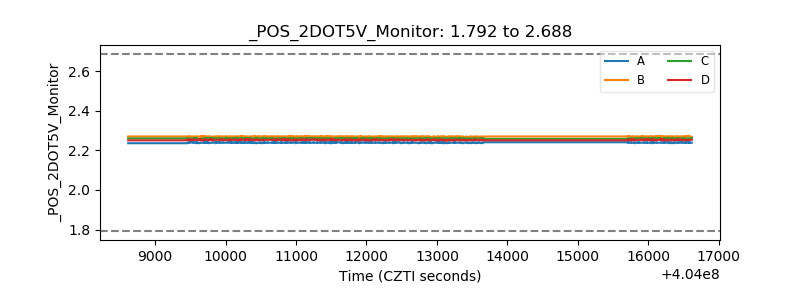 |
| +5 Volts monitor | 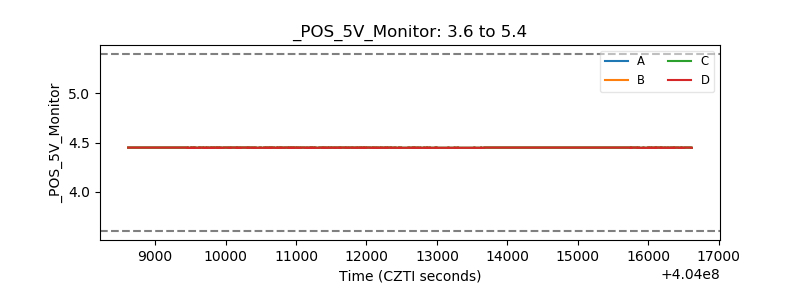 |
| _ROLL_ROT | 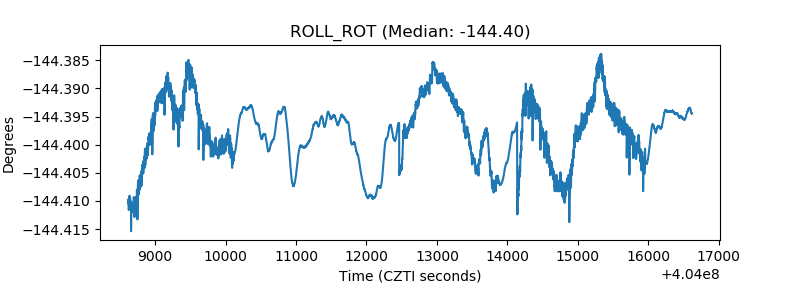 |
| _Roll_DEC | 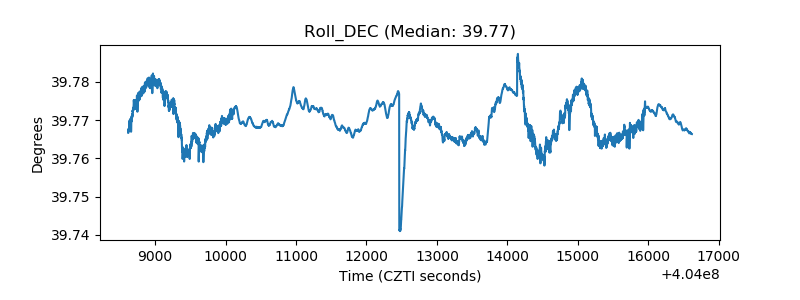 |
| _Roll_RA | 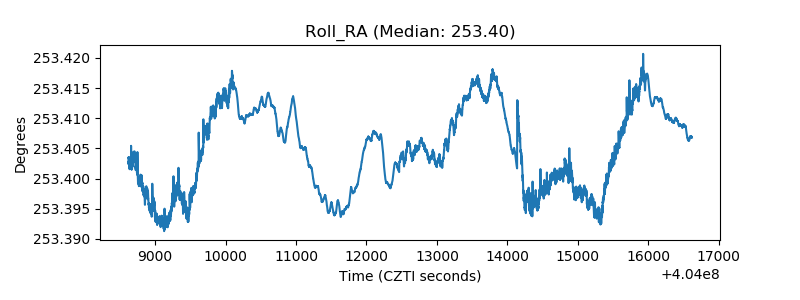 |
| Veto Counter | 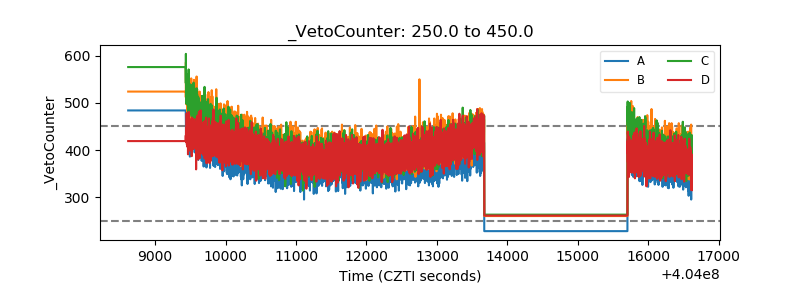 |