| Param | Original file | Final file |
|---|---|---|
| Filename | modeM0/AS1A07_145T01_9000005370_38190cztM0_level2.fits | modeM0/AS1A07_145T01_9000005370_38190cztM0_level2_quad_clean.evt |
| Size (bytes) | 322,410,240 | 92,790,720 |
| Size | 307.5 MB | 88.5 MB |
| Events in quadrant A | 2,803,997 | 621,015 |
| Events in quadrant B | 2,529,957 | 637,753 |
| Events in quadrant C | 2,642,457 | 611,978 |
| Events in quadrant D | 3,539,323 | 562,585 |
| Mode M9 | |||
|---|---|---|---|
| Quadrant | BADHDUFLAG | Total packets | Discarded packets |
| A | 0 | 17 | 0 |
| B | 0 | 17 | 0 |
| C | 0 | 17 | 0 |
| D | 0 | 18 | 0 |
| Mode SS | |||
|---|---|---|---|
| Quadrant | BADHDUFLAG | Total packets | Discarded packets |
| A | 0 | 110 | 0 |
| B | 0 | 110 | 0 |
| C | 0 | 110 | 0 |
| D | 0 | 110 | 0 |
| Mode M0 | |||
|---|---|---|---|
| Quadrant | BADHDUFLAG | Total packets | Discarded packets |
| A | 0 | 11512 | 3 |
| B | 0 | 11122 | 2 |
| C | 0 | 11113 | 2 |
| D | 0 | 14194 | 2 |
| Quadrant | Total seconds | Saturated seconds | Saturation percentage |
|---|---|---|---|
| A | 5376 | 8 | 0.148810% |
| B | 5376 | 32 | 0.595238% |
| C | 5376 | 11 | 0.204613% |
| D | 5376 | 33 | 0.613839% |
Noise dominated data is calculated using 1-second bins in cleaned event files. If a bin has >2000 counts, and if more than 50% of those come from <1% of pixels, then it is considered to be noise-dominated and hence unusable.
| Quadrant | # 1 sec bins | Bins with >0 counts | Bins with >2000 counts | High rate bins dominated by noise | Noise dominated (total time) | Noise dominated (detector-on time) | Marked lightcurve |
|---|---|---|---|---|---|---|---|
| A | 7109 | 5377 | 5 | 5 | 0.07% | 0.09% | 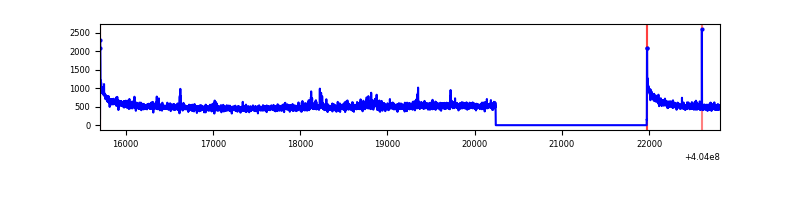 |
| B | 7109 | 5377 | 15 | 15 | 0.21% | 0.28% | 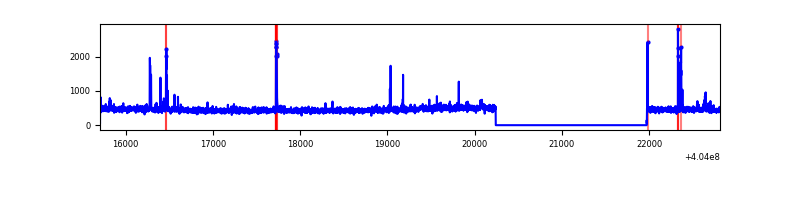 |
| C | 7109 | 5377 | 8 | 8 | 0.11% | 0.15% | 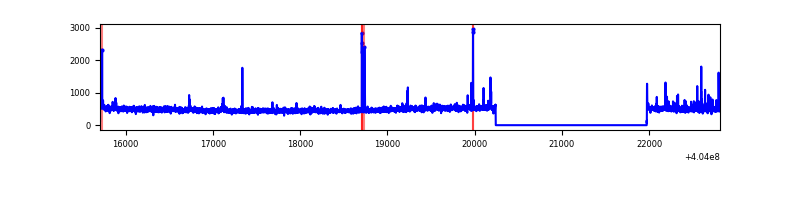 |
| D | 7109 | 5377 | 36 | 36 | 0.51% | 0.67% | 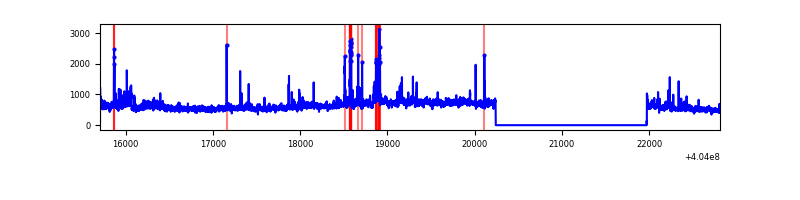 |
Top three noisy pixels from each quadrant. If the there are fewer than three noisy pixels in the level2.evt file, extra rows are filled as -1
| Pixel properties | Quadrant properties | ||||||
|---|---|---|---|---|---|---|---|
| Quadrant | DetID | PixID | Counts | Sigma | Mean | Median | Sigma |
| A | 10 | 83 | 362521 | 2914.76 | 609 | 597 | 124.2 |
| A | 12 | 16 | 36204 | 286.76 | 609 | 597 | 124.2 |
| A | 12 | 189 | 24437 | 192.0 | 609 | 597 | 124.2 |
| B | 4 | 171 | 58557 | 495.26 | 607 | 590 | 117.0 |
| B | 5 | 172 | 39410 | 331.67 | 607 | 590 | 117.0 |
| B | 12 | 18 | 25154 | 209.87 | 607 | 590 | 117.0 |
| C | 15 | 214 | 222029 | 1611.8 | 593 | 597 | 137.4 |
| C | 14 | 254 | 77689 | 561.15 | 593 | 597 | 137.4 |
| C | 0 | 10 | 16924 | 118.84 | 593 | 597 | 137.4 |
| D | 10 | 203 | 777039 | 5396.17 | 592 | 576 | 143.9 |
| D | 2 | 16 | 228782 | 1585.96 | 592 | 576 | 143.9 |
| D | 13 | 249 | 90807 | 627.07 | 592 | 576 | 143.9 |
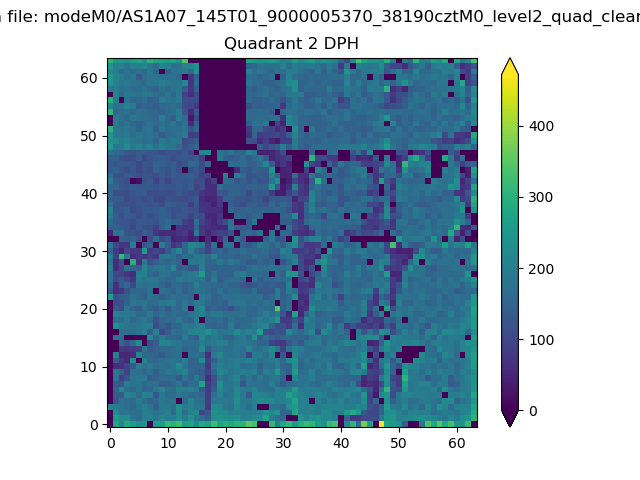
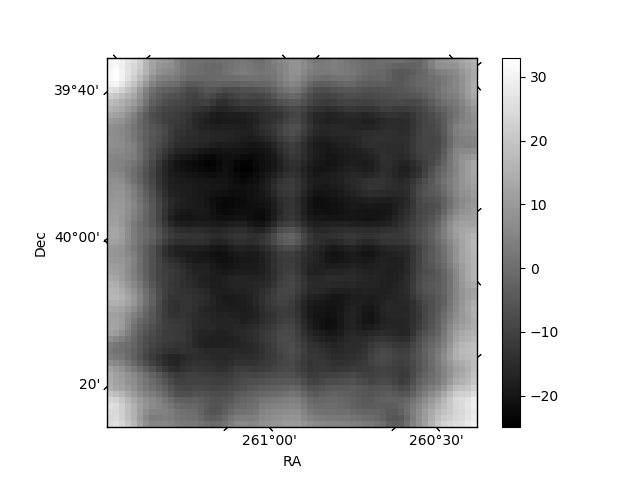
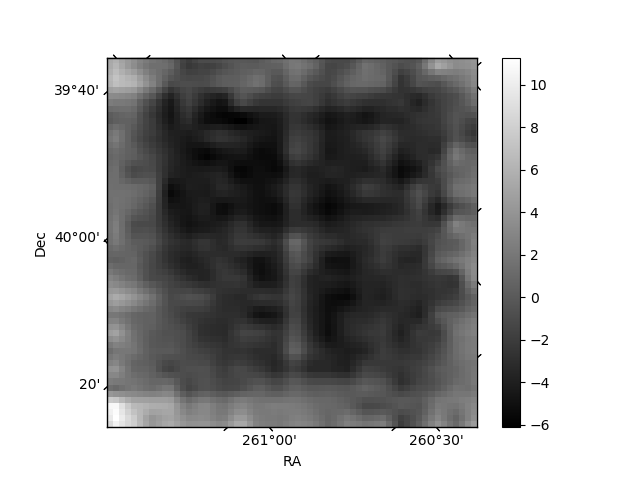
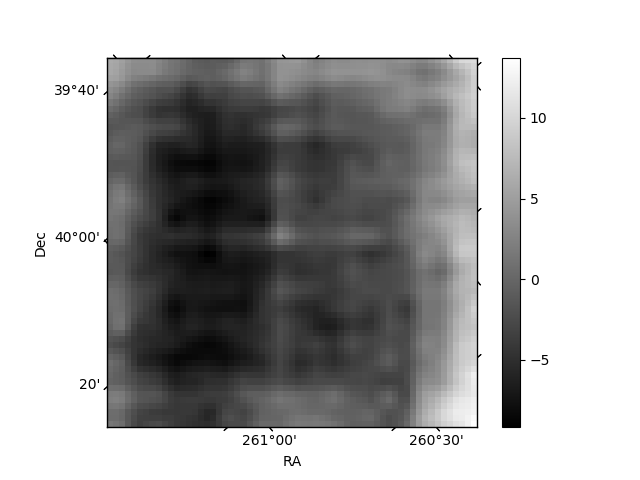
Histogram calculated using DETX and DETY for each event in the final _common_clean file
| Quadrant A | 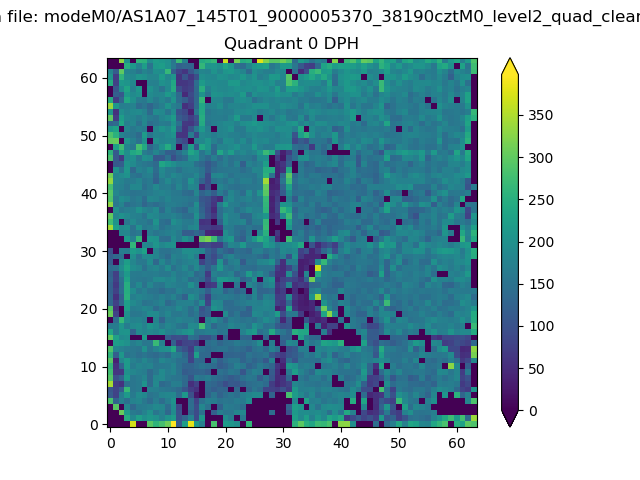 |
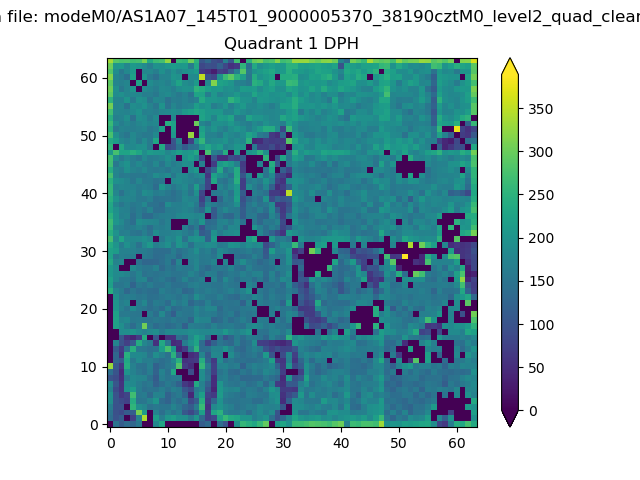 |
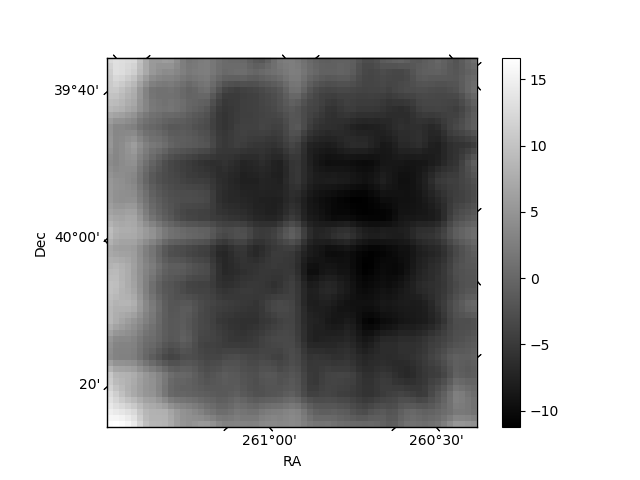
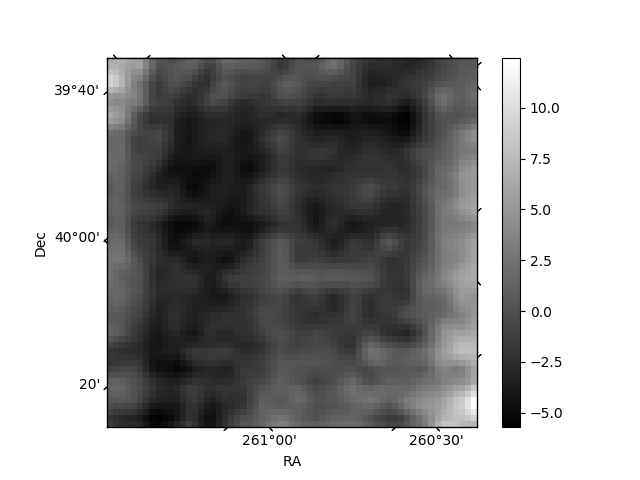
Quadrant B |
|---|---|---|---|
| Quadrant D | 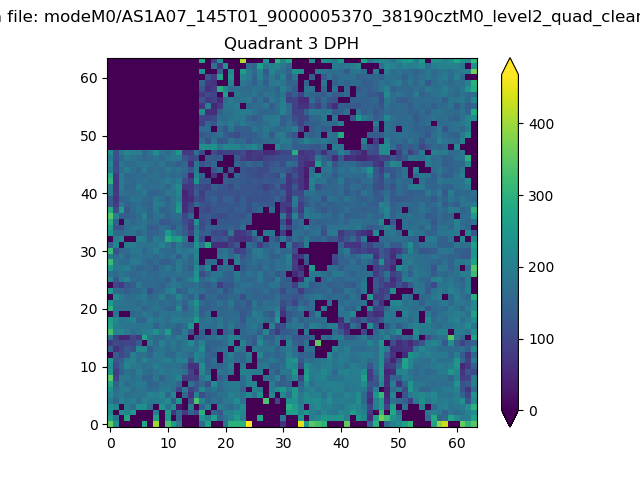 |
 |
Quadrant C |
| Plot type | Count rate plots | Images |
|---|---|---|
| Comparison with Poisson distribution Blue bars denote a histogram of data divided into 1 sec bins. Red curve is a Poisson curve with rate = median count rate of data. |
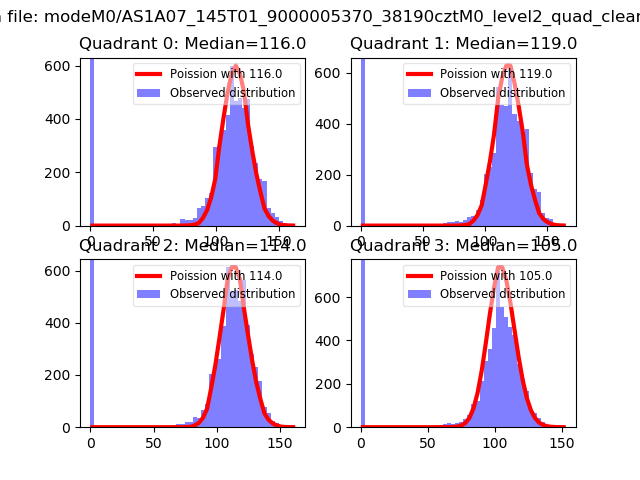 |
 |
| Quadrant-wise count rates Data is divided into 100 sec bins |
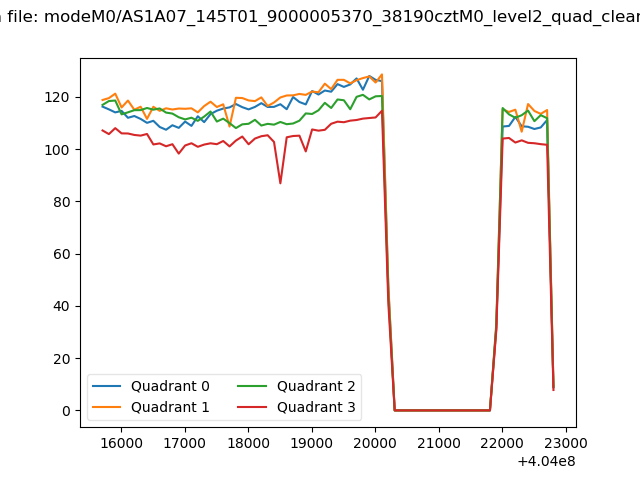 |
|
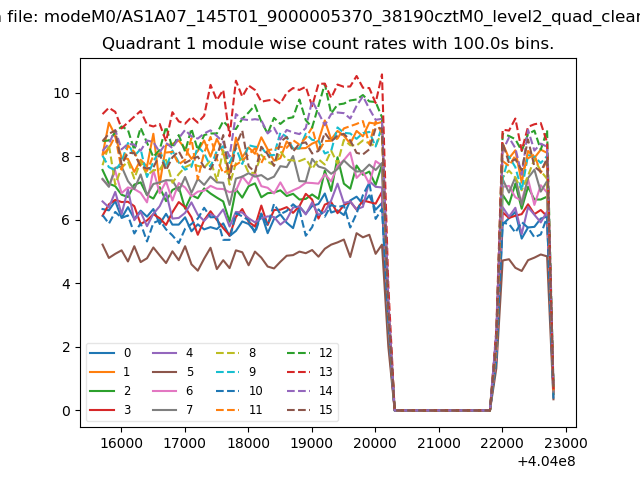
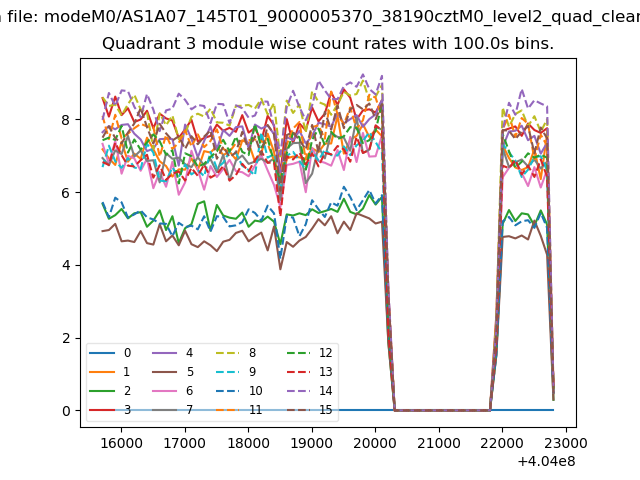
| Module-wise count rates for Quadrant A Data is divided into 100 sec bins |
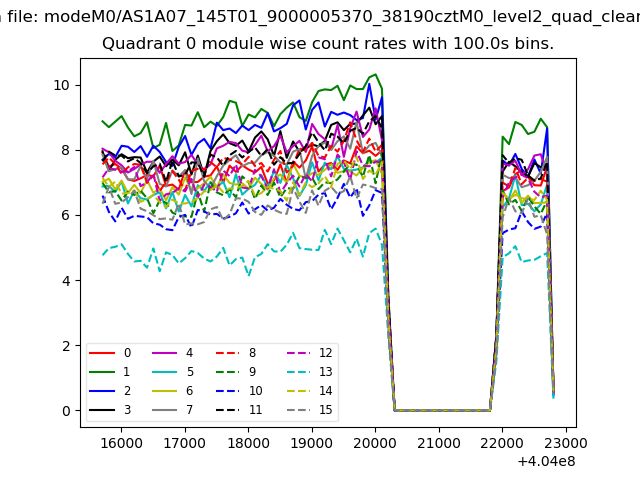 |
 |
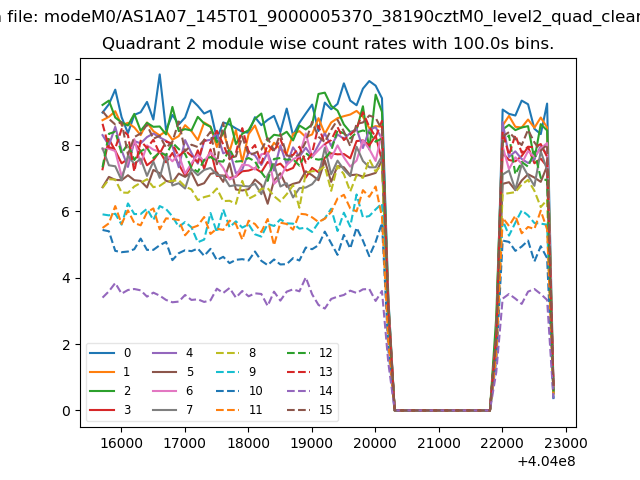
| Module-wise count rates for Quadrant B Data is divided into 100 sec bins |
 |
 |
| Module-wise count rates for Quadrant C Data is divided into 100 sec bins |
 |
 |
| Module-wise count rates for Quadrant D Data is divided into 100 sec bins |
 |
 |
| Parameter | Plot |
|---|---|
| CZT HV Monitor | 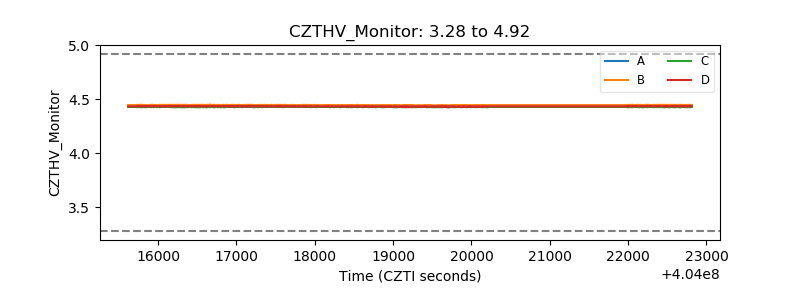 |
| D_VDD | 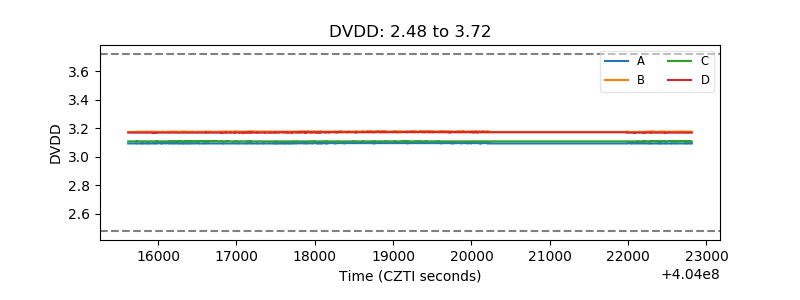 |
| Temperature 1 | 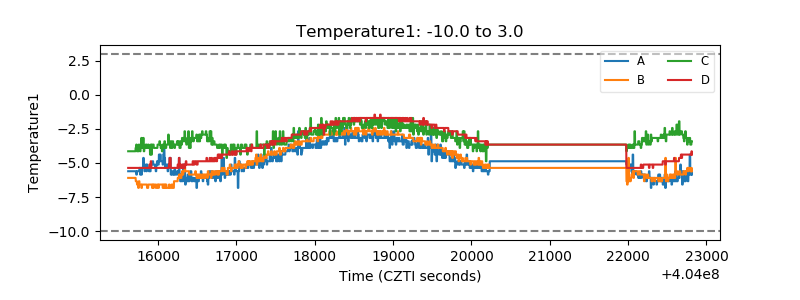 |
| Veto HV Monitor | 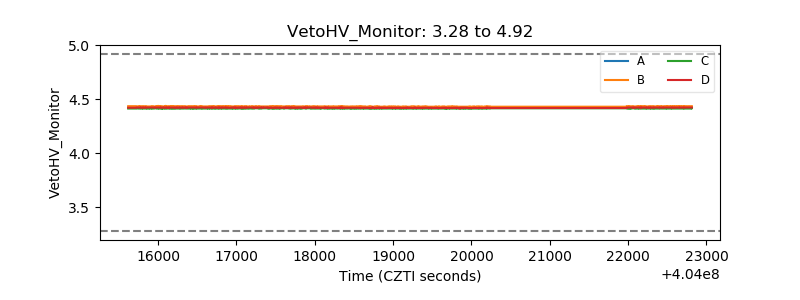 |
| Veto LLD | 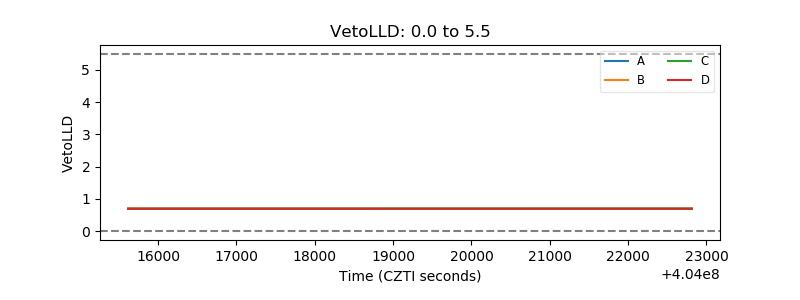 |
| Alpha Counter | 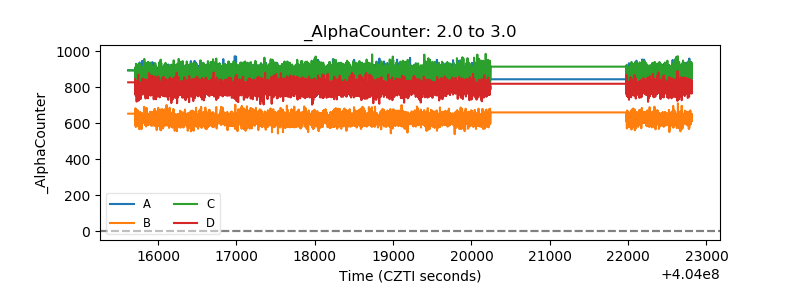 |
| _CPM_Rate | 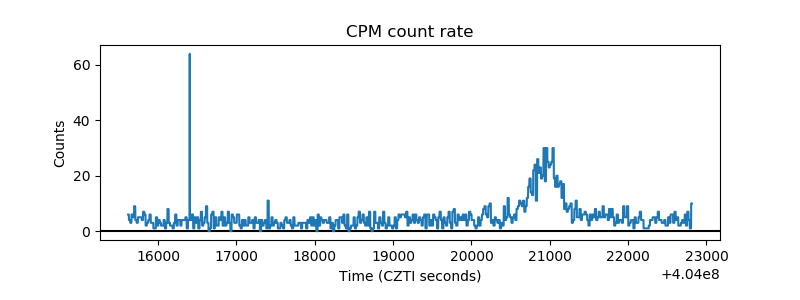 |
| CZT Counter | 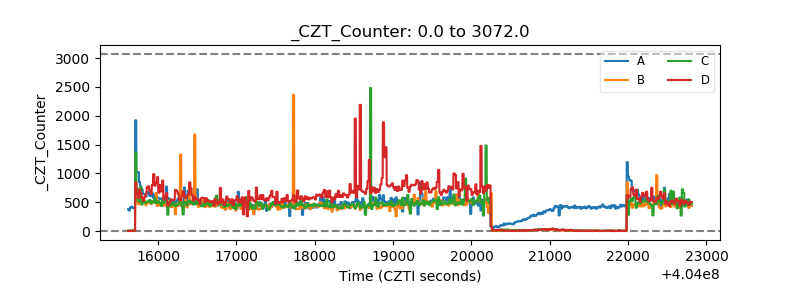 |
| +2.5 Volts monitor | 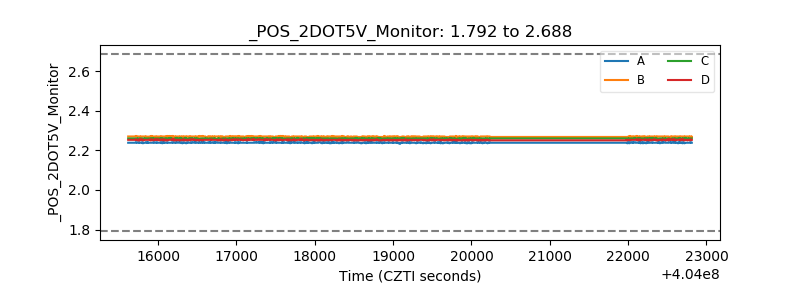 |
| +5 Volts monitor | 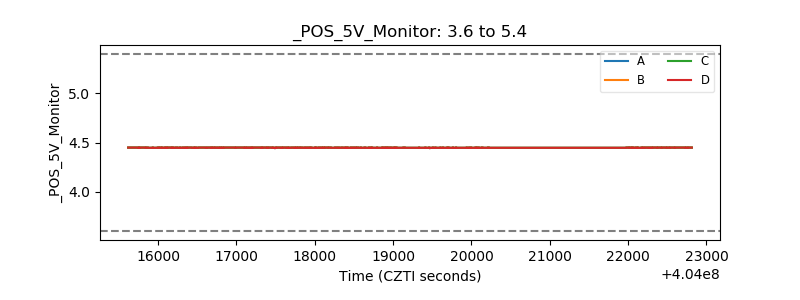 |
| _ROLL_ROT | 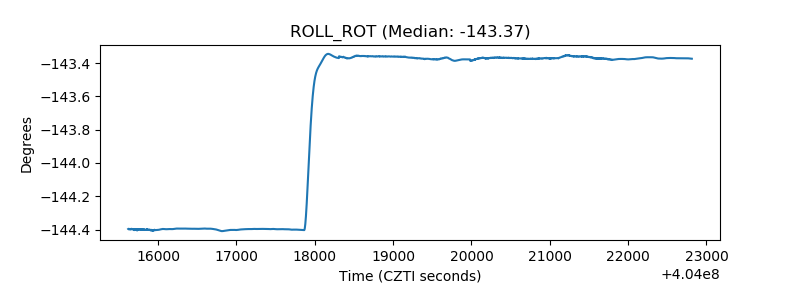 |
| _Roll_DEC | 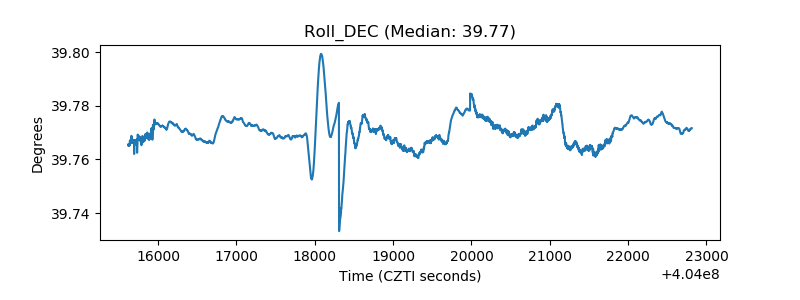 |
| _Roll_RA | 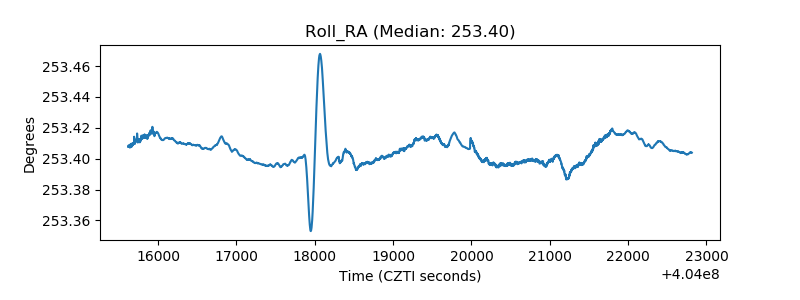 |
| Veto Counter | 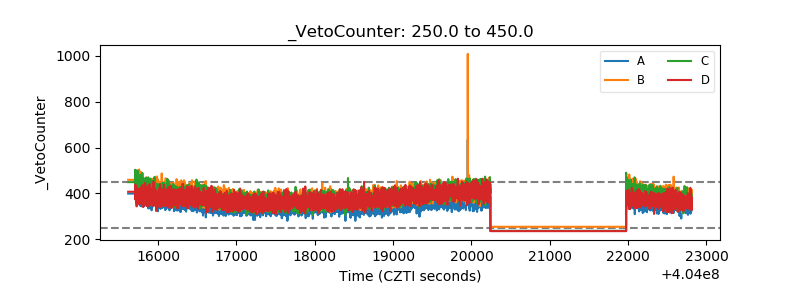 |