| Param | Original file | Final file |
|---|---|---|
| Filename | modeM0/AS1A07_145T01_9000005370_38191cztM0_level2.fits | modeM0/AS1A07_145T01_9000005370_38191cztM0_level2_quad_clean.evt |
| Size (bytes) | 334,670,400 | 97,666,560 |
| Size | 319.2 MB | 93.1 MB |
| Events in quadrant A | 2,964,122 | 653,823 |
| Events in quadrant B | 2,649,536 | 671,426 |
| Events in quadrant C | 2,787,144 | 640,831 |
| Events in quadrant D | 3,541,389 | 590,976 |
| Mode M9 | |||
|---|---|---|---|
| Quadrant | BADHDUFLAG | Total packets | Discarded packets |
| A | 0 | 15 | 0 |
| B | 0 | 15 | 0 |
| C | 0 | 15 | 0 |
| D | 0 | 16 | 0 |
| Mode SS | |||
|---|---|---|---|
| Quadrant | BADHDUFLAG | Total packets | Discarded packets |
| A | 0 | 116 | 0 |
| B | 0 | 116 | 0 |
| C | 0 | 116 | 0 |
| D | 0 | 116 | 0 |
| Mode M0 | |||
|---|---|---|---|
| Quadrant | BADHDUFLAG | Total packets | Discarded packets |
| A | 0 | 12172 | 3 |
| B | 0 | 11746 | 2 |
| C | 0 | 11792 | 2 |
| D | 0 | 14309 | 2 |
| Quadrant | Total seconds | Saturated seconds | Saturation percentage |
|---|---|---|---|
| A | 5729 | 9 | 0.157095% |
| B | 5729 | 27 | 0.471286% |
| C | 5729 | 11 | 0.192006% |
| D | 5729 | 24 | 0.418921% |
Noise dominated data is calculated using 1-second bins in cleaned event files. If a bin has >2000 counts, and if more than 50% of those come from <1% of pixels, then it is considered to be noise-dominated and hence unusable.
| Quadrant | # 1 sec bins | Bins with >0 counts | Bins with >2000 counts | High rate bins dominated by noise | Noise dominated (total time) | Noise dominated (detector-on time) | Marked lightcurve |
|---|---|---|---|---|---|---|---|
| A | 7162 | 5730 | 6 | 6 | 0.08% | 0.10% | 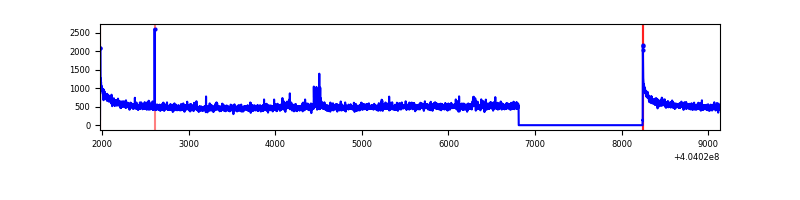 |
| B | 7162 | 5730 | 14 | 14 | 0.20% | 0.24% | 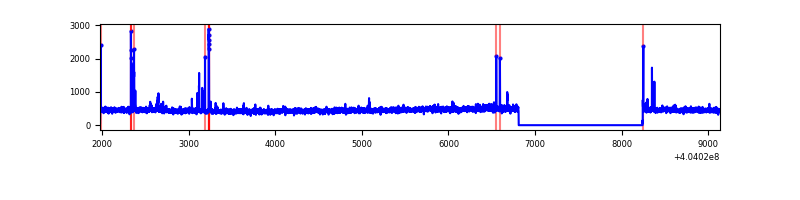 |
| C | 7162 | 5730 | 5 | 5 | 0.07% | 0.09% | 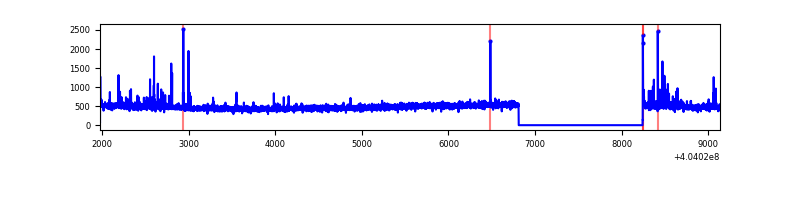 |
| D | 7162 | 5730 | 17 | 17 | 0.24% | 0.30% |  |
Top three noisy pixels from each quadrant. If the there are fewer than three noisy pixels in the level2.evt file, extra rows are filled as -1
| Pixel properties | Quadrant properties | ||||||
|---|---|---|---|---|---|---|---|
| Quadrant | DetID | PixID | Counts | Sigma | Mean | Median | Sigma |
| A | 10 | 83 | 379948 | 2898.91 | 647 | 634 | 130.8 |
| A | 12 | 189 | 34873 | 261.67 | 647 | 634 | 130.8 |
| A | 12 | 16 | 22107 | 164.11 | 647 | 634 | 130.8 |
| B | 5 | 172 | 87633 | 697.13 | 641 | 624 | 124.8 |
| B | 12 | 111 | 15638 | 120.29 | 641 | 624 | 124.8 |
| B | 11 | 111 | 14320 | 109.73 | 641 | 624 | 124.8 |
| C | 15 | 214 | 236923 | 1613.14 | 629 | 634 | 146.5 |
| C | 14 | 254 | 62404 | 421.7 | 629 | 634 | 146.5 |
| C | 0 | 10 | 12699 | 82.37 | 629 | 634 | 146.5 |
| D | 10 | 203 | 689289 | 4476.32 | 631 | 614 | 153.8 |
| D | 14 | 52 | 88547 | 571.56 | 631 | 614 | 153.8 |
| D | 2 | 16 | 59704 | 384.08 | 631 | 614 | 153.8 |
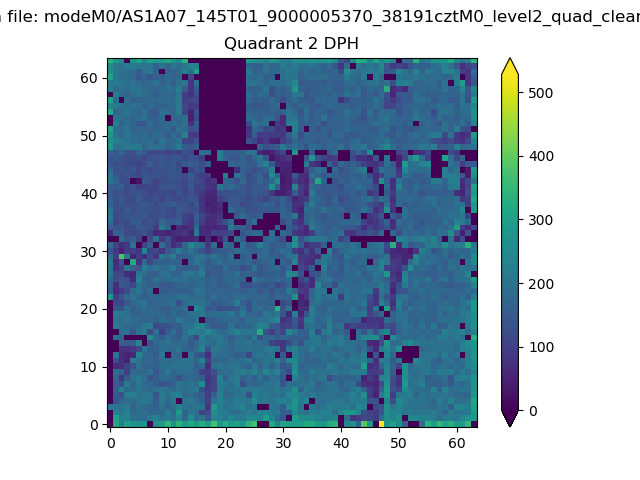
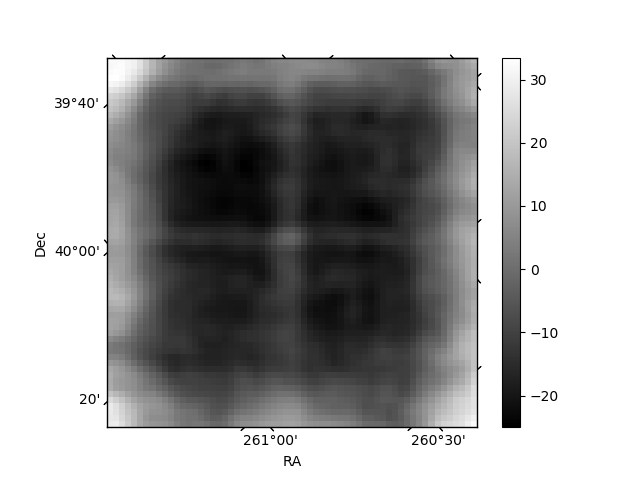
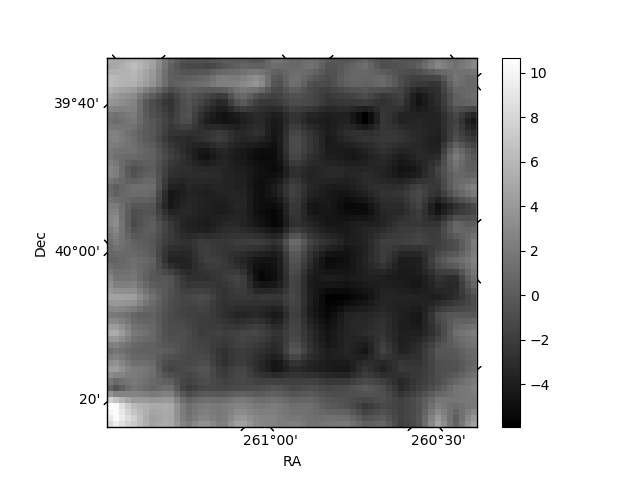
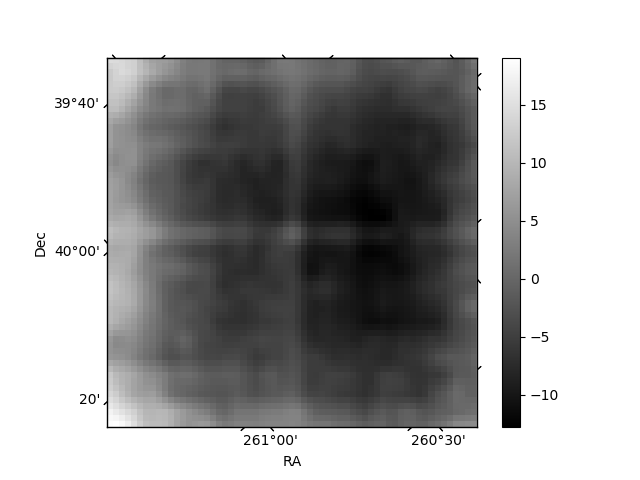
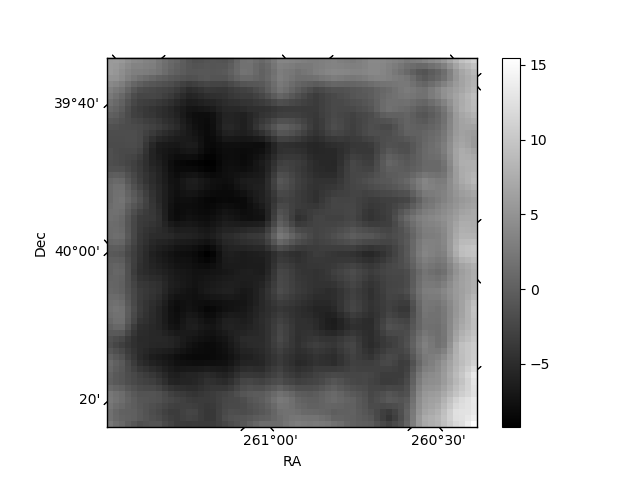
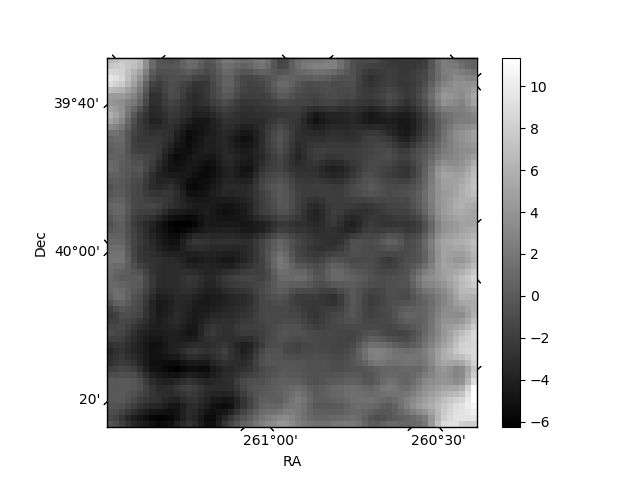
Histogram calculated using DETX and DETY for each event in the final _common_clean file
| Quadrant A | 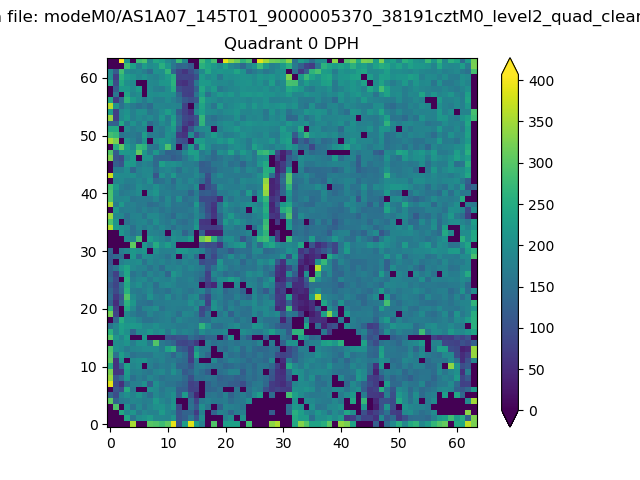 |
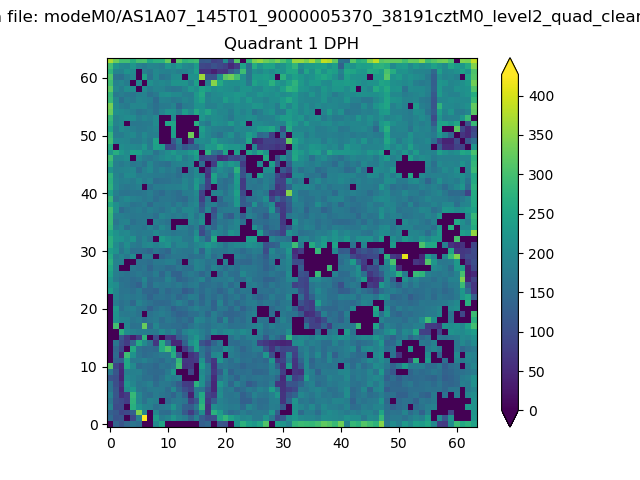 |
Quadrant B |
|---|---|---|---|
| Quadrant D | 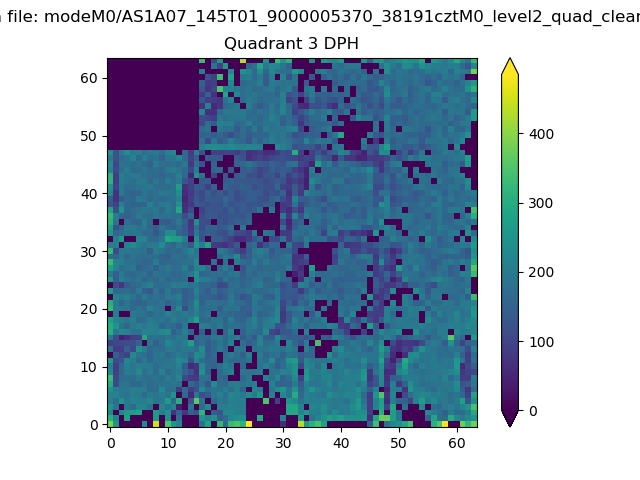 |
 |
Quadrant C |
| Plot type | Count rate plots | Images |
|---|---|---|
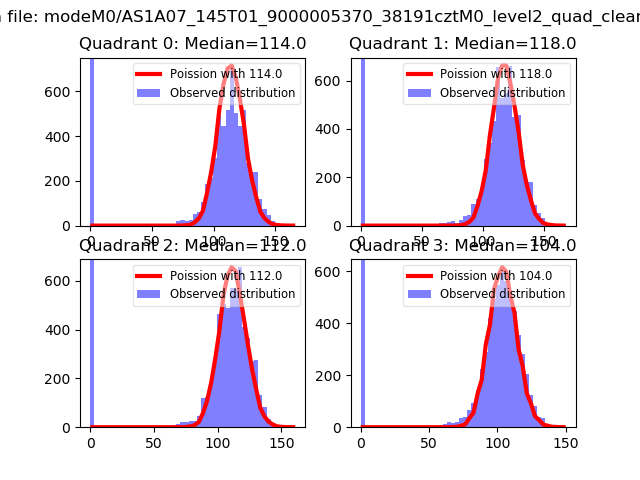
| Comparison with Poisson distribution Blue bars denote a histogram of data divided into 1 sec bins. Red curve is a Poisson curve with rate = median count rate of data. |
 |
 |
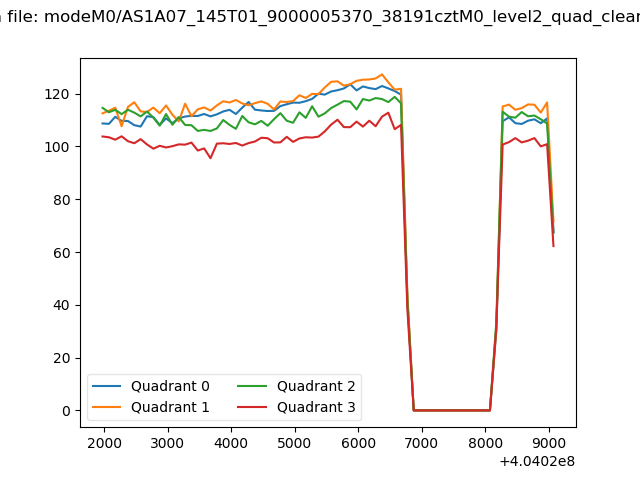
| Quadrant-wise count rates Data is divided into 100 sec bins |
 |
|
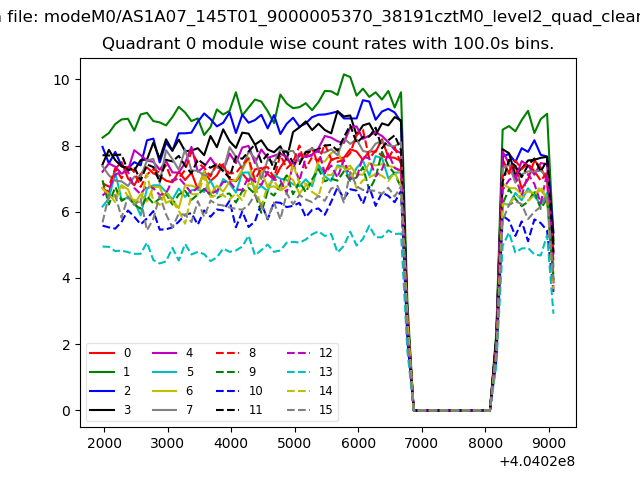
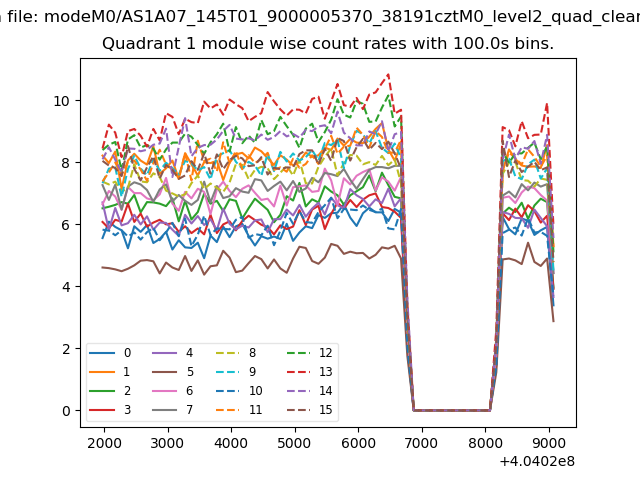
| Module-wise count rates for Quadrant A Data is divided into 100 sec bins |
 |
 |
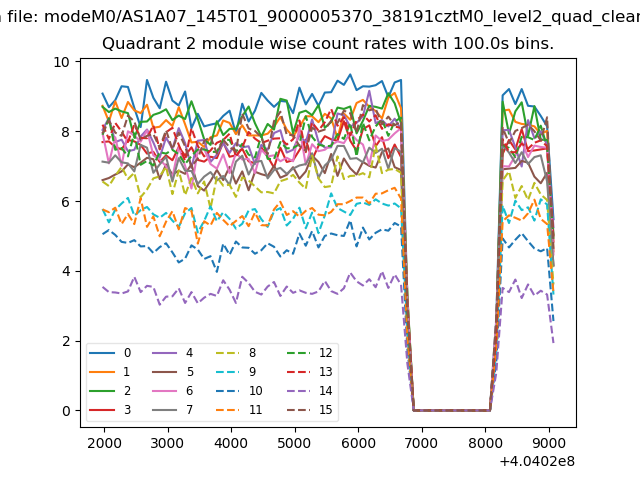
| Module-wise count rates for Quadrant B Data is divided into 100 sec bins |
 |
 |
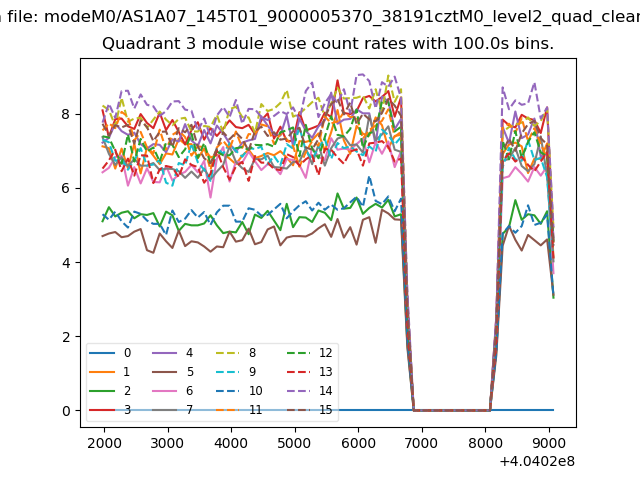
| Module-wise count rates for Quadrant C Data is divided into 100 sec bins |
 |
 |
| Module-wise count rates for Quadrant D Data is divided into 100 sec bins |
 |
 |
| Parameter | Plot |
|---|---|
| CZT HV Monitor |  |
| D_VDD | 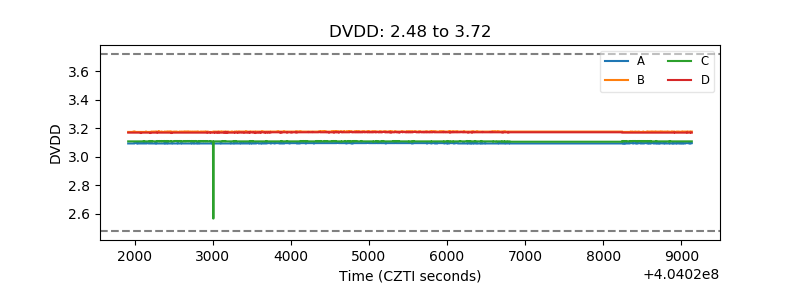 |
| Temperature 1 | 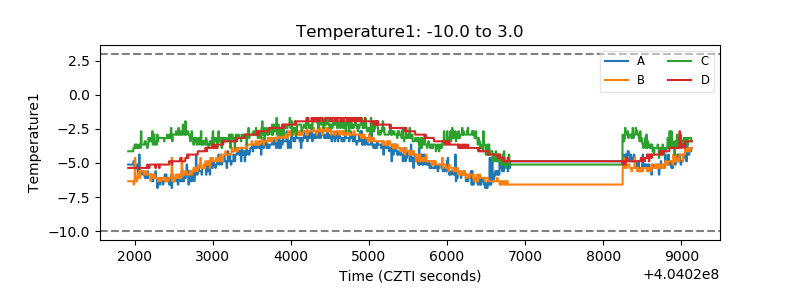 |
| Veto HV Monitor | 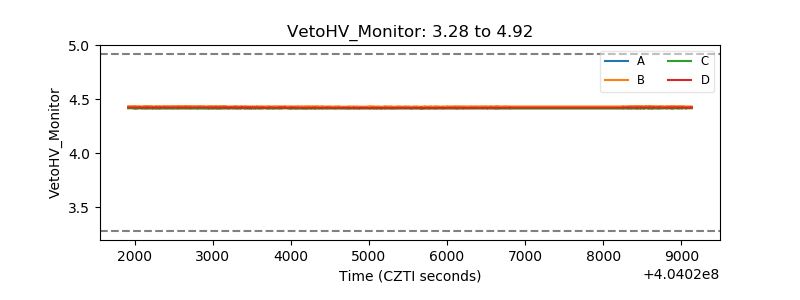 |
| Veto LLD | 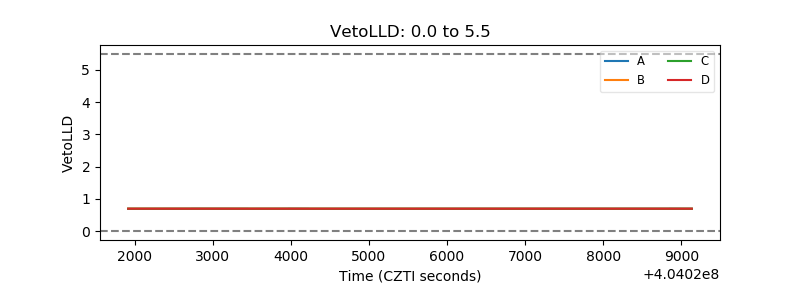 |
| Alpha Counter | 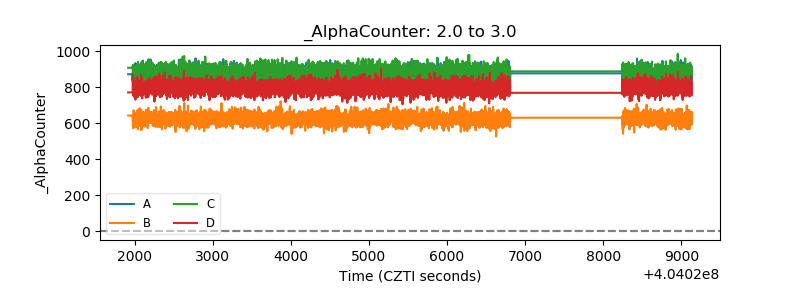 |
| _CPM_Rate |  |
| CZT Counter | 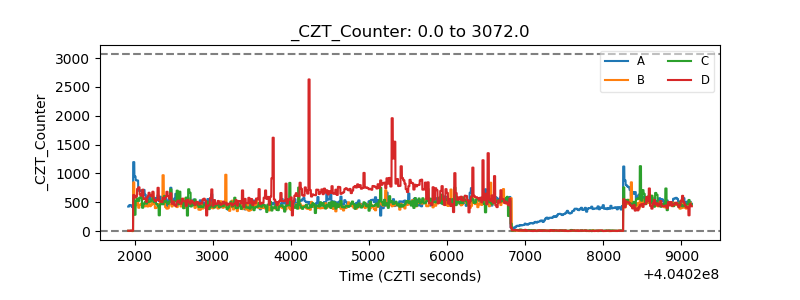 |
| +2.5 Volts monitor | 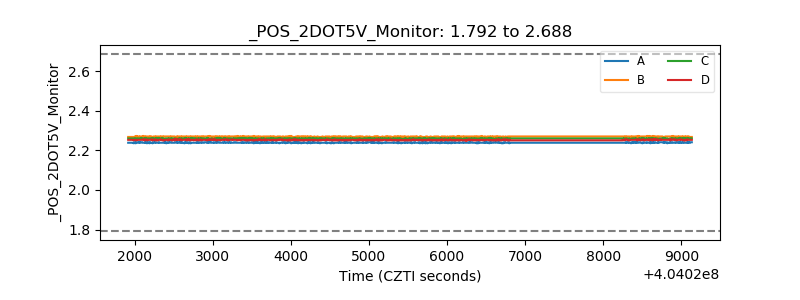 |
| +5 Volts monitor | 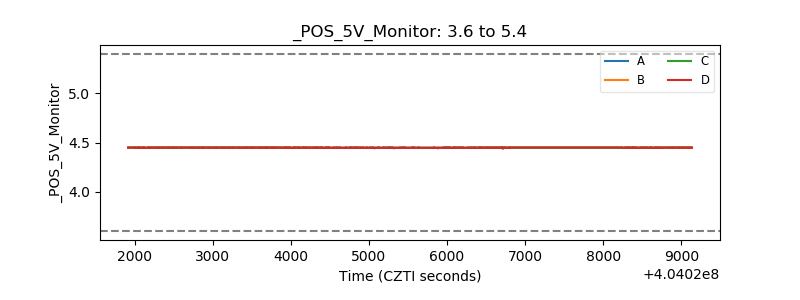 |
| _ROLL_ROT | 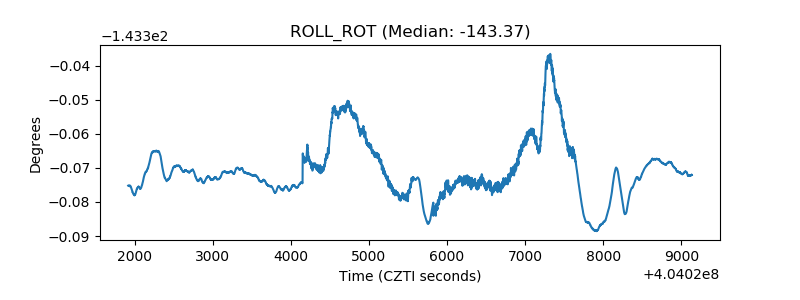 |
| _Roll_DEC | 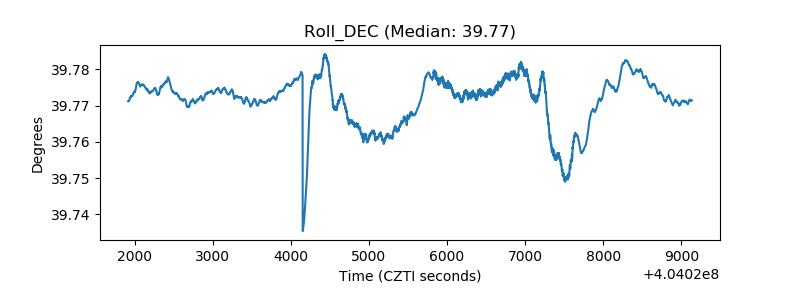 |
| _Roll_RA | 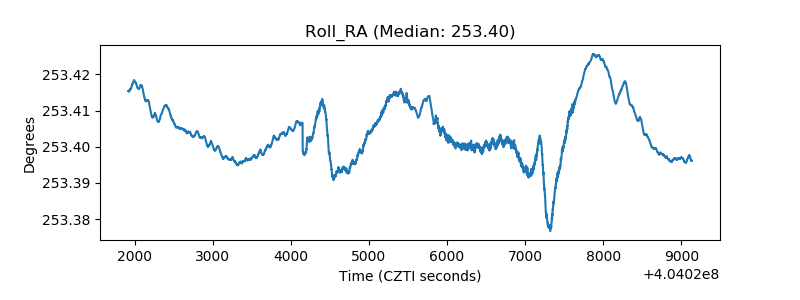 |
| Veto Counter | 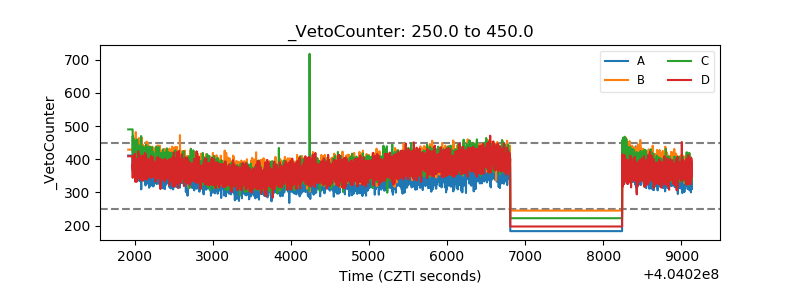 |